Keywords: Blumea balsamifera; apigenin; aldose reductase inhibition; HPLC
1. INTRODUCTION
Blumea balsamifera belonging to Asteraceae family is a flowering plant that is widely distributed in open fields, grasslands, and waste areas at low and medium altitudes in regions of Southeast Asia, such as Southern China and the Philippines [1]. B. balsamifera is a shrubby plant, standing 2 - 3.5 m tall, usually in the form of a bush of about 2 m tall but not less than l m or very rarely a tree about 4 m tall. Smells are strongly of camphor when bruised [2]. This plant has numerous uses in traditional Thai and Chinese medicine, including the treatment of septic wounds and kidney disorders [2-5]. Decoctions of the leaves and roots of this plant are used against fever and stomach pain [6]. The leaves of the plant are also reported to have antifungal, antibacterial, antifebrile, anodyne, coryza, fever, influenza, cough, and dyspepsia properties [7,8]. Furthermore, B. balsamifera has attracted attention as a medicinal plant as it possesses various physiological activities such as anti-obesity [9], plasmininhibitory [1], anti-fungal [8], liver-protective [10], and anti-cancer effects [11].
Investigation of phytochemical constituents from B. balsamifera showed significant amounts of flavones, monoterpenes and triterpenes [12-14]. Fazilatun et al. [14, 15] reported the isolation of velutin and dihydroquercetin-7,40-dimethylether from pet-ether extracts; blumeatin and luteolin-7-methylether from the chloroform extracts; and ombuine, tamarixetin, rhamnetin, luteolin, luteolin- 7-methylether, quercetin, 5,7,30,50-tetrahydroxyflavanone, blumeatin, and dihydroquercetin-40-methylether from the methanol extracts of B. balsamifera. However, up to our knowledge, it has not been reported to evaluate the aldose reductase (AR) inhibitory activity of natural compounds in B. balsamifera.
In the present study, as a preliminary step for the evaluation of the potential of naturally occurring AR inhibitors from B. balsamifera, we tested the effects on rat lens AR inhibition and the quantities of the compound.
2. MATERIALS AND METHOD
2.1. Plant Materials
B. balsamifera were collected from the Philippines. A voucher specimen (No. LEE 2011-06) was deposited at the Herbarium of Department of Integrative Plant Science, Chung-Ang University, South Korea.
2.2. Apparatus and Chemicals
EI-MS spectrum was obtained with a Jeol JMS-600W mass spectrometer (Tokyo, Japan). 1Hand 13C-NMR spectra were recorded on a Bruker Avance 400 NMR spectrometer (Rheinstetten, Germany). Chemical shifts are shown as δ-values (ppm) with tetramethylsilane (TMS) as an internal standard, and coupling constants (J) were expressed in Hertz. TLC was performed with precoated silica gel 60 F254 plates (Art. 5715, Merck Co., Darmstädt, Germany). Compounds on TLC plates were visualized by spraying with 10% sulfuric acid in methanol followed by heating at 100˚C to detect spot color. HPLC data were recorded on a Waters Breeze System (Waters, USA) equipped with a Waters 1525 binary HPLC pump and Waters 2489 system UV/Vis detector. Fluorescence was measured with a Hitachi U-3210 (Brisbane, CA). Silica gel (200 - 400 mesh ASTM; Merck Co., Darmstädt, Germany) and solvents such as β-NADPH, sodium phosphate buffer, dl-glyceraldehyde potassium phosphate buffer, 3,3-tetramethyleneglutaric acid (TMG), and dimethyl sulfoxide (DMSO-d6) (Sigma-Aldrich, St. Louis, MO) were used.
2.3. Extraction, Fractionation, and Identification
B. balsamifera leaves were dried, finely powdered, and then extracted with methanol (MeOH) for 3 h (6 L × 5) under reflux at 65˚C - 75˚C. The MeOH extract was collected after filteration and removal of solvent in vacuo. This extract was then suspended in distilled water and partitioned with n-hexane, dichloromethane (MC), ethyl acetate (EtOAc), and n-butanol (n-BuOH), successively. Compound 1 was isolated from the EtOAc fraction of B. balsamifera by TLC analysis and was identified from the EtOAc fraction by prep-TLC analysis. The structure of compound 1 was elucidated by IR, EI-MS, 1Hand 13CNMR spectra as below.
Compound 1: IR νmax (KBr): 3422 (OH), 1651 (C=O) cm−1; EIMS (rel. int. %): m/z 270 [M]+ (100), 242 (10.8), 153 (13.2), 152 (7.4), 121 (9.8), 118 (6.1), 69 (4.2); 1HNMR (400 MHz, DMSO-d6): δ 12.93 (1H, s, 5-OH), 10.90 (1H, br s, -OH), 10.40 (1H, s, -OH), 7.91 (2H, d, J = 8.8 Hz, H-2',6'), 6.92 (2H, d, J = 8.9 Hz, H-3',5'), 6.76 (1H, s, H-3), 6.48 (1H, d, J = 2.2 Hz, H-8), 6.18 (1H, d, J = 2.2 Hz, H-6); 13C-NMR (100 MHz, DMSO-d6): δ 182.2 (C-4), 164.5 (C-7), 164.3 (C-2), 161.8 (C-4'), 161.6 (C-5), 157.8 (C-9), 128.9 (C-2',6'), 121.6 (C-1'), 116.4 (C-3',5'), 104.1 (C-10), 103.3 (C-3), 99.3 (C-6), 94.8 (C-8).
2.4. Sample Preparation for HPLC
To quantify the abundance of compound 1 in B. balsamifera extracts, each extract (0.5 mg) was dissolved in MeOH (500 μL). The resulting solutions were filtered through a Whatman 0.45 μm PVDF syringe filter (Cat No. 6779, NJ, USA) prior to HPLC.
2.5. Quantitative Analysis of Compound 1
HPLC separation of compound 1 in B. balsamifera extracts for quantitative analysis was performed using a reverse phase system. A reverse phase column (Discovery C18, 5 μm, 250 × 4.6 mm, Supelco Analytical, USA) was used, and an isocratic solvent system (water : MeOH, v/v) was employed as the mobile phase. The isocratic solvent system was 45:55 for 60 min. The flow rate was kept constant at 1.0 mL/min, and the peaks were identified using UV absorbance at 350 nm. The injection volume consisted of 10 μL of the prepared MeOH solution. HPLC analyses were performed in triplicate.
2.6. Limit of Detection (LOD) and Limit of Quantification (LOQ)
Validation of the HPLC method for compound 1 as a standard compound was determined by LOD and LOQ. The linearity of the method was established by triplicate injections in the range of 0.0025 - 1.0 mg/mL. Calibration standard solutions were prepared at seven different concentration levels (1.0, 0.5, 0.25, 0.025, 0.0125, 0.00625 and 0.0025 mg/mL) and injected in triplicate. Calibration curves were constructed by linear regression of the peak area-ratios (Y) of compound 1 versus the concentration (X) in mg/mL; the relative standard deviation was used as a measure of repeatability. The percent recoveries were evaluated by calculating the ratio of amount detected versus amount added. The values of LOD and LOQ were determined separately at a signal to noise ratio (S/N) of 3 and 10, respectively.
2.7. Calibration Curve
Standard stock solutions (0.5 mg/500 μL) of compound 1 were prepared in MeOH and repeatedly blended with the same solvent. The concentration of compound 1 was ascertained by comparing the integrated peak area of the individual compound with that of a standard curve prepared from the corresponding standard. The peak area (Y), concentration (X, mg/mL), and mean values (n = 4) of the calibration functions of compound 1 were calculated.
2.8. Measurement of AR Activity
Lenses were removed from Sprague-Dawley rats (weighing 250 - 280 g) and preserved by freezing until use. Next, the lenses were homogenized and centrifuged at 10,000 rpm (4˚C, 20 min), and the supernatant was used as an enzyme source. AR activity was determined spectrophotometrically by measuring the decrease in absorption of β-NADPH at 340 nm for a 4 min period at room temperature with dl-glyceraldehydes as a substrate [16]. The assay mixture contained 0.1 M potassium phosphate buffer (pH 7.0), 0.1 M sodium phosphate buffer (pH 6.2), 1.6 mM NADPH, and test extract sample (in DMSO) with 0.025 M dl-glyceraldehyde as substrate. Compound 1 (1.0 mg) was dissolved in DMSO (1 mL). The total volume of assay mixture for each test was 1 mL and took place in a quartz cell. The concentrations of the test sample that produced 50% inhibition of enzyme activity (IC50) were calculated from the least-squares regression line of the logarithmic concentrations plotted against the residual activity. TMG was used as a positive control.
3. RESULTS AND DISDUSSION
The MeOH extract and stepwise polarity fractions (nhexane, MC, EtOAc, and n-BuOH fractions) of B. balsamifera were tested for their in vitro inhibition of AR from rat lenses. As shown in Table 1, all fractions except the n-hexane fraction exhibited AR inhibitory activities with various degrees of effectiveness. The inhibitory effect of the MeOH extract and all fractions except the n-hexane fraction increased with increasing concentration. Among the fractions, the EtOAc fraction showed the strongest inhibitory activity with an IC50 value of 0.11 μg/mL, which is comparable to the commercial synthetic AR inhibitor TMG (IC50 = 0.84 μg/mL). The inhibitory activity of the EtOAc fraction was followed by the n-BuOH fraction (IC50 = 2.32 μg/mL), MeOH extract (IC50 = 2.62 μg/mL) and MC fraction (IC50 = 5.42 μg/mL).
Compound 1 from the active EtOAc fraction on AR was identified as apigenin (Figure 1) by comparison of the spectral data with published values [17,18]. Apigenin (1) from B. balsamifera was assayed for its AR inhibitory activity, which prevent diabetic complications. To evaluate the rat lens AR inhibitory activity, the inhibitory percentage and IC50 values were calculated. As a result, apigenin had high AR inhibitory activity with an IC50 value 4.03 μM, comparable to that of the positive control, TMG (Table 2).
Apigenin, a member of the flavone family of flavonoid compounds, is widely distributed in many vegetables and fruits including apple, guava, tomato, Chinese cabbage,

Table 1. IC50 values of the MeOH extract and fractions from B. balsamifera on AR in rat lens.
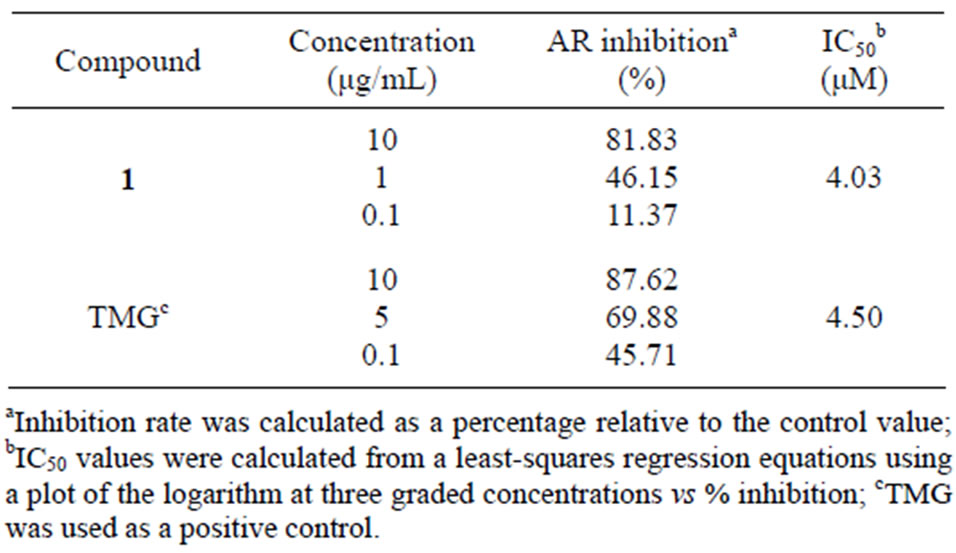
Table 2. IC50 values of apigenin from B. balsamifera on rat lens AR.
bell pepper, garlic, wolfberry leaves, local celery, orange, chamomile, onion, wheat sprouts and broccoli. It is also present in tea and wine and possesses anti-inflammatory, free radical scavenging and anti-carcinogenic effects [19- 21]. Apigenin has recently received much attention due to its strong cytotoxic activity in numerous types of cancer cells, including breast, colon, lung, neuroblastoma, liver, prostate, pancreas and oral cancer cells, in which promotion of cell apoptosis of cancer cells has been proposed to account for its anti-cancer effects [22-24]. It also suppresses insulin-like growth factor signaling, which regulates animal development [25]. Apigenin is capable of coordinating multiple survival-related pathways, including nuclear factor-КB, focal adhesion kinase, β-catenin, phosphatidylinositol 3-kinase (PI3K)/Akt, and p38 pathways [26-33]. Lee et al. [34,35] reported the isolation of apigenin from Circum rhinoceros and Elscholtzia cristata which was later demonstrated to reduce GABAactivated Cl-currents in a dose-dependent fashion and inhibit locomotor activity following intraperitoneal injection [36,37].
Determination of the abundance of apigenin in B. balsamifera was conducted by HPLC analysis. The retention time for apigenin was 29.7 min. The calibration equation of apigenin was Y = 28410X + 53827 (Figure 2) and the correlation factor (r2) was 0.9996. The calibration equation and retention time are shown in Table 3. The retention time was as expected for the peak of apigenin in B. balsamifera. The content of apigenin in B. balsamifera was determined to be 0.47 mg/g by HPLC/UV analysis (Table 4). The LOD and LOQ under the present chromatographic condition were determined at signal tonoise ratios (S/N) of 3 and 10, respectively. LOD and LOQ for ten marker compounds were determined by performing ten injections of each compound at concentrations incrementally approaching the LOD and LOQ, respectively. The LOD and LOQ values of the ten analytes ranged from 0.128 to 0.383 mg/mL, respectively (Table 5).
This is the first report to determine the AR inhibition activity of apigenin in B. balsamifera even though there are many reports on flavonoid and phenol constituents having strong AR inhibitory activities [38-43]. These results insisted that B. balsamifera could be a useful natural source in the development of a novel AR inhibitory agent against diabetic complications. Consequently, B. balsamifera as an agricultural crop may be useful for generation of natural health supplements in the future.

Table 3. Calibration curve of apigenin.

Table 4. Content of apigenin in B. balsamifera.

Figure 2. Calibration curve of apigenin.

Table 5. LOD and LOQ of apigenin in B. balsamifera.
4. ACKNOWLEDGEMENTS
We thank the National Center for Inter-University Research Facilities (Seoul National University, South Korea) for the measurement of spectroscopic data.