A Semi-automatic method for segmentation and 3D modeling of glioma tumors from brain MRI ()
1. INTRODUCTION
The extraction of 3D objects and its visualization is one of the most important steps in the analysis of the preprocessed medical image data, which can help in performing diagnosis, treatment planning, and treatment delivery. Thus in practice, radiation oncologists spend a substantial portion of their time performing the segmentation task manually, using one of the available visualization and segmentation tools [1]. Also, there may be cases where the automatic methods fail or perform poorly. Another consideration is that medical doctors must always have final control over the segmentation [2].
The most common primary brain tumors are gliomas, wherein 70% are in the group of malignant gliomas (anaplastic astrocytoma World Health Organization (WHO) grade III), glioblastoma multiforme (GBM) WHO grade IV) [3]. The GBM is one of the highest malignant human neoplasms. Due to the biological behavior, gliomas of WHO grade II to IV cannot be cured with surgery alone. The multimodal therapeutical concept involves maximum safe resection followed by radiation and chemotherapy, depending on the patient’s functional impairment scale. The survival rate is still only approximately 15 months, despite new technical and medical accomplishments such as multimodal navigation during microsurgery, stereotactic radiation or the implementation of alkylating substances [4]. The clinical follow-up of tumor volume is essential for an adaptation of the therapeutical concept. Therefore, the exact volume evaluation is fundamental to reveal a recurrent tumor or tumor progress as early as possible.
The driving problem discussed in this paper is the segmentation of 3D brain tumors from magnetic resonance image data. Tumors vary in shape, size, location, and internal texture, and hence tumor segmentation is known to be a very challenging problem [5]. Various promising computer-assisted techniques to extract tumors and blood vessels from 2D MRI have been described in the literature. Of these, Tumor Extraction by Combining k-means Clustering and Perona-Malik Anisotropic Diffusion Model [6], Brain Tumor segmentation from MRI Based on Energy Functionals [7], unsupervised automatic segmentation algorithm using expectation maximization [8] technique, binary mathematical morphology [9,10], Automatic seeded region growing method [11] and Segmentation with Radix4 FFT [12] are some of the examples based on this method. Segmentation using knowledge based techniques [13] are, fuzzy based segmentation [14, 15], segmentation using texture analysis [16], Adaptive template moderated [17], and Atlas based segmentation [18]. Of these, the most popular approaches are based on applying clustering techniques to the features extracted from multiprotocol MR imaging. When manual tracing by a knowledgeable operator is used as ground truth, the overall agreements for the results of automatic methods are ranging from 82% to 94% [19]. For some of these methods, the time required for the computations has been reported to vary from several hours to several tens of hours. Presumably, with modern computing platforms, this time can be reduced to several minutes or several tens of minutes [19]. The 3D segmentation of tumors from 3D image data sets by stacking up a sequence of 2D tumor contours detected by 2D level-sets method in the parallel cross-sectional MRI images [20,21], IARD segmentation techniques [22] which operates efficiently for certain regions of MRI, and hierarchical segmentation method using variational tools that extract bones and blood vessels as two separate 3D objects [23] are some of the 3D segmentation techniques available in literature.
This work highlights an interactive method for brain tumor segmentation, which overcomes some of the above mentioned difficulties. The method consists of automatic segmentation of tumors from 2D MRI slices using morphological methods and these segmented tumor slices are exported to a 3D tool kit in MATLAB. For verification of rendered 3D tumor volume, we used 3D-DOCTOR software package that is usually using by Radiologists. In this work, T2 weighted and T1 FLAIR image was used for extracting tumors from 2D slices.
This Paper is organized as follows. Section II provides a brief overview of image segmentation of tumors from 2D slices and 3D rendering techniques. Section III details results obtained and discussion and finally, a conclusion about the results is presented.
2. METHODS AND MATERIALS
The flow chart for entire procedure of this work is shown in Figure 1. The method involved mainly two parts. The First part is automatic segmentation of tumor from the acquired slices having presence of tumor, in an MRI dataset. The second part involved stacking 2D slices of segmented tumor and perform volumetric rendering using MATLAB tool kit.
2.1. Image Acquisition
In this work, MRI images were collected from the Department of Radiology, Sree Chitra Institute of Medical Sciences and Technology (SCIMST) and Regional Cancer Centre, Thiruvananthapuram, Kerala, India. The images were gray scale images. Axial slices of T2 weighted and T1 FLAIR brain MRI data were considered. In this method, segmentation of Regions of Interest (ROI) was
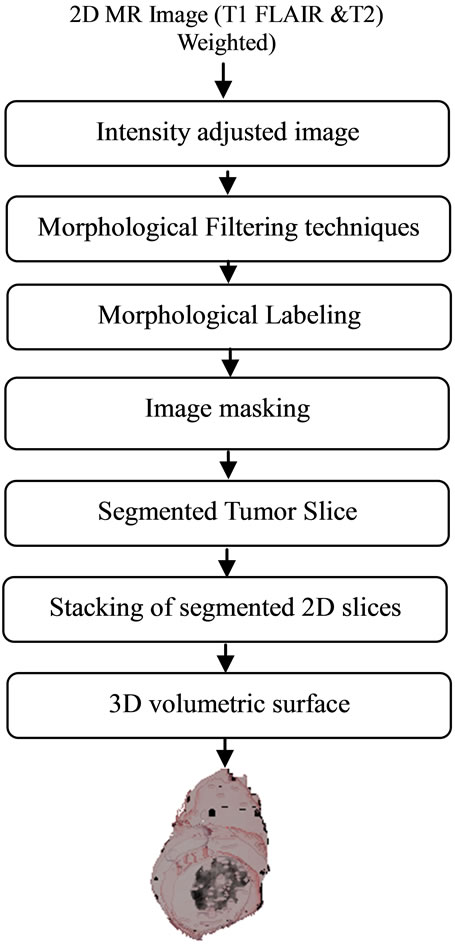
Figure 1. The flow chart for segmentation of volumetric 3D tumor.
calculated on ten MR image data sets with each set containing 20 slices. For 3D rendering operation, only slices which contain tumor portions are considered. Image database development and validation of the algorithms were based on this MRI database which was already manually identified and segmented by the Radiologist. The selected images were histo-pathologically tested and have confirmed the presence of the disease. The Entire procedure was done using MATLAB and verification of 3D rendered data we used a software package called 3D DOCTOR that is usually used by Radiologists.
2.2. Image Segmentation of Tumor and 3D Rendering
The goal of this work is to extract the tumor and to create 3D models and volume rendering from 2D slice images. T1 FLAIR and T2 weighted images of the same slice used for glioma tumor extraction are given in Figures 2(a) and (b).
As a part of pre processing, skull stripping was performed. Skull stripping is a method of removing the skull and non brain intracranial tissues like fat, muscle, skin etc., that surround the surface of brain cortex and cerebellum in the brain. Brain Extraction was necessary to avoid the misclassifications of the surrounding tissues, skin and scalp as WM or GM. By removing this object, non-brain tissues will be removed and, only soft tissues will remain in the image. Skull stripping was based the on morphological operation known as erosion, using a disc shaped structuring element, which resulted in the removal of thin connections between the brain and non brain portions. Thus a skull stripped brain mask was obtained and this method was automated for every image slice.
Mathematical expression for erosion of A by B is given by: , where “A” is the image being processed, and “B” is a small set of pixels called the structuring element (SE). It is a thinning operation. The level of thinning depends on the structure and shape of the SE chosen. The image obtained after erosion is the skull stripped image “I1”.
Next the brain component “I1” was dilated by a SE, “B1” is slightly smaller in size than the one used in the morphological erosion, this corresponds approximately to restoring the boundaries of the brain component that were distorted in the erosion step.
Dilation of “I1” by “B1” is given by:  . It is a thickening operation. For the entire morphological operations in this work, disc shaped structuring element were selected with varying diameter depending upon the nature of structure to be segmented.
Intensity adjustment and thresholding was done to obtain binary thresholded image (Figure 2(d)). Binary image thus obtained was morphologically labeled for obtaining the largest connected component. This lead to obtain a binary mask (Figure 2(e)) of the brain tumor and gray level values were obtained by masking the initial MR image by this mask. In this way, all pixels outside the tumor were set to 0, while the others keep their initial value that was used for further analysis as shown in Figure 2(f).
The 2D segmented slices are stacked before performing rendering operation. In an image data set, out of the twenty two slices only seven or eight slices are useful for segmentation.
The main steps to create 3D models and volume rendering from 2D slice images:
1) Create an empty space for 3D volume.
2) Each image pixel’s x and y coordinate on 2D will be transferred to the empty space. The slice number with respect to the distance between each slice is taken as z coordinate. If a pixel is adjacent to another pixel, the 3D points will be connected together.
3) Repeat the previous 2 steps until all slices are done. All the points in the 3D space will be connected just like in the 2D slices.
4) 3D volume rendering.
For the correct rendering of stacked image slices, since all 2D images are of the same dimension, hence the 3D volume can hold all of them in a rectangular cube. Different degrees of interactive control are provided for 3D tools in MATLAB, for the semi-automatic 3D propagation and rendering. In this way, we can perform a hierarchical volume rendering of the segmented slices.
3D medical imaging software called 3D DOCTOR is used for verification of volume rendered tumor. This package was developed using object-oriented technology and provides efficient tools to process and analyze 3D images, object boundaries, 3D models and other associated data items in an easy-to-use environment.
3. RESULTS AND DISCUSSIONS
This section presents the results obtained from the automatic segmentation using morphological methods on T1 FLAIR and T2 weighted axial MR images of the same slice and the 3D rendered gray level tumor from the segmented image slices. Segmentation is only implemented for tumor-contained slices. These segmented slices were stacked for volume rendering. Segmented slices are shown in Figure 3. The segmented slices were stacked and 3D modelled as shown in Figure 4. The maximum width of this tumor is 1.9 cm, length 2.5 cm and total size of the tumor is 0.68 cm3, it should be noted that the width and height of the tumor is not uniform as shown in the segmented slices.
Usually there are only seven or eight slices which contain tumor in an image data set. The major advantage
of this segmented volumetric primary tumors (Glioma) are, preserving the shape and gray level values of the original image for processing. For further texture based analysis and classification gray level intensity images are very essential.
The goal of this semi-automatic interactive segmentation and 3D modeling tool was to make automatic segmentation and 3D modeling of MR images more practical by replacing manual outlining of the tumor by Radiologist, without any loss in accuracy. The 3D modeled tumor volume is verified with the help of 3D DOCTOR software package presently used by Radiologists and medical practitioners. Our validation was done by a Radiologist to determine how closely the segmented images and 3D tumor volume obtained by the above method correlated with the ground truth images (manual) and it was verified to be correct.
4. CONCLUSIONS
A Novel method for the 3D modeling of glioma tumors using 2D segmented slices is presented in this paper. Manual segmentation of 2D slices is more time consuming and is very much prone to error. This interactive 3D modeling method is very accurate and less time consuming than any other method. These volumetric tumors can
 (a)
(a)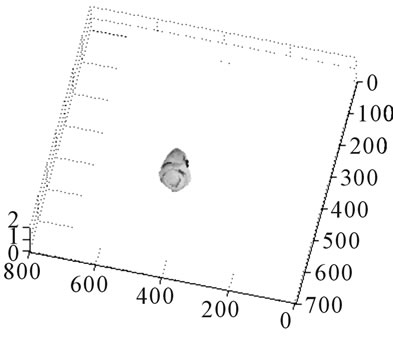 (b)
(b) (c)
(c)
Figure 4. Volumetric tumor rendered using stacked segmented slices shown in Figures 3(a) and (b). Volumetric tumor for different azimuth and elevation angle. (c) Volumetric tumor image by 3D DOCTOR software.
be used for volumetric analysis because it is preserving the gray level values of the original image for processing.
Volumetric tumor representations are suitable for image registration, surgical planning for detection of tumor growth and also for determining prognosis of patients in the case of high grade tumors. It may be noted that, the use of this method is fairly simple when compared to the other frequently used methods. Since it is preserving the gray level values it will be very useful for texture quantification using statistical, structural and spectral approach.
5. ACKNOWLEDGEMENTS
We would like to thank Dr. Bejoy Thomas, MD.; DNB.; PDCC, Additional Professor, Dept. of Imaging Sciences and Interventional Radiology, Sree Chitra Tirunal Institute for Medical Sciences and Technology, Kerala, India for his valuable help, suggestions and validation of these results for this work and for providing MR images Radiology department of Sree Chithra Tirunal Institute medical Sciences and Regional Cancer Centre, Trivandrum, Kerala, India