Sugars, Organic Acids and Total Phenols in Varieties of Chestnut Fruits from Tenerife (Spain) ()
1. Introduction
Nuts have been part of the human diet for a long time; remains have been found in archaeological sites dating back to before 10,000 BC. Different constituents (linolenic acid, folic acid, arginine, fibre, vitamin E, potassium, copper and magnesium) positively contribute to the nutritional value of nuts [1]. These constituents occur at high levels in most nuts. In contrast to the majority of fruit nuts, chestnuts are characterized by low fat and protein contents but high carbohydrate and moisture content [2-4]. The nature and concentration of sugars and organic acids are important factors influencing the sensorial characteristics of fruit and vegetables, namely their flavour [5]. The relative amounts and the presence/absence of each compound have been considered useful in taxonomic studies [6,7] for the determination of percent fruit content in fruit derivatives (Silva et al. 2002) and also to evaluate food processing [8,9]. Additionally, some organic acids (ascorbic acid and phenolic acids) may have a protective role against various diseases due to their antioxidant activity [10].
Chestnut crops have been introduced into the Canary Islands, since colonization in the 16th century by Spanish and Portuguese settlers. In the Canary Islands, the chestnut is a secondary crop, being located in the edge of the orchards or forming wooded masses. Nowadays, thirty eight varieties of chestnuts have been identified in Canary Islands [11].
The contents of sugars, organic acids and total phenols were determined in varieties of chestnuts in order to complete the information about the chemical composition of all these varieties. In addition, we studied the influence of the production zone on the content of these parameters in chestnuts.
2. Materials and Methods
2.1. Reagents and Standards
Acetonitrile and methanol of HPLC-gradient grade, sodium dihydrogen phosphate (NaH2PO4) and phosphoric acid were purchased from Merck (Darmstadt, Germany); ethanol from Scharlau (Barcelona, Spain); gallic acid from Sigma (St. Louis, MO, USA); and 2,6-dichlorophenol-indophenol from Fluka (Buchs, Switzerland). Standards of D-(+)-glucose anhydrous, D(−)-fructose, sucrose, L-glutamic, maleic, L(−)-malic, ascorbic and oxalic acids were supplied by Fluka (Buchs, Switzerland); cis-aconitic, trans-aconitic, fumaric, (−)-quinic, L-(+)- tartaric acids and sodium pyruvate came from Sigma (St. Louis, MO, USA); citric, shikimic and succinic acids from Aldrich (Milwaukee, WI, USA). Stock solutions for sugar analysis (1 g/L) and organic analysis (5 g/L) (except for ascorbic acid that was prepared in metaphosforic acid 0.375 M) were prepared in ultrapure water (Millipore, Bedford, MA) and stored in darkness at 5˚C. Deionized water was purified with a Milli-Q water system (Millipore, Bedford, MA).
2.2. Sampling and Sample Preparation
A total of 40 samples of chestnuts belonging to 21 different varieties were collected and authenticated by technicians from the Excmo. Cabildo Insular de Tenerife (Insular Government). The main characteristics of the analyzed chestnut samples are described in Table 1. The chestnut samples were collected from two production zones of the island of Tenerife (Spain), namely: La Orotava, La Matanza de Acentejo, La Victoria de Acentejo and El Sauzal in the north of the island; and Arafo in the south of the island. The age of the chestnut trees ranged between 40 and 200 years. The relief of Tenerife is a steep and mountainous, dominated by the presence of the Mount Teide (3718 m), which separates the island into two slopes (South and North side) that differ significantly in terms of their climatic conditions. The southern zone is characterized by windier and drier meteorological conditions compared to the northern zone. In the northern zone, the average temperature between 1980 and 2000 was 16.5˚C (12.9˚C - 20.0˚C) and in the southern zone was 21.3˚C (17.9˚C - 24.7˚C). Also, the average rainfall per year were 557 and 116 mm for the northern and southern zone, respectively.
After harvesting, the chestnuts (approximately 30 - 50 units) were brought to the laboratory and were prepared immediately. The shell (pericarp) and skin (endocarp) were removed, and the chestnuts were immediately homogenized with a mincer (Solac, Vitoria, Spain) during a 3 min, to obtain a puree. Several sub-samples were taken to measure moisture. For ascorbic acid, approximately 3 g of this homogenized was introduced into an erlenmeyer containing 10 mL of metaphosphoric acid 0.375 M, and then they were frozen at T = −80˚C. The rest of homogenized was stored in a polyethylene tube at –80˚C until analysis.
2.3. Analytical Determinations
Moisture was immediately determined in the homogeneized chestnuts by the oven drying method [12]. The total phenols content in the chestnut samples were determined at 750 nm using a Hewlett Packard 8453 (Waldbronn, Germany) spectrophotometer after the colourimetric reaction with the Folin-Ciocalteu reagent (Sigma, St. Louis, MO) by following the method proposed by Kujala et al. [13]. Gallic acid standard (Sigma; St. Louis, MO) solutions were used for the external standard calibration curve. The ascorbic acid was determined by the 2,6-dichlorophenol-indophenol titration procedure [12]. All these analysis were carried out in triplicate.
2.4. Sugars Analysis
The determination of sugars was performed by HPLC according to the method described by Rodríguez Galdón et al. [14]. About 1 g of the frozen homogenized chestnut was weighed directly in polypropylene tubes and mixed with 2 mL of 4:1 ethanol:water. Afterwards, the tubes were put into an ultrasound bath for 5 min and centrifuged for 5 min at 1090·g. The supernatant was carefully recovered to prevent contamination. Then, another 2 mL of 4:1 ethanol:water was added to the pellet and placed in an ultrasound bath and centrifuged as above. The two supernatants were recovered in the same tube. This liquid phase was concentrated with a nitrogen stream until elimination of all the ethanol, and the residue was adjusted to 5 mL with ultra-pure water (Milli-Q water system) and stored at T = –80˚C in the freezer. A milliliter of the dissolution was passed through a 0.45 µm filter GHP (Waters, Millford, MA, USA) prior to HPLC analysis.
The sugars were determined using an HPLC method with differential refractive index (DRI) detector. The Waters (Milford, MA, USA) apparatus comprised of a pump (600 E Multisolvent Delevery System), an autosampler (700 Wisp Model) and a DRI detector (Waters model 2414). The separation was performed by using a Waters Carbohydrate Analysis column (3.9 × 300 mm) with a particle size diameter of 10 µm, equipped with a Waters Carbohydrate CarboTM 4 µm guard column. The column was kept at 25˚C throughout the experiments. The HPLC pumps, autosampler, column oven and DRI detector were monitored and controlled using the Millennium32 system.
The mobile phase was composed of 4:1 acetonitrile:water. The injection volumes of the samples were 25 µL for both standards and sample extracts, with a flow rate of 2 mL∙min−1. The HPLC sample peaks were identified by comparing the retention times obtained from standards. The chestnut samples were also spiked with standards in order to verify the identity of the chromatographic peaks. Duplicate injections were performed and average peak areas were used for the quantification.
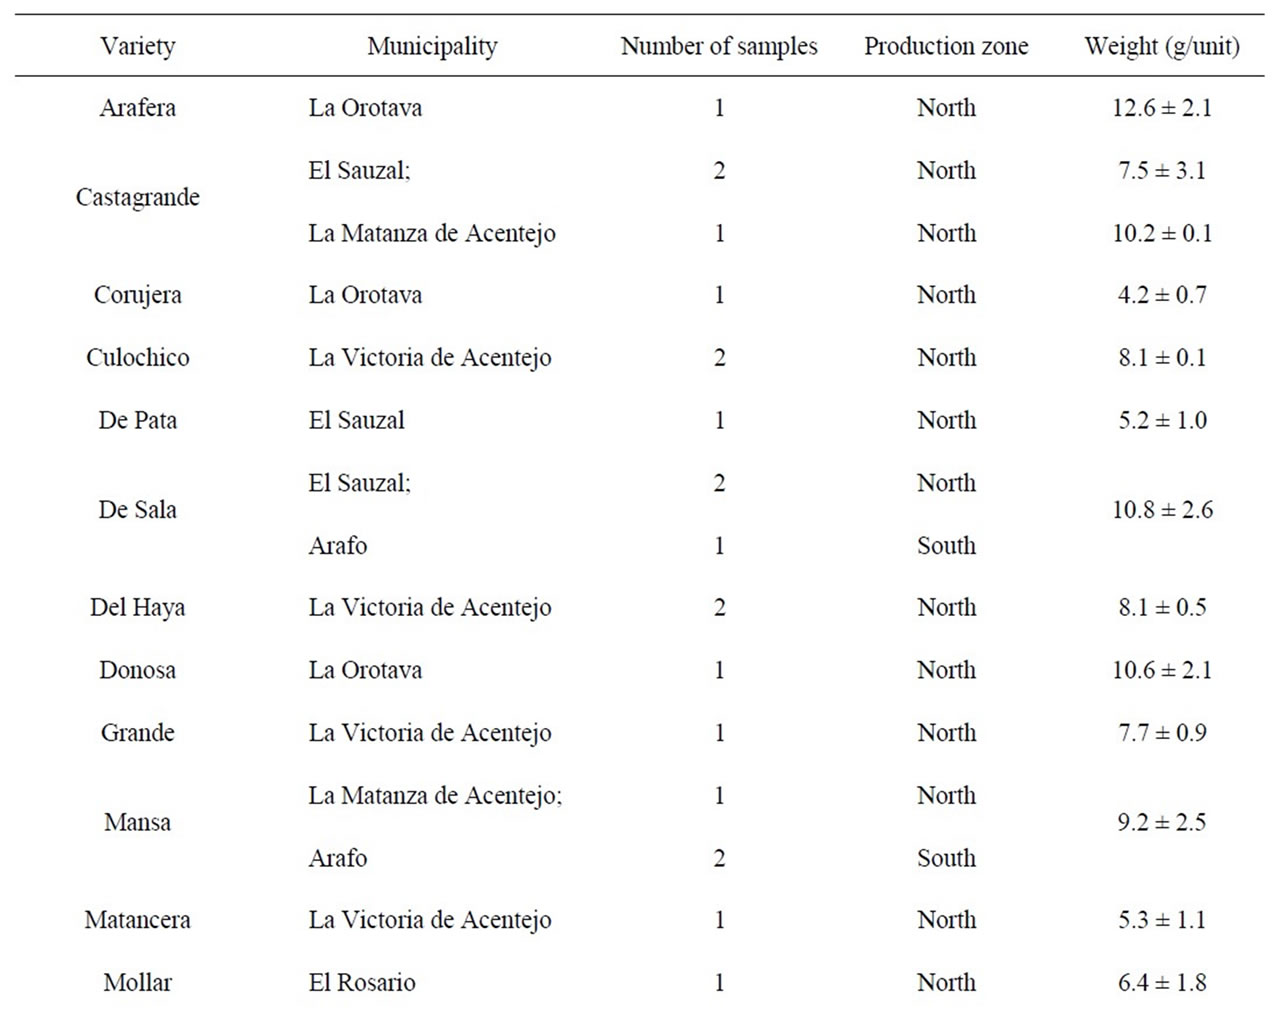
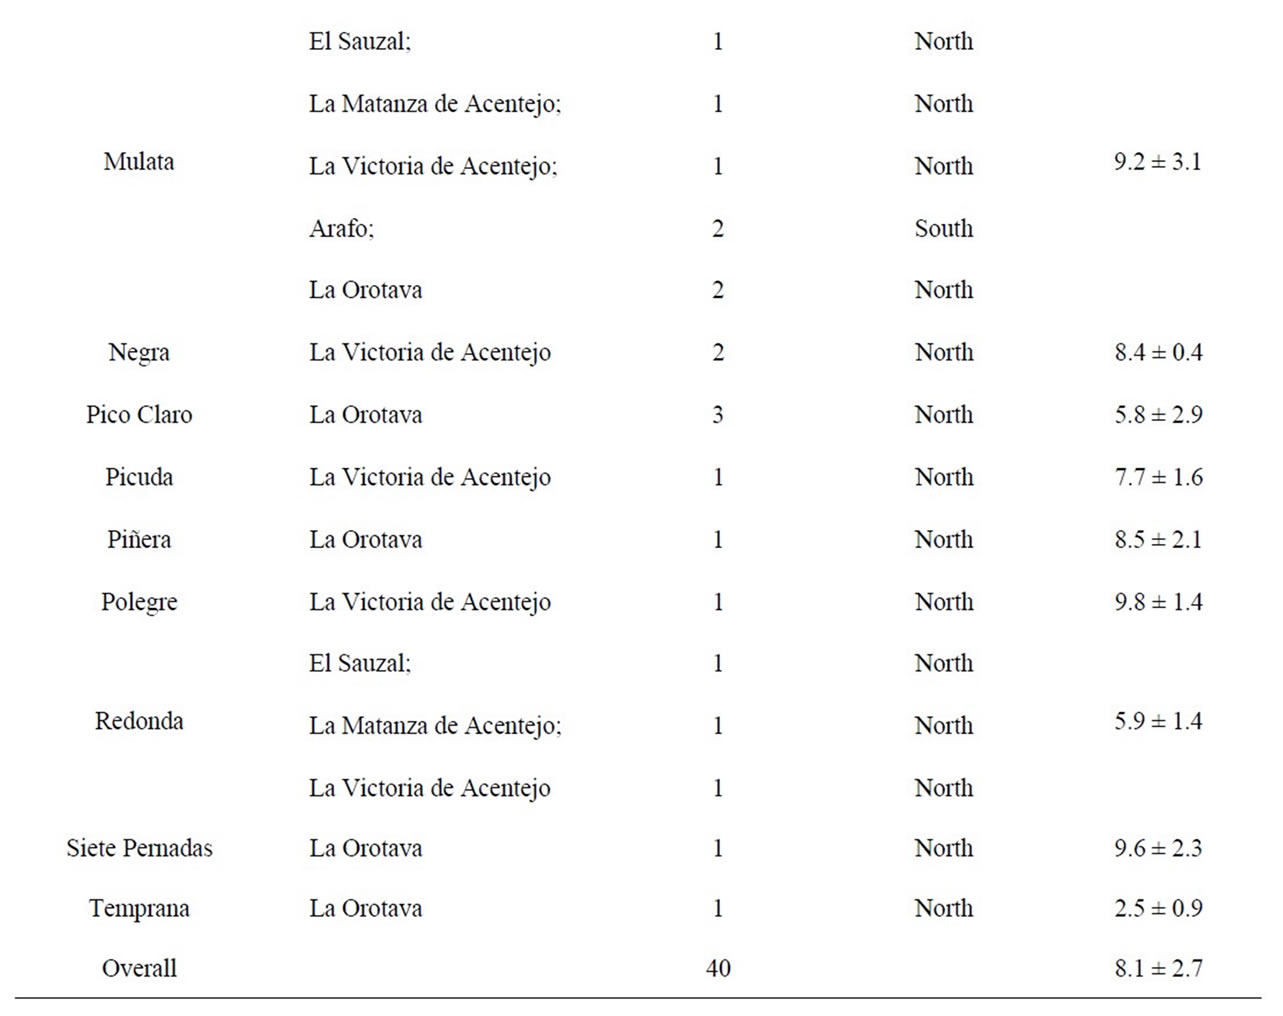
Table 1. Description of chestnut varieties and zones of production.
2.5. Organic Acids Analysis
The organic acids were determined using a HPLC method with diode array detector described by Hernández Suárez et al. [15]. 2 mL of the previously obtained solution in the “Sugar analysis” section were passed through a 0.45 µm filter GHP (Waters, Millford, MA, USA) and through a Sep-Pak Accell Plus QMA cartridge (Waters, Millford, MA, USA), which was previously preconditioned with 3 mL of ultrapure water (Milli-Q water system). The compounds were eluted with 2 mL of sodium dihydrogen phosphate 20 mM to pH = 1.
The analytical HPLC system was a Waters 2690 high-performance liquid chromatograph equipped with a Waters 996 photodiode array detector (Water, Milford, MA, USA). The separation was performed using a Waters Atlantis dC18 steel column (150 × 4.6 mm i.d.) with a particle diameter of 3 µm equipped with a Waters Atlantis (20 × 4.6 mm) dC18 guard column. The temperature of the column was set at T = 25˚C during all the experiments. The HPLC pumps, autosampler, column oven, and diode-array system were monitored and controlled using the Millennium32 system. A wavelength of 210 nm was used for the detection of the organic acids.
The mobile phase was composed of sodium dihydrogen phosphate 20 mmol/L to pH = 2.7. The injection volumes were 10 µL for both standards and sample extracts, and a flow rate of 0.7 mL/min was used. Duplicate injections were performed and average peak areas were used for the quantification. The HPLC peaks were identified by comparing the retention times and spectral data obtained from standards.
2.6. Statistics
Statistical analyses were performed by means of the SPSS version 17.0 (SPSS Inc., Chicago, USA). One-Way ANOVA (Duncan’s multiple range) was realized, assuming there were significant differences among them when the statistical comparison gave p < 0.05. Correlation analysis was carried out to know relationships between variables.
3. Results and Discussion
In a previously published paper [16], we studied the influence of peeling methods and storage conditions of the chestnuts on the some physicochemical parameters including ascorbic acid and phenolic compounds. Slight losses of moisture, ascorbic acid and phenolic compounds were observed using the manual peeling comparing with the microwave peeling. Also, a decrease of moisture, ascorbic acid and phenolic compounds in chestnuts stored at refrigeration during 60 days, and after 3 days at refrigeration of samples previously homogenized. Also, Barbosa et al. [17] studied changes of many compounds in different steps (fresh, after storage for 2 months at 0˚C, after industrial steam peeling at Sortegel, and after freezing with liquid air and –20˚C at Sortegel) of the processing. They found significant differences in the contents of phenolic compounds.
Table 2 shows the results relative to moisture, sugars and total phenols of the chestnut varieties analyzed. Moisture content ranged between 496 and 620 g/kg for the varieties Culochico and De pata respectively. Only the De pata variety had moisture content above the range 490 - 600 g/kg, which is considered adequate for conservation of chestnuts. Our values are near the data reported by other investigators [18-22].
Sucrose is the main sugar present in the chestnuts, and it is one of the most important parameters for the assessment of the commercial quality of chestnuts [20]. It represents an intermediate availability form of carbohydrate between starch and the simple monosaccharides such as glucose and fructose [22]. The mean concentration of sucrose was 73.9 ± 20.1 g/kg of dry weight (d.w.) finding important variation between the varieties of chestnuts analyzed, 31.1 and 99.4 g/kg in Picuda and Mollar varieties respectively. Our results were lower than other data found in the literature [3,20,22-25]. This could be explained because our chestnut samples were immediately processed after harvesting. De la Montaña Míguelez et al. [22] reported values around 65.5 and 195 g/kg d.w., although most of chestnuts were in the range 80 - 150 g/kg. In a recent and wide study to assess the quality characteristics of fifteen chestnut varieties from five Mediterranean countries found sucrose contents between 85.3 and 215 g/kg d.w., which were above our data [20]. Only, Senter et al. [4] found similar values of sucrose in European chestnuts to our data, 92.5 g/kg d.w.
As expected glucose and fructose were hardly detected. Senter et al. [4] reported that fructose and glucose were present in trace amounts (<0.10 mg/kg d.w.). However, our data were lower than those reported by other authors [22-25]. De la Montaña Míguelez et al. [22] found glucose and fructose concentrations between 0.0 and 3.1 g/kg d.w. for both monosaccharides respectively. Künsch et al. [2,3] found higher concentrations of fructose (3.7 - 6.9 g/kg d.w.), and similar of glucose (1.0 - 1.2 g/kg d.w.), than the corresponding data reported here. The ratio glucose/fructose was near 1 which suggests they were the result of sucrose hydrolysis [22]. Borges et al. [19] determined reductor sugars using the AOAC method, and they found values between 17.7 and 36.7 g/kg d.w.
Total phenol contents showed a mean value for all the samples of 2.84 ± 0.67 g gallic acid kg−1 d.w. (1.24 ± 0.29 g gallic acid kg−1 fresh weight (f.w.)). The contents of total phenols were compared with other vegetables and fruits cultivated in Tenerife. One can deduce that the
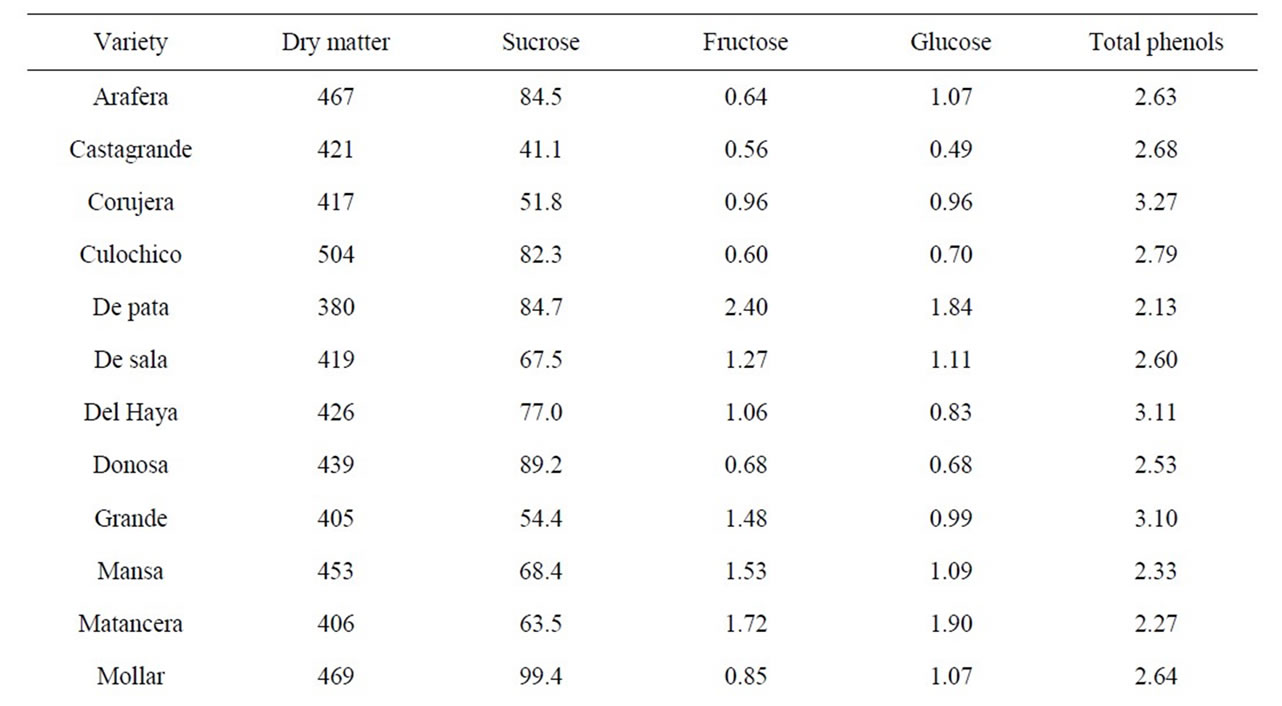

Table 2. Mean concentrations (g/kg d.w.) of dry matter, sugars and total phenols in the chestnut varieties analyzed.
contents of phenolic compounds in chestnut can only be compared with those reported for the specie O. dillenii of prickly pears [26], whose fruits have an intense violet colour. Therefore, the chestnuts are an important source of these antioxidant compounds. There are not recommended dietary intakes of phenolic compounds. However, the American Cancer Society [27] has established 100 mg per day of flavonoids as an adequate amount for the prevention of cancer and degenerative illness. The consumption of one serving of chestnut represents an intake of »124 mg of phenolic compounds, including the flavonoids. The mean contents in the varieties analyzed ranged between 1.96 and 4.31 g/kg d.w. for the De pata and Temprana varieties, respectively. Data of total phenols obtained by us agreed with those indicated by Xu et al. [28] previous transformation of their values, expressed in mg chatequin/100g d.w., to the units that our results are expressed. Besides, our data were slightly higher than those results (1.27 - 2.35 g/kg d.w.) reported by Vekiari et al. [29] which found the highest values in Spanish chestnuts followed by Greek nuts. In other papers [17,25,30,31] the data reported were sensitively lower than the data presented in this paper. This could be explained because those investigators determined only polyphenols using a different method. On the other hand, Barreira et al. [32] determined and compared antioxidant activities in different extracts from chestnut such as: flower, leaf, skin and fruit. They found values of 3.73 g gallic acid kg−1 in the extract of chestnut fruit, and indicated that the polyphenol contents arranged according to the following sequence: outer skins > inner skins > flowers > leaves >>> fruit.
Figure 1 shows a chromatogram corresponding to an eight-component mixture of standards (a) and a chestnut sample (b). One can observe the good resolution and separation of the identified organic acids in a real sample