Effect of Partially De-Oiled Peanut Meal Flour (DPMF) on the Nutritional, Textural, Organoleptic and Physico Chemical Properties of Biscuits ()
1. Introduction
In recent years much research has been devoted to the utilization of oilseed proteins as an edible source of protein for human as well as animal consumption [1]. In most of the countries it has been seen that peanuts are usually processed for oil and the residual meal is used either as animal feed or as fertilizers. Although the meal obtained after oil extraction also possess a rich amount of protein which could be utilized for value addition of various food products. On the other hand most of the developing countries are facing a problem of various forms of protein energy malnutrition [2]. Hence peanuts as a cheap source of protein has aroused recently in traditional foods as well as other foods such as peanut butter etc. [3]. The crude protein content of whole seed peanuts ranges between 22% - 30% [4]. Peanuts have a distinct nutty flavor and desirable texture that places it above all other legumes and oilseeds [5]. Study has shown that, peanut flour which is most commonly used for fortification contains protein ranging in between 47% - 55% i.e. a good amount of protein [6]. Peanuts are used as a rich source of protein in the manufacture of products like cookies [7], breads [8], chapattis [9] etc. Biscuits are prepared from wheat flour with moderate levels of fat and sugar [10]. Biscuit dough is less extensible compared to bread dough as it contains comparatively less water level [11]. Biscuit dough is representative of those complex systems containing low amounts of water [12]. The nature and quantity of ingredients used will determine the quality of the biscuits [13]. Wheat flour, when fortified with other types of flour produces final product with different rheological and baking characteristics [10]. Biscuit is one of the most popular bakery product hence can be used as a source of incorporation of different nutritionally rich ingredients [14] that will also help to fulfill the nutritional need of consumers in a cheaper way. Both bread and biscuits are widely accepted and consumed, but biscuits offer a valuable vehicle as it has several advantages over bread as it can be used in ready to eat form as well as has wide consumption and longer shelf life. The production of biscuit has recorded six fold increase in quarter of century [15,16].
However, not much research has been conducted on the fortification of wheat flour with de-oiled peanut meal flour for biscuits and therefore present investigation was undertaken to study the effect of fortification with 5%, 10%, 15% and 20% DPMF on nutritional, textural, organoleptic and physico-chemical properties of biscuits.
2. Materials and Methods
Biscuits were prepared by incorporating partially deoiled peanut meal flour, wheat flour and other ingredients like sugar, shortening, etc. (Table 1). DPMF was prepared from peanuts that were procured from local market of Ludhiana, Punjab, India. Peanut flour replaced the wheat flour to the extent of 5%, 10%, 15% and 20% levels without altering the total flour content of the preparation. The chemical composition of DPMF was assessed for moisture, protein, carbohydrates, fat and ash content. De-oiled flour was obtained from pressed cake after oil extraction was dried at 60˚C for 4 - 6 hours to remove moisture content and to enhance the grinding of meal. The meal was then ground into flour in pulverizer. Biscuits were prepared with DPMF (5%, 10%, 15% and 20%) and were finally assessed for its, sensory, chemical and textural characteristics were evaluated. The method of biscuits preparation is figured in Figure 1.
2.1. Chemical Analysis
The Chemical parameters such as moisture content, carbohydrate, protein fat and ash content were determined using method as per standard AOAC method [17] for both DPMF and its fortified biscuits.
2.2. Physical Property
The diameter of biscuits was measured using vernier calipers and height was determined by stacking six biscuits one above the other and taking the average. Spread ratio was calculated by dividing the average value of width to thickness of biscuits according to AACC method [18].
2.3. Texture Analysis
Hardness and breaking strength of biscuits were measured by using texture analyzer (TA-HDi, Stable Microsystems, UK). P/75 cylindrical probe was used to penetrate the centers of the biscuits at 2 mm/s. Biscuits from

Table 1. Proportions of various ingredients used in biscuits preparation.
each composition of sample were used for texture measurements, and there were a total of 3 measurements for each composition per experiment. Graph was recorded in terms of force versus time. Maximum force was recorded using the Texture Expert software. Similarly, breaking strength was measured using HDP/BSK probe.
2.4. Colour Measurement of Biscuits
The difference in colour of the biscuits was measured by Hunter colorimeter D-65 illuminant and 10˚ observer (Mini Scan XE Plus, Model 45/0S, Hunter Associates Laboratory Inc, USA). First the colorimeter was calibrated using the standard white and black tiles. Samples were taken and pressed one by one against instrument (sample) port, making sure that it is completely covered by the area to be measured. Four readings for each variation of sample were taken. Measurement was made at the four points on biscuits. The results were expressed as a mean value of all the samples.
2.5. Sensory Evaluation of Biscuits
Sensory characteristics of biscuits were evaluated for different sensory attributes by a group of panelists. Sensory attributes like appearance, texture, odor, flavour and overall acceptability for all samples were assessed using nine point hedonic scales. Hedonic scale was in the following sequence: like extremely—9, like very much— 8, like moderately—7, like slightly—6, neither like nor dislike—5, dislike slightly—4, dislike moderately—3, dislike very much—2, dislike extremely—1 [19].
2.6. Statistical Analysis
Statistical analysis was performed with SPSS software (SPSS Inc., 1996) and used to test the significant effect of various parameters at 5% level of significance (P > 0.05).
3. Results and Discussion
3.1. Chemical Analysis
Chemical composition of DPMF is given in Figure 2 and for biscuits results are summarized in Table 2. Peanuts are a rich source of protein thus, after extraction of oil a good amount of protein and ash was obtained in its flour. From the result, it is evident that there was decrease in carbohydrates level while increase in ash, moisture content, crude fat and protein level for DPMF fortified biscuits. There was a change in moisture content from 2.32% to 4.22%, ash from 1.55% to 2.22%, crude fat from 12.37% to 14.75%, protein from 5.52% to 9.88% and carbohydrates from 76% to 70.34%. The increase in moisture content can be attributed to the increased protein content that also increases the water binding capacity of dough with higher levels of DPMF. Tyagi et al. [16] also reported that with the addition of mustard flour moisture content of biscuits increased slightly. Kumar et al. [20] observed similar increase in moisture content with increasing levels of millet flour. Thus it can be concluded that fortification had a positive effect on overall chemical quality of biscuits since proteins and ash increased significantly as shown by the statistical analysis.
3.2. Effect of DPMF Level on Biscuit Physical Properties
An increase in diameter and height was observed after baking (data tabulated in Table 3). The diameter after baking increased from 47.07 to 51.29 whereas height decreased from 8.28 to 7.22. The increase in diameter was significantly different from control as the percentage fortification increased. There was a reduction in thickness as the level of DPMF increased which may be contributed to enhanced hydration capacity of flour after fortification. While the increase in diameter can also be attributed to the fat content since DPMF also has a certain amount of fat that contributes to the total fat content of biscuits. As the fat increases an increase in expansion of biscuits was observed that further led to decrease in thickness.
The spread ratio increased after baking as given in Table 3. Various researchers have reported that with an increase in pentosans and protein level the spread ratio declines as it enhances the flour hydration capacity [21-24]. Similar declining trend after baking, for spread ratio was observed and the possible reason reported was that it could be due to competition for water between pigeon pea flour and wheat flour for dough consistency [25]. Mc Walters [6] reported that when there is increased number of hydrophilic sites available for competing for the limited free water in biscuits leads to reduction in spread ratio. Singh et al. [26] also observed reduced spread ratio when substituted with De-oiled soy flour. Hence, it can be concluded that since DPMF is rich

Table 2. Chemical composition of biscuits at different percentage of DPMF.

Table 3. Effect of different DPMF levels on physical properties of biscuits.
in protein content thus all the above reasons as given by other researchers leads to reduction in spread ratio.
3.3. Influence of DPMF Level on Texture of Biscuits
The two important properties that need to be considered for biscuits are hardness and its breaking strength. The results are summarized in Table 4. The average peak force is the measure of biscuit hardness and the area from origin to absolute positive is the breaking strength. A declining trend was observed for both the breaking strength and hardness with increase in level of DPMF. The hardness values were ranging from 11.07 to 7.44 N, similarly breaking strength was from 50.42 to 23.56 N-mm. Stickiness of dough is important for sheeting of dough [14]. With an increase in DPMF, stickiness increased for dough. Since DPMF has both high water absorbing capacity as well as there was a significant level of fat (around 10%) found in DPMF hence both these factors contributed in a sticky dough thus reducing extensibility of dough. The extensible and cohesive structure is contributed by sugar or water interaction with wheat protein thus forming gluten but with an increase in fat content the flour gets coated and this network gets interrupted thus properties of biscuits are changed and a less harder. At very high fat content the lubricating function is high thus less water is required and a softer texture is obtained. Hence the hardness and breaking strength gradually decreased forming a softer biscuits with an increased level of DPMF. This shows that incorporation of DPMF had positive results on textural properties.
3.4. Influence of DPMF on Colour Values of Biscuits
The results obtained are shown in Figure 3. There was a decrease in L values from 56.80 to 50.58 while an increasing trend was seen for a and b values. Srivastava et al. [10] concluded that decreasing L and increasing a and

Table 4. Textural characteristics of biscuits containing DPMF.
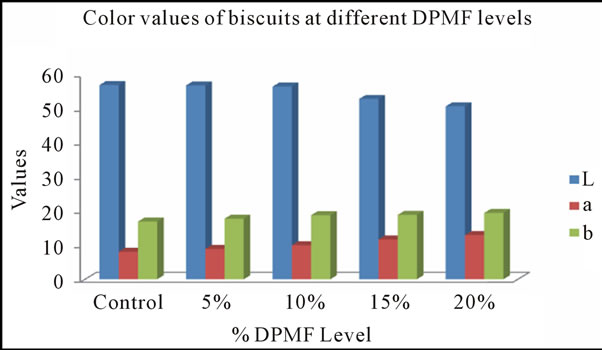
Figure 3. Color values of biscuits at different DPMF level. *L = Lightness, a = redness to greenness and b = yellowness to blueness.
b values lead to darkening of biscuits when they supplemented Virgin coconut meal in biscuits. Decline in L values signifies that with increase in percentage incorporation the lightness decreased while a and b values shows an increase in redness and yellowness in biscuits. Similar trend was observed by Singh et al. and Srivastava et al. [14,24] where the former incorporated corn and potato flour while later incorporated virgin coconut meal in biscuits. Thus the observed results for DPMF fortified biscuits followed a similar trend. The colour development is contributed by the maillard reaction i.e. reaction between sugars and proteins of product that results in brown colour [27]. Other factors that may be responsible for colour development are time & temperature of baking, composition, humidity in oven etc. [28,29]. It was reported that with an increase in protein content there is a decrease in L value [30,31]. In the biscuits not a significant difference was observed for all L, a and b values.
3.5. Influence of Increasing DPMF Level on Sensory Parameters
The effect of increasing DPMF levels on sensory parameters of biscuits were depicted in Table 5. The statistical analysis showed that there was not much significant difference in all the parameters even after substitution of DPMF (up to 20%) compared to control. For all the parameters, the scores given by panelists were found in the range of 8.8 to 7.5, which is quite an acceptable range. The typical peanut flavour and aroma was highly acceptable by the panel members. There was not a significant difference up to 15% from control while at 20% scores were significantly different from other samples. Nasir et al. (2008) [32] reported that cookies made from De-oiled maize flour were acceptable up to 15% by the consumers. Arshad et al. [33], made cookies with 15% supplementation of De-oiled wheat germ flour in wheat flour showed sensory scores in the acceptable range. In all parameters there was not much difference between the control and other samples rather the texture and flavour both were acceptable by the panelist (Figure 4).
4. Conclusion
The addition of DPMF resulted in significant improvement in protein content in wheat flour-DPMF blends. From the above investigation it can be concluded that although biscuits incorporated with 20% replacement of DPMF were nutritionally rich but received lower score for different sensory attributes. The textural properties showed that hardness and breaking strength decreased while stickiness of dough increased. Incorporation of DPMF had a significant effect on color values, lightness decreased while a and b values increased producing a darker color with higher levels of DPMF. Thus, biscuits

Table 5. Graph showing sensory properties of biscuits at different DPMF levels.

Figure 4. Biscuits with different level of DPMF.
were acceptable for all the attributes evaluated upto 15% while higher levels had a negative effect. The study demonstrated that DPMF a byproduct obtained from peanut oil industry offers a great potential for supplementing prote.