A Stability Indicating Reverse Phase-HPLC Method Development and Validation for the Estimation of Rucaparib in Bulk and Pharmaceutical Dosage Form ()
1. Introduction
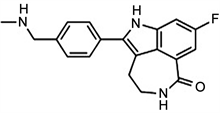
Rucaparib chemically, 8-fluoro-2-{4-[(methylamino) methyl] phenyl}-1,3,4,5-tetrahydro-6H-azepino[5,4,3-cd] indol-6-one is a small molecule inhibitor of Poly ADP-Ribose Polymerase (PARP) which is used for treating patients with refractory and advanced carcinoma. It is the best targeting first-in-class drug on PARP 1, 2 and 3 DNA repair enzyme. Upon administration, it selectively binds to PARP-1,2 and 3 receptors for inhibiting the DNA repairing mechanism by PARP enzyme. Thus, it leads to breaking of DNA strands, causes genomic instability, arrest cell cycle and finally apoptosis [1].
The complete information with data supplemented from the literature that there are only few methods like LC-MS/MS [2] [3] [4] [5] techniques which are very expensive but there was no simple method developed till date for the analysis of Rucaparib drug. Hence, it felt necessary to establish a new, easier, cost effective, precise, accurate and specific stability indicating analytical method which can be easily applicable for routine drug performance evaluations.
2. Materials and Methods
2.1. Materials
The investigated sample Rucaparib [Maxheal Pharmaceutical Pvt. Ltd.] was procured from local market, Hyderabad. The standard Rucaparib drug was procured from Sanzyme Ltd. Acetonitrile [Merck], Methanol [Merck], Triethylamine [Merck], Water [Merck], Potassium dihydrogen phosphate were of HPLC grade.
2.2. Equipment
Waters HPLC system equipped with 996 photo diode array detector was used for quantitation of Rucaparib. The processing with complete data obtained from Empower 2 software. The samples solubility in mobile phase was enhanced using Sonicator (SE60US model) Labman company. All the samples prepared were filtered using Vacuum filtration kit made by Labman.
3. Methodology
3.1. Chromatographic Conditions
The reverse-phase chromatography was performed on Waters HPLC using 996 photo diode array detection. The separation was done by using symmetry C18 ODS (25 cm × 0.46 cm internal diameter) 5 µm analytical column containing Phosphate buffer (0.02 M) and Methanol [65:35% v/v] mobile phase, adjusted the pH to 4.8 by dilute ortho phosphoric acid solution. The method was run at 1 ml∙min−1 at 286 nm UV detection. The elution time for Rucaparib drug was at 5.484 min.
3.2. Preparation of Rucaparib Stock and Working Stock Solutions
Accurately weighed 10 mg of Rucaparib standard drug was taken into 10 ml volumetric flask, diluted to volume and mixed thoroughly by ultrasonication in order to enhance solubility and to degas the solutions. From the stock solution 0.1 ml was pipetted into 10 ml volumetric flask, diluted to volume mixed thoroughly, treated with 0.45 µl filter paper and finally sonicated for 15 min. The prepared solution was introduced into the flow stream of mobile phase and recorded chromatograms. After so many experimental trials, the successful separation was achieved. Noted the optimized conditions and proceeded for validation as per ICH guidelines.
3.3. Preparation of Sample Solution
Twenty tablets of Rubraca (300 mg) were made into fine powder using mortar and pestle. From this, an amount equivalent to 10 mg was taken into clean dry volumetric flask [10 ml], diluted to volume, treated with 0.45 µl filter paper and sonicated for 15 min. From this, further pipetted out 0.1 ml solution, diluted to volume and mixed thoroughly. Injected the standard and sample solutions in triplicates and the % assay was calculated.
4. Method Validation
As per ICH guidelines [6] [7] the checked validation parameters were accuracy, precision, linearity, LOD, LOQ, robustness and specificity [8].
4.1. System Suitability
For evaluating the suitability of HPLC system and procedure, the Rucaparib standard solution of 10 µg ml−1 concentration of about 20 µl was introduced into the HPLC system and recorded the chromatogram.
4.2. Accuracy
In order to determine the method’s accuracy, the drug was spiked at 50%, 100% and 150% levels. The chromatograms were recorded and noted the peak areas. From this, the average recovery of analyte was calculated.
4.3. Precision
Intra-day assay and intermediate precision were evaluated to determine method’s precision.
4.3.1. Intra-Day Assay Precision
To evaluate the intra-day precision, 10 µg/ml concentration solution was injected for five times under unchanged conditions within a short period of time. The peak areas for the five replicate injections were collected and calculated the % Relative standard deviation.
4.3.2. Intermediate Precision
To evaluate the Intermediate precision, the sample was analyzed on different days under unchanged conditions. Collected the peak areas and calculated the % Relative standard deviation.
4.4. Linearity
The linearity was evaluated by injecting over the range of 6 - 14 µg/ml concentration solutions of Rucaparib. A calibration curve was plotted between analyte concentration and analyte response. Performed regression analysis using least square method and calculated the correlation coefficient (r).
4.5. Robustness
Robustness was evaluated by slightly changing the chromatographic conditions which includes percent organic solvent and flow rate.
4.5.1. Effect of Slight Change in Flow Rate
The Rucaparib solution was analysed at 0.9 ml∙min−1 and 1.1 ml∙min−1 rather than optimized flow rate of 1.0 ml∙min−1. Chromatograms were collected to compare with optimized chromatographic conditions.
4.5.2. Effect of Slight Changes in Percent Organic Solvent
The Rucaparib solution was analysed by slightly varying the percent organic solvent i.e., Phosphate buffer and Methanol as 60:40 and 70:30 ratios rather than 65:35 v/v. Chromatograms were collected to compare with optimized chromatographic conditions.
4.6. Limit of Detection
The formula used to determine the lowest amount of analyte was,
LOD = 3.3 × standard deviation of response/slope of the calibration curve
4.7. Limit of Quantitation
The formula used to calculate the quantitation limit was,
LOQ = 10 × standard deviation of response/slope of the calibration curve.
5. Forced Degradation Studies
The stress testing was carried out to generate samples for establishing the stability indicating assay method by treating the Rucaparib solution to extreme conditions such as acidic, basic, peroxide, thermal, ultraviolet and water degradation. Chromatograms were recorded and purity of the peak was determined by calculating the % of degraded amount and % of active amount.
5.1. Acid Degradation
Taken 1ml of Rucaparib stock solution and 1 ml of 2 N HCl, refluxed for 30 min at 60˚C. Later it was neutralized with 1 ml 2 N NaOH and made up to final volume to obtain 10 µg∙ml−1 solution. Cooled to the room temperature and treated with 0.45 µl membrane filter. 20 µl sample was introduced into the HPLC system and recorded the chromatogram.
5.2. Basic Degradation
Taken 1 ml of Rucaparib stock solution and 1 ml of 2 N Sodium hydroxide, refluxed for 30 min at 60˚C. Later it was neutralized with 1 ml 2 N HCl and made up to the final volume to obtain 10 µg∙ml−1 solution. Cooled to the room temperature and treated with 0.45 µm membrane filter. 20 µl sample was introduced into system, and recorded the chromatogram.
5.3. Oxidative Degradation
Taken 1 ml of Rucaparib stock solution and 1 ml of 20% hydrogen peroxide (H2O2) and left for 30 min at 60˚C. Later the solution was made up to the final volume to get 10 µg∙ml−1 solution. Cooled to room temperature, treated with 0.45 µm membrane filter. Finally, 20 µl sample was introduced into the HPLC system, and recorded the chromatogram.
5.4. Thermal Degradation
Kept 1 ml of Rucaparib stock solution in an oven at 60˚C for 6 hrs and made up to final volume to get 10 µg∙ml−1concentration. Cooled to room temperature and treated with 0.45 µm member filter. Later, 20 µl sample solution was introduced into the HPLC system and recorded the chromatogram.
5.5. Photo Degradation
1 ml of stock solution of Rucaparib was exposed to Ultra-violet light for 1 day and made up to final volume to get 10 µg∙ml−1 concentration and treated with 0.45 µm membrane filter. Later 20 µl sample solution was introduced into the HPLC system and recorded the chromatogram.
6. Results and Discussions
6.1. Method Development
For this method development, various ratios and combination of mobile phases, different stationary phases and flow rates were tried to elute the drug with good peak parameters and to provide good performance in assay. Finally, the best separation was achieved on symmetry C18 ODS column (250 mm × 4.6 mm id, 5 µm) comprising mobile phase of phosphate buffer (0.02M): Methanol [65:35% v/v], adjusted the pH to 4.8 by dilute ortho phosphoric acid. The method was run at a flow rate of 1.0 ml∙min−1 and the eluent was detected at 5.484 min by UV detector at 286 nm. The chromatogram showed the peak with good shape, more theoretical plates and the tailing factor was also found to be within the limits. All the method development trials with various mobile phase compositions, columns and flow rates results were shown in Table 1. The standard chromatogram of rucaparib drug was presented in Figure 1.
6.2. Analytical Method Validation
6.2.1. System Suitability
The theoretical plate number, peak asymmetry and percentage relative standard deviation obtained are within the acceptance criteria and demonstrated that the method can generate the accurate and precise results. The results were presented in Table 2.
![]()
Figure 1. Optimized chromatogram (standard) of Rucaparib.
![]()
Table 1. Method development trials and observation.
6.2.2. Accuracy
It was found that the average recovery at 50%, 100%, and 150% were found to be within the limits which indicated the methods Accuracy. The measured results were provided in Table 3.
6.2.3. Precision
The % RSD obtained was within the limits indicating the methods precision. Tables 4-6 depicts the results of intraday precision and intermediate precision respectively.
6.2.4. Linearity
The method exhibited linearity in the range of 6 to 14 µg∙ml−1. The obtained data was statistically analysed and results were presented in Table 7 and the calibration curve was depicted in Figure 2.
6.2.5. Robustness
Upon slight changes in the flow rate and percent organic solvent, the results confirmed the reliability of the method. Results were presented in Table 8.
6.2.6. Limit of Detection (LOD) and Limit of Quantitation (LOQ)
The calculated LOD and LOQ values of rucaparib are 0.49 µg∙ml−1 and 1.486 µg∙ml−1 respectively.
6.2.7. Assay Determination of Rucaparib
The % purity of Rucaparib present in the marketed formulation was found to be 99.328%. The assay results of standard and marketed formulation of rucaparib were shown in Table 9 and Table 10 respectively.
6.2.8. Forced Degradation Studies
The forced degradation results showed that the rucaparib drug was found to be liable to acid and degraded to about 17.24%. In basic degradation, it was found to be degraded to about 16.18%. Upon oxidation, it was degraded to about 14.06% and in thermal degradation to about 13.59%. Very less degradation was observed in photolytic degradation to about 5.38%. According to FDA guidance, for the validation of any chromatographic assay 5% to 20% of degradation is acceptable. Therefore, in the present method the % degraded amount is within the specified limits and moreover, the successful separation of active pharmaceutical product from degradation products without any interference proved the stability indicating nature. The obtained chromatograms during stress testing were depicted in Figures 3-7. The measured values are provided in Table 11.
![]()
Figure 2. Calibration curve of Rucaparib.
![]()
Figure 3. Acid degradation chromatogram of Rucaparib.
![]()
Figure 4. Basic degradation chromatogram of Rucaparib.
![]()
Figure 5. Oxidative degradation chromatogram of Rucaparib.
![]()
Figure 6. Thermal degradation chromatogram of Rucaparib.
![]()
Table 4. Intra-day precision data of Rucaparib.
![]()
Figure 7. Photolytic degradation chromatogram of Rucaparib.
![]()
Table 5. Day 1 Intermediate precision data of Rucaparib.
![]()
Table 6. Day 2 Intermediate precision data of Rucaparib.
![]()
Table 7. Linearity data of Rucaparib.
![]()
Table 8. Robustness data of Rucaparib.
![]()
Table 9. Assay data of standard rucaparib drug.
![]()
Table 10. Assay data of marketed formulation.
![]()
Table 11. Forced degradation studies data for Rucaparib.
7. Conclusion
The present established stability indicating Reverse phased High-performance liquid chromatographic method is new, fast and easier to quantify the Rucaparib drug with precise and accurate results. The successful separation of all the degradation products from the active pharmaceutical ingredient proved the specificity and the stability indicating nature of the developed method. In comparison to the reported method for the identification and quantification of degraded impurities by HPLC and characterization by LC-MS technique, where the Rucaparib showed the retention time at 11.9 min and the detection limit was 11 µg/ml, the present developed method requires lesser analysis time and more sensitive, showing the retention time of 5.484 min and detection limit of 0.49 µg/ml. Thus, the shorter duration of analysis time, more sensitivity and cost effectiveness revealed that it is suitably applied for routine laboratory use.