1. Introduction
In the mechanistic-empirical (M-E) design/analysis of multi-layer flexible pavement structures, the resilient response of layer materials to repeated traffic loading is quantified by the resilient modulus (MR) parameter. MR as a material stiffness parameter was initially introduced by Seed et al. [1] to measure the elastic modulus of a material at a given stress state. In pavement engineering, the parameter measures the elastic property of a layer material with consideration to the material’s non-linear characteristics. MR values may be determined directly in the laboratory through repeated load triaxial testing and indirectly through correlation with empirical soil strength parameters (California Bearing Ratio, Soil Support Value, and Resistance Value) or by back-calculating from deflections measured with falling weight deflectometer. But because MR is a basic mechanistic material property, its estimation through correlations with empirical soil strength parameters is not considered appropriate as the parameters do not reflect the conditions in a pavement under repeated traffic loading [2] .
In empirical pavement design approaches, representative resilient modulus values are assigned to layer materials irrespective of position in the pavement-subgrade system. This is considered a limitation since the resilient modulus of unbound soil/aggregate layers depends on stress state and is known to increase with increasing bulk stress and confining stress [3] . Layer materials, depending on their position in the pavement-subgrade system, come under different vertical stresses from the overburden and traffic loading as well as horizontal stresses from confinement.
Figure 1 shows the state of stress in a triaxial loading and the response of the loaded material under repeated loading conditions [4] . Based on the stress conditions defined in the figure, the resilient modulus is defined as;
(1)
where,
MR = resilient modulus;
σd = repeated deviator stress (σ1 − σ3);
εr = recoverable axial strain
The basic definition of MR given by Equation (1) has formed the basis of several constitutive model proposals for determining resilient modulus including those of Dunlap [5] , Moossazadeh and Witczak [6] , Uzan [7] , Witczak and Uzan [8] , and the generalized model [9] given by Equation (2).
(2)
where,
(octahedral stress)
Pa = atmospheric pressure
σ1 = major principal stress
σ2 = intermediate principal stress (=σ3 in triaxial test)
σ3 = minor principal stress (confining pressure in triaxial test)
θ = bulk stress (σ1 + σ2 + σ3)
k1, k2 and k3 = constants (k-values) related to material’s physical state
The limitation inherent in empirical designs due to failure to relate MR to the stress state of layer materials is addressed in the Mechanistic-Empirical Pavement Design Guide (MEPDG) [9] which computes resilient modulus using Equation (2). As is clear in the model, MR is defined by the state of stress of the layer materials in the pavement-subgrade system and the physical state of the materials through the material constants (k1, k2, k3) known as k-values. For Level 1 analysis which has the highest design reliability in the Guide [9] , it is recommended to determine the k-values from laboratory resilient modulus test conducted under repeated loading conditions to simulate traffic loading, while for Level 2 analysis, which is of intermediate reliability, MR may be estimated through correlations with index soil properties [10] or possibly from agency database [11] .
Unlike MR, the k-values are dependent only on the physical state of the material without any stress influence. The constant k1 which can only be positive is related to material strength and tends to be higher for materials containing angular particles and less fines than those containing higher fines and rounded particles [10] ; k2 should be positive as increasing bulk stress causes stiffening effect on the material and, hence, increasing modulus while k3 should be negative since increasing shear stress produces a softening effect on the material resulting in lower MR [12] [13] . A number of researchers, including [14] [15] [16] , have correlated k-values of local soils with different soil physical properties including, but not limited to, the following: dry density, moisture content, liquid limit, plastic limit, % clay and % gravel. Such correlations help evaluate the k-values associated with the physical state of layer materials, which in turn make it possible for the resilient modulus of the layers under any stress state to be estimated using the generalized constitutive model. While literature may be replete with some such correlations for local soils, it is important to note that they are locality-specific and do not have universal application due to the variability in the geology and mineralogy of the rock masses from which soils are derived.
For fine-grained soils, the resilient modulus decreases with increase in deviator stress at a given confining stress in a behaviour known as stress-softening whereas for granular soils, the parameter increases with increase in deviator stress (stress-hardening behaviour) [3] . Other factors which affect MR include moisture which lowers MR when it is above the optimum content [17] , particle shape which results in higher MR when it is angular to sub-angular but lower values when rounded to sub-rounded [18] [19] [20] and soil suction in the case of fine-grained subgrade soils [21] .
The MEPDG approach to flexible pavement design has a lot of calibration protocols and performance predictions which require local input data for traffic, climate, subgrade and material properties [22] . For the most part, natural gravels have been the predominant layer materials used in Ghana for the construction of sub-base and base layers, particularly, of low- and medium-volume flexible pavements because the materials can generally be found within economic haul distance of most constructions and are relatively low in cost compared to crushed rock. Therefore, to properly implement and evaluate the benefits of the M-Edesign of flexible pavements involving such materials, the generalized resilient modulus model must be calibrated using data on local soils/gravels. Laboratory MR tests become important in the calibration process as they generate the set of data required for the determination of the k-values associated with the compacted layer materials/soils. This study forms part of preliminary efforts to establish representative k-values for natural gravels used in the country for flexible pavement construction.
2. Pavement-Grade Natural Gravels in Ghana
The Ministry of Roads and Highway’s Standard Specification for Road and Bridge Works [23] uses the term “natural gravel” to include lateritic gravel, quartzitic gravel, calcareous gravel, soft stone, conglomerate, sand or clayey sand or a combination of any of the above materials. However, invariably, most natural gravels in Ghana are usually a mixture of quartz and laterite particles in a matrix of fines [24] . Gravels containing over 50% of quartz fractions are termed quartzitic and those with over 50% laterite particles are termed lateritic. A peculiar characteristics of lateritic gravels is their reddish-brown to ochre colour, presence of concretionary particles high in iron and silica, high clay content and high plasticity [24] .
In terms of suitability as flexible pavement layer materials, natural gravels are classified into grades as G30 (CBR ≥ 30); G40 (CBR ≥ 40); G60 (CBR ≥ 60); and G80 (CBR ≥ 80) using CBR, particle gradation, Grading Modulus, Atterberg Limits, Plasticity Modulus, and 10% Fines Value. Whereas G30 and G40 grades are used for sub-base, G60 and G80 are used for base construction [23] .
3. Materials and Methods
3.1. Natural Gravels for Study
Natural gravels used for road construction are mainly of two types, lateritic and quartzitic; this study focused only on the latter. The samples were collected from gravel pits distributed in five regions in the country (Figure 2). Sampling locations and sample identification are detailed in Table 1.
3.2. Laboratory Tests
3.2.1. Index Property Test
Grain size analysis was conducted on each of the gravel samples in accordance with Ghana Highway Authority (GHA) S7 Standard Method [25] whilst compaction was carried out in accordance with GHA Standard S1: Test Method for the Determination of Maximum Dry Density and Optimum Moisture Content of Soils and Soil-Aggregate Mixtures [25] . Atterberg Limits tests were carried out in accordance with ASTM D4318-10 [26] on the fines fraction (below 0.425 mm) of the primary samples.
3.2.2. Repeated Load Triaxial Test
The MR test was conducted using the Industrial Process Controls’ Universal Materials Testing Apparatus (Plate 1) equipped with a desktop computer, environmental chamber enclosing the load cell and the triaxial chamber, control and data acquisition system, air compressor, and air dryer. Gravel materials passing the 19 mm sieve were used for specimen preparation and compacted in a 100 mm
![]()
Figure 2. Map of Ghana showing locations of gravel materials used for study.
![]()
Table 1. Locations and identification of natural quartzitic gravels used for study.
diameter × 200 mm high mould to the maximum dry density and optimum moisture content from the compaction characteristics of the soil. After the compaction, the specimens were removed from the mould and covered with rubber membrane for the resilient modulus test. Three specimens were prepared for each soil sample and tested for Resilient Modulus in accordance with AASHTO T307-99 test protocol [27] .
3.3. Determination of k-Values of Gravel Materials
Equation (2) which relates MR to the stress state and physical state of the layer material in the repeated load triaxial test was modified to the following form;
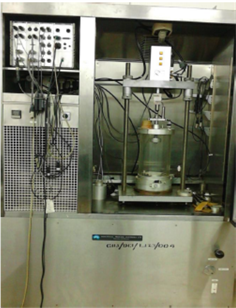
Plate 1. Resilient modulus test set-up.
(3)
Under laboratory triaxial loading conditions, τoct reduces to
.
The logarithmic-transformed MR values obtained from the repeated load triaxial test were regressed on the logarithmic-transformed test stresses to obtain the k-values in Equation (3). Correlation relationships between the k-values and the physical properties of the gravels were then developed using multiple linear regression technique. Based on review of literature [13] [14] [15] , and for proper material and physical state representation of the compacted gravels, the index properties selected as the independent variables for the correlation relationships were the percentages of materials passing the 9.5 mm (P9.5) and 2.0 mm (P2.0) sieves, the liquid limit (LL), the maximum dry density (ρdmax) and the optimum moisture content (wopt).
4. Results and Discussion
4.1. Index Properties of Gravels
The natural gravels investigated were quartzitic in nature with colour ranging from light brown to yellowish brown. Visual inspection of the coarse fractions of the gravels from Ntereso (NNR), Suhum (SER), and Ekumadze (CER)revealed sub-angular particles with rough texture whereas fractions of the samples from Sankunyilli (SNR), Ofoase (OAR), Anyanso (AAR), and Mobole (MGR) were rounded in shape and smooth textured, suggesting some degree of transportation in the geologic past. The index geotechnical properties of the samples are summarised in Table 2. Because the fines portions of all the samples plotted
![]()
Table 2. Index properties of natural gravels used for study.
above the A-Line on the Cassagrande plasticity chart, the fines were predominantly clay in content. Based on AASHTO Classification, all the samples classified as A-2-4(0) and were essentially clayey sandy gravel except that from Anyanso (AAR) which was a sandy clayey gravel. Figure 3 shows the particle size distribution curves of the gravel materials superimposed on the grading envelope for G80 and G60 base-grade gravel materials [23] .
On the basis of particle gradation in terms of MRH Standards [23] , almost all the gravel materials appeared to meet the requirements for G80 gravel but failed one or more other G80 requirements such as Grading Modulus, Atterberg Limits and Plasticity Modulus and hence were all clearly G60 base materials except gravel material MGR which was of G80 grade. However, according to the AASHTO T307-99 resilient modulus test protocol [27] , all the materials classified as Type 1 unbound natural gravel since the proportions passing the 2 mm and 0.075 mm sieves were less than 70% and 20%, respectively, with plasticity indices being less than 10%.
The compaction characteristics of the gravels showed maximum dry densities ranging between 2038 kg/m3 and 2305 kg/m3 with an average of 2206 kg/m3. Most samples had optimum water contents ranging between 4% and 6% with an average of 4.9%; only two samples (AAR and SER) had optimum water contents about twice the average of those of the rest of the samples. Perhaps the higher than average silt-clay contents of the two samples could partly be the reason for the relatively high optimum water contents although sight is not lost of the fact that Sample SNR with similar percentage of silt-clay content, but substantially
![]()
Figure 3. Particle size distribution of quartzitic gravel samples.
lower gravel fraction, belonged to the low optimum water content sample cohort.
4.2. Resilient Modulus of Study Material
Resilient modulus test results in the repeated load triaxial tests have been summarized in Table 3. As shown in Figure 4, the modulus increased with confining pressure because for granular soils, confinement is known to increase interlock between the individual aggregate particles within the compacted matrix, a behaviour referred to in literature as stress-hardening.
As expected, most of the granular materials exhibited increasing modulus with increasing bulk stress for a given confining stress (typified by Figures 5-7 for samples NNR, OAR, and SNR, respectively). The only exception to this stress-hardening behaviour was the gravel from Anyanso (Sample AAR) which exhibited both stress hardening and stress softening characteristics (Figure 8).
In the case of variation of MR with octahedral shear stress, contrary to what is touted in literature, six out of the seven gravel samples exhibited increasing modulus with increasing octahedral shear stress at a given confining stress (typified by Figure 9 and Figure 10 for samples NNR and MGR, respectively); the only exception again being Sample AAR which generally exhibited little change in modulus initially then decreasing values with further increase in shear stress (Figure 11).
4.3. k-Values for Gravels
Table 4 presents the summary of the k-values derived from the regression analysis of the resilient modulus values for the gravel samples. As seen in the table, k1 values ranged between 441 and 958 with a mean of 516; k2 varied between 0.0636 and 0.2168 with a mean value of 0.1216 while k3, which is related to the octahedral shear stress, ranged between 0.1257 and 3.1590 with a mean value of 1.723.
![]()
Table 3. Summary of test results in repeated load triaxial tests on gravel materials.
![]()
Figure 4. Laboratory MR for gravel samples at different confining pressures.
![]()
Figure 5. Laboratory MR for gravel sample NNR at different confining and bulk stresses.
![]()
Figure 6. Laboratory MR for gravel sample OAR at different confining and bulk stresses.
![]()
Figure 7. Laboratory MR for gravel sample SNR at different confining and bulk stresses.
![]()
Figure 8. Laboratory MR for gravel sample AAR at different confining and bulk stresses.
![]()
Figure 9. Laboratory MR for gravel sample NNR at different confining and shear stresses.
![]()
Figure 10. Laboratory MR for gravel sample MGR at different confining and shear stresses.
![]()
Figure 11. Laboratory MR for gravel sample AAR at different confining and shear stresses.
![]()
Table 4. Average k-values of quartzitic gravels.
Contrary to what have been reported in literature, the regression analysis returned positive k3 values instead of negative values for six out of the seven samples. The resilience response of a material to increase in octahedral shear stress determines the positivity or negativity of its k3 value. As increasing shear stress is expected to lead to the softening of materials, and hence a decreasing resilient modulus, k3 should be negative, but this phenomenon was not exhibited by the quartzitic gravels as they showed stress-hardening behaviour with increase in octahedral shear stress (see for example Figure 9 and Figure 10). The only exception to this behaviour was sample AAR from Anyanso which initially hardened at low shear stress levels but then softened at increased shear stress levels (Figure 11). It is not exactly clear what accounted for this unexpected behaviour but the coefficient of multiple determination (R2) associated with the regressions analysis exceeded 0.90 for the investigated materials except for the sample from Anyanso (AAR) for which the value was a low 0.56 (see Table 4).
The MEPDG recommends that test results and equipment should be checked for possible errors and/or test specimen disruption if R2 for a particular test specimen is less than 0.90 [9] . Because this condition did not prevail for practically all the soils except one, it is difficult to ascribe the sample behaviour under increasing shear stress to test/equipment error. And what was even more surprising is the fact that the sample which probably could be associated with test error because of a low R2 value was rather the gravel sample for which the analysis returned negative k3 value in accordance with expectation based on literature. For the other samples, the higher R2 values from the regression analysis, therefore, appeared to rule out any test errors during the triaxial test in spite of their k3 values being positive.
Given the stress state in the repeated load triaxial test for which the intermediate principal stress (σ2) is equal to the minor principal stress or confining pressure (σ3), the generalized MR constitutive model (Equation (2)) may be re-written solely as a function of deviator stress (σd) and confining pressure as follows:
(4)
It is reported that for granular materials, the resilient modulus increases with increasing confining pressure [28] and deviator stress [3] [29] . On the strength of those observations, and with reference to Equation (3), two possibilities could exist regarding the nature of the k3 parameter: 1) if k3 were to be positive, the observations above per references [3] [28] [29] would still hold but perhaps up to some stress thresholds as stress-hardening could not be perpetuated ad infinitum with increasing deviator stress and confining pressure; 2) if k3 were to be negative, the observation would also hold if and only if the increase in the value of MR due to the k2 term (bulk stress term) more than offsets the decrease caused by the k3 term (octahedral shear stress term). It stands to reason, therefore, that in this case, MR would only begin to exhibit decreasing values beyond the point where the decrease in its value caused by the k3 term overrode the increase caused by the k2 term. In either of the two possibilities considered above, stress-hardening behaviour of granular materials should still be anticipated only up to some threshold stress levels as confining and deviator stresses increased during the triaxial testing. This probably could be the behaviour being exhibited by Sample AAR (Figure 11). At this stage, however, no definite conclusion regarding the gravels’ k3 values can be made other than a recommendation to carry out more extensive studies and expand the gravel sample base.
4.4. Correlation of k-Values with Gravel Properties
The following correlation equations were the outcome of the regression analysis involving k-values from the resilient modulus test and the index physical properties, namely, percent finer than the 9.5 mm and 2.0 mm sieves, liquid limit, maximum dry density, and optimum moisture content of the samples.
, R2 = 0.95 (5)
, R2 = 0.95 (6)
, R2 = 0.95 (7)
where,
k1, k2 and k3 = k-values of gravel
P9.5 = percentage of gravel material passing 9.5 mm sieve
P2.0 = percentage of gravel material passing 2.0 mm sieve
LL = liquid limit
ρdmax = maximum dry density
wopt = optimum moisture content (%)
The high R2 values obtained for the regression suggest a strong correlation between the k-values and the index properties of the gravel materials. Even though the recommendation is to evaluate k-values from MR tests, the above correlations become especially useful when capability and opportunity for repeated load tests do not exist.
5. Conclusion
This study set out to determine the resilient modulus of quartzitic natural gravels using repeated load triaxial test and to evaluate the k-values (k1, k2, k3) of the materials thereof. The quartzitic gravels used in the study came from limited borrow pit sources and did not cover the whole range of natural gravel types generally used for flexible pavement construction in the country which also include lateritic gravels. The k-values from the resilient modulus tests were used to develop correlation equations involving the index physical properties of the gravels to help predict resilient modulus when the materials are used as pavement layer materials. The regression analysis returned k1 values which ranged between 441 and 958 with a mean of 516, k2 values which ranged between 0.0636 and 0.2168 with a mean of 0.1216 and k3 values which ranged between 0.1257 and 3.1590 with a mean of 1.723. The positive nature of the constant k3 is in contrast to the mostly negative values reported in literature on the parameter. Nonetheless, all the k-values correlated highly with the following index properties of the gravels: the percentages of gravel material passing the 9.5 mm and 2.0 mm sieves, liquid limit, maximum dry density and optimum moisture content. The gravels exhibited stress hardening behaviour for the most part since the resilient moduli from the triaxial tests increased with increasing confining pressure, bulk stress, and octahedral shear stress. Even though the recommendation is to evaluate k-values from resilient modulus tests, the correlations developed in this study, despite the limited sample base, may permit useful estimates of the constants to be made for such gravels under any stress state and physical condition, especially when capability and opportunity for conducting resilient modulus tests do not exist. Further work, however, is recommended to cover the entire range of natural gravels deposits in the country and investigate into detail, the nature of the constant k3 with increasing octahedral shear stress.
Acknowledgements
The tests in this study were carried out at the Central Laboratory, Materials Division of the Ghana Highway Authority, Ministry of Roads and Highways, Accra. The support of the Directorate of the Division and the assistance of the Technical Staff of the Laboratory are gratefully acknowledged.