Soft-Chemical Synthesis of Vanadium Oxide Nanostructures Using 3, 3’, 3”-Nitrilotripropionic Acid ( NTP) as a Carrier ()
1. Introduction
Divanadium pentoxide (V2O5), the most stable form in the V-O system, has been at the front position of applied research due to its unique physio-chemical properties. The layered crystal structure of vanadium oxide nanostructures are currently drawn attention for the application of super capacitors and chemical sensors [1,2], electrical and optical properties, has led to wide potential applications including rechargeable lithium batteries [3] and optical data storage media [4,5]. Vanadium pentoxide exhibits a number of polymorphs, including  -V2O5 (orthorhombic) [6],
  -V2O5 (monoclinic or tetragonal) and
  -V2O5 (orthorhombic) [7]. The
  -V2O5 phase is the most stable phase and the other two phases can be converted from the
  -V2O5 phase under high temperature and high pressure [8]. Vanadium oxide based catalysts are widely used in a variety of chemical reactions like reduction of NOx or partial oxidation of alkanes [9].
Synthesis of a wide range of nanostructures predominantly, high order nanomaterials with well defined geometries such as nanorods, nanobelts, nanotubes and nanowires have attracted fabulous interest due to their novel chemical and physical properties and their prospective applications in fabricating electronic, magnetic, optical, electrochemical devices [10-16].
There are several methods available for the synthesis of vanadium oxides nanostructures [17]. To develop a new method with desirable practical attributes, such as avoiding extreme pressure conditions, simplicity and catalyst-free [18] are needed. In this work, we have synthesized vanadium pentoxide nanostructures by soft-chemical method under ambient conditions using 3,3’,3”-Nitrilotripropionic Acid (NTP) as a carrier.
2. Experimental
3,3’,3”-Nitrilotripropionic Acid (NTP) was synthesized using green chemical method [19]. 1 gm of V2O5 powder was slowly dissolved in 100 mL diluted hydrogen peroxide solution. A transparent yellow solution was formed after completely dissolved V2O5. 2.57 gm of NTP was dissolved in 75 mL of distilled water at 80˚C this solution was added into the above transparent yellow solution. The mixed solution transferred into 500 mL round-bottom flask and kept at 80˚C on the hot plate for 1h to evaporate the solution. After reaction at 80˚C, the transparent yellow color turned into a green color solution which indicates reduction of V5+. A bulky green gel of high viscosity was obtained after slowly vaporizing the solution at 80˚C by rotary evaporation. The obtained green gel heat treated at 200˚C for 4 h in vacuum oven.

Figure 1. XRD patterns of vanadium oxide nanostructures dried at different temperatures.
The final product was then ground and calcinated at 300˚C and 400˚C for 4 h in an oven.
Crystallographic information of the samples was obtained using a X-ray powder diffractometer (D8 Advanced Brucker ) equipped with graphite monochromatized Cu K radiation (
 = 1.54187 Å). Diffraction data was collected over the 2
 range of 5˚ to 70˚. The morphologies of the resulting products were characterized using a scanning electron microscope (SEM, JEOL JSM 6390). For the TGA measurements a TA 600, operating in dynamic mode (heating rate = 10˚C/min), was employed. The electrochemical properties of the nanomaterials were investigated with a three-electrode cell with a platinum counter electrode and a silver (Ag) wire as a reference electrode. The working electrode, prepared by mixing 80 wt% of active material, 15 wt% of acetylene black and 5 wt% of polytetrafluoroethylene (PTFE), was then coated on a 1.0 cm2 ITO glass. A solution of 1 M lithium perchlorate (99.99%, Aldrich) in propylene carbonate (99.7%, Aldrich) was used as the electrolyte after purification by recrystallization and distillation, respecttively. Cyclic voltammetric (CV) measurements were carried out between the potential limits of –1.0 V and +1.0 V versus a Ag wire with a potentiostat/galvanostat (PRE 273). The CV curves were recorded at a scan rate of 5 mV/s.
3. Results and Discussion
Figure 1 shows XRD patterns of vanadium oxide nanostructures at different temperatures. Though as obtained product dried at 200˚C and 300˚C showed less intense diffraction peaks, all the diffraction patterns indicate V2O5 and no peaks related to the carrier (NTP) were observed. The precursor heated at 400˚C showed the development intense diffraction peaks corresponding to the orthorhombic structured V2O5 with lattice parameters a = 11.48 Å, b = 4.36 Å and c = 3.55 Å [JCPDS#01-089- 0612]. Note that the broad hump at 2 = 10˚ - 15˚ in all the samples reveals the experimental error in the sample preparation for recording XRD spectrum.
Figure 2 shows the thermo gravimetric analysis (TGA) of as obtained product at 70˚C. Two types of water are contained within vanadium oxide, absorbed and chemically bound water. Absorbed water, weakly associated with V2O5 layers, is located on top the layers while chemically bound water is located inside the layers. During thermal treatment of the material, the absorbed and chemically bound water molecules become mobile. The weakly bound absorbed water becomes energized and mobile at lower temperature than strongly held chemically bound water. The interlayer distance does not change much when only bound water (reversibly absorbed or hydrogen-bonded water) is removed. These parameters will alter considerably only when tightly bound (chemically bonded) water is removed and the material is on the verge of crystallization.
The weight loss in the sample happens in three steps due to the release of absorbed and chemically bound intercalated water molecules and decomposition of carrier. The first weight loss is 0.048 mg due to the loss of absorbed and weakly bound water in the temperature range 50˚C - 165˚C. The second and third weight losses are 0.092 and 0.419 mg, respectively, in the temperature range 165˚C - 510˚C due to the release of more strongly bonded water, departure of chemically bonded water and decomposition of carrier (NTP). The curve depicts steep slope between 300˚C to 500˚C. The steep slope indicates a rapid loss of mass in this temperature range.
Figure 3 shows the scanning electron microscopy (SEM) images of vanadium oxide nanostructures at different temperatures. SEM images of as obtained pro-

Figure 2. TGA curve of green gel at 70˚C.
 (a)
(a)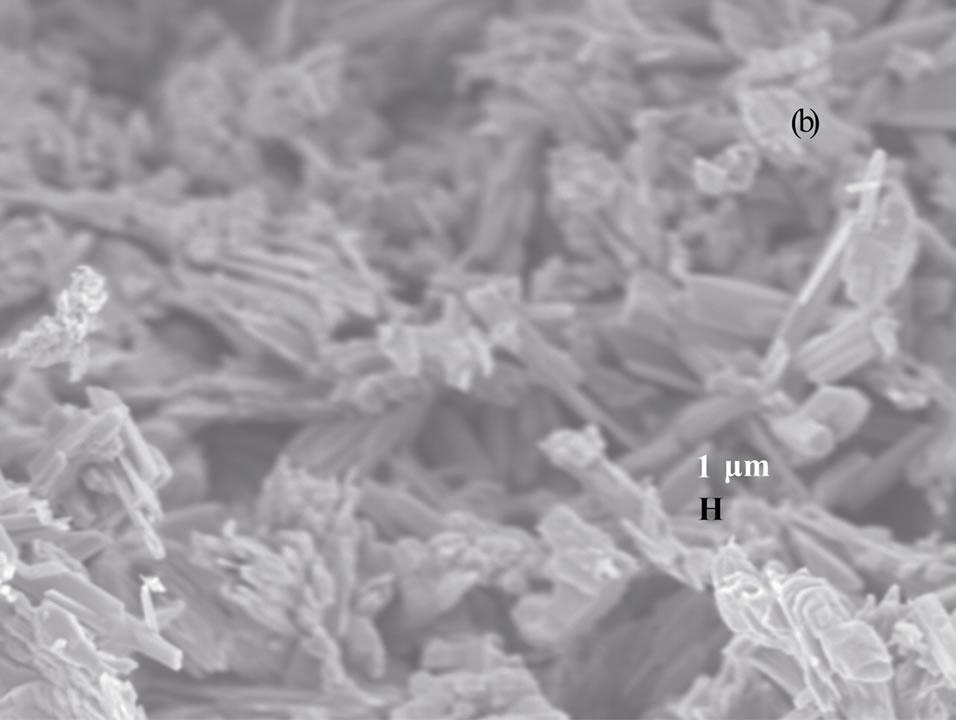 (b)
(b) (c)
(c)
Figure 3. SEM photographs of vanadium oxide nanostructures at (a) 200˚C, (b) 300˚C and (c) 400˚C.
duct dried at 200˚C and 300˚C (Figures 3(a) and (b)) reveal that the belts are tens of micrometers long, 50 - 100 nm wide and 5 - 10 nm thick. The SEM image of as obtained product dried at 400˚C (Figure 3(c)) shows the porous structure with bigger pore diameter, and this might be due to the complete decomposition of the carrier (NTP).
Cyclic voltammograms of vanadium oxide nanostructures dried at 200˚C and 300˚C are shown in Figures 4 and 5. The capacitance of the working electrode was calculated using C = i/Sm where i is the average current of the anodic and cathodic curves, S is the scan rate; m is the active mass of the working electrode. The calculated capacity is 10.54 F/g for working electrode made of vanadium oxide nanostructures dried at 200˚C and 14.78 F/g for working electrode made of vanadium oxide nano-

Figure 4. Cyclic voltammagram of vanadium oxide nanostructures dried at 200˚C in non-aqueous electrolyte (1 M LiClO4 dissolved in propylene car-bonate) with scan rate of 5 mV/s.

Figure 5. Cyclic voltammagram of vanadium oxide nanostructures dried at 300˚C in non-aqueous electrolyte (1 M LiClO4 dissolved in propylene car-bonate) with scan rate of 5 mV/s.
structures dried at 300˚C. The working electrode made of vanadium oxide dried at 200˚C exhibits broad anodic and cathodic peaks at +0.67 V and –0.37 V (Figure 4), respectively. The working electrode made of vanadium oxide dried at 300ºC shows broad anodic and cathodic peaks at +0.7V and –0.5 V (Figure 5), respectively. The cathodic reduction peak refers to the electrical energy stored in the form of chemical potential (Li+ intercalation) and the anodic oxidation peaks correspond to the chemical energy released in the form of electricity (Li+ de-intercalation).
4. Conclusions
Vanadium oxide nanostructures are successfully synthesized in bulk quantity by soft-chemical method using 3,3’,3”-Nitrilotripropionic Acid (NTP) as a carrier. Thermogravmetric results revels weight loss in the sample happens in three steps due to the release of absorbed and chemically bound intercalated water molecules and decomposition of carrier. The crystallinty of the vanadium oxide nanostructures improves with increase of dried temperature as obtained product. The capacity of the working electrode is increases with increase of dried temperature of as obtained product.
5. Acknowledgements
One of the authors (VS Reddy Channu) thank the Alexander von Humboldt Foundation for a fellow-ship. This work is partially supported by U.S-DOD-ARO-HBCU/ MI.