Characterization of Short-Term Stress Applied to the Root System by Electrical Impedance Measurement in the First Leaf of Corn (Zea mays L.) and Pumpkin (Cucurbita maxima L.) ()
1. Introduction
Measurements of electrical impedance have been used to estimate the general sanitary state of plants [1] , the nutritional state [2] , the presence of viruses [3] , the damage to fruit [4] , frost intensity [5] , structural variation of cells according to ethylene induction by electric currents [6] , cell viability during increasing frost [7] , rooting capacity of cuttings [8] , fruit maturity [9] [10] , sensitivity to salinity [11] , etc.
In all these studies, the electrical impedance measurements provided a non-destructive analyzing technique which was made on detached plant parts (like pieces of tubers, of roots, of shoots… etc.).
In previous work [12] , we measured, in vivo, electrical impedance of the first leaf of corn, submitted to variations of aerial environmental conditions (agitated air or greatly elevated relative humidity). These conditions decreased electrical impedance and proved to be stressful because they slowed down leaf growth.
In the present work, we use KCN and N, N’-dicyclohexylcarbodiimide (DCCD) as inhibitors of metabolism. Additionally, in other tests, we use stressful salinity (NaCl) [13] [14] , acidity (CH3COOH, H2SO4) and polyethylene glycol (PEG200) [15] added to the nutrient solution.
It was the aim of this work to characterize the effects of stresses applied to the root system for one hour by measuring electrical parameters of impedance of the first leaves in intact plants and to find an ESI parameter that would best be correlated with the stress applied to plant. We hypothesized that when plants are submitted to stress, the electric resistance decreases and the electric capacity increases as a result of a reduced passage of the hydro-ionic current through the system soil-plant-atmosphere.
2. Material and Methods
2.1. Plant Material
The plant materials used in this study are corn (Zea mays L. var. Doukalia), a monocotyledon, and pumpkin (Cucurbita maxima L.), a dicotyledon.
2.2. Culture Conditions
In room culture the photoperiod was 12h/12h, the light intensity was 10000 Lux (≈ 125 µmol m−2 s−1) [16] , the air relative humidity was 50 to 60% and the average temperatures day/night were 22˚C/15˚C.
After washing the seeds with water they were moistened for 1h and put to germinate in a bowl of low depth between two layers of wet filter paper and covered by a glass plate. After three days, the plate and the superior filter paper were removed.
2.3. Hydroponic Culture
Eight days later seedlings in good state and of similar size were planted in pots provided with lids pierced by six holes. The central one served for ventilation, the five other holes maintained the plants so that each pot contained five plants. The roots were immersed in the nutrient KNOP solution at various concentrations (0.1x); (1x); (2x) and (4x). For the control concentration (1x) the constitution was the following (g/l): KNO3 (0.134); KH2PO4 (0.143); MgSO4 (0.286); KCl (0.071); Ca (NO3)2 (0.286); H2BO3 (0.005); MnSO4 (0.001); ZnSO4 (0.001); CuSO4 (0.001); Na2EDTA (0.019) and FeSO4 7H2O (0.014).
2.4. Treatments of Plants
To study the effects of metabolic inhibitors (KCN, DCCD) and of various parameters of environmental stress, such as increased medium acidity, increased water or salt stress on the electrical impedance parameters (parallel capacity (Cp) and parallel resistance (Rp)) of first leaves of corn and pumpkin, various treatments were applied for one hour. The young plants were cultivated in the Knop nutrient solution for 14 days (corn) or 21 days (pumpkin). Immediately before the first Cp and Rp measurements one of the following products: KCN (10 mM), DCCD (0.001 or 0.01 mM), CH3COOH (1%), H2SO4 (2.5% or 5%), PEG 200 (2%) or NaCl (10 mM) was added to each pot (720 ml). The measurements were followed up one hour later by a second measurement of Rp and Cp on the same leaves (the self-sealing electrodes remained in place during the treatment and did not alter the state of the leaf).
2.5 Measurement of Impedance
2.5.1. Equipment, Measures and Treatment of Results
The plant is modelled as a serial or parallel resistance/capacitor circuit (figure 1). This model is very simple [17]

Figure 1. Electrical equivalent diagram for a plant (Rs: represent the plant series resistance, Rp: its parallel resistance and C: its capacity).
[18] .
The system used involves an electrical injection (1volt). The characterization of the zone targeted is made using complex circuit impedance Z, which comprises a resistance and a reactance. In each system, these components, also called respectively real and imaginary resistances, are dependent on the alternative-current frequency and are functions of each other.
The function Zi = f (Zr) brings out what is called the characteristic frequency (FC) corresponding the summit of the parabola. Real (Zr) and imaginary (Zi) resistances were calculated using the following equations:
Real resistance: 
Imaginary resistance: , where:
Rp: measured resistance of the plant C: measured capacity of the plant w: frequency of the measurement According to Laarabi et al. [12] [19] the impedance circuit equivalent of figure 1 is: 
For low frequencies (<100KHz) Rs is negligible and therefore .
.
The measuring equipment was a LCZ meter 2345 (apparatus for bioimpedance measurements). It was calibrated by the use of circuit correction (open/short) to eliminate polarization impedance of electrode interfaces. Capacities and resistances were measured at 34 frequencies in the range of 40 Hz to 100 KHz. The measurements were recorded automatically in a PC joined to the measuring equipment by an IEEE-488 interface (also known as GBIP interface) that was programmed by software and treatment developed for this study in order to cover the range of frequencies when electrical signals of 1Volt were injected from the LCZ meter. To capture electrical signals from the plants, we used self-sealing electrodes as used in electro-cardiology. To prepare these electrodes, we cut them out of electrodes of brand "Schiller Ag"; the place being used for the connection with the LCZ meter was left intact. The cut electrode looks like a cheese grater, with a surface of 1cm2. For the gramineous leaf, for example, the electrode was placed on both sides of the central rib. The sleeve and the threads of connection go towards the leaf summit. The surface of the first leaves of all plants tested was superior to 1 cm2.
2.5.2. Measurement on First Leaves
The day when seeds were moistened is considered as the first day of active life of our plants. The measurements were made on intact plants. The apical part of the first leaf was placed, in a plane parallel to the lines of the current, between the two electrodes.
2.6. Statistical Calculation
Data presented are average ± standard deviation calculated by a statistical software (SPSS) on the basis of the number of repetitions (n) that we could make (n equal to or higher than 3 for every sample). Each sweeping of the 34 frequencies lasts 2 minutes.
3. Results and Discussion
3.1. Effects of Nutrient Concentrations in the Root Medium on Impedance
Figure 2 shows that spectroscopic electrical impedance varied according to the nutrient levels. Indeed, the curve of spectrometry of bioimpedance (CSB) at concentration (2x) was the highest followed by the one observed at concentration (1x) and then at concentration (0.1x), whereas the curve at concentration (4x) was much lower. Results given in table 1 show that the capacity increased from 5.1nF to 8.11nF when the nutrient level increased from 1x to 4x. For resistance we observed a non significant increase from 167 KW to 170 KW when the nutrient level increased from (0.1x) to (1x). Rp became highly elevated to 281 KW for the nutrient level of (2x) and much reduced to 87 KW for the nutrient level (4x).
We noticed that capacity and resistance evolved in the same direction (both rising) during the increase of nutrient solution strength from (0.1x) to (2x) and in opposite directions at the highest concentration (4x): resistance decreased whereas capacity increased. These results are in agreement with observations of seasonal variations of impedance parameters. Indeed, an increase of intracellular resistance during winters i.e. in a wetter period with diluted soil ionic composition [20] has been shown during cold acclimation [5] . This increase reflects an increase in symplastic viscosity as a result of increased intracellular sugar concentration [17] [21] . Moreover, the concentration of the osmotic solution affects ion movement and electric current flux while viscosity increases; this could explain why resistance and capacity increased when nutrient level increased from (0.1x) to (2x). This phenomenon has been observed in cold weather that provokes an increase of viscosity [22] -[26] . The very strong reduction of Rp observed at (4x) indicates that this very high concentration reduces the plasmalemma permeability and does not permit an elevation of electrolyte concentration in cells and causes reduction of metabolic activity and energy turnover [27] -[29] . This would have negative consequences on plant growth and development. Indeed, the best accumulations in dry matter have been found in wheat cultivated on (1x) and on (2x) [30] .
3.2. Effect of Metabolic Inhibitors in the Root Medium on Impedance
The analysis of the figure 3 shows that the addition of KCN at 10 mM during one hour provoked some variations in the impedance parameters. Indeed, the results of table 2 show an increase of capacity of 120.08% compared to the control (from 6.97 nF to 15.34 nF). On the other hand, the resistance decreased by 80.85% compared to control (from 101.07 KW to 19.35 KW).
The analysis of the figure 4 shows that the amplitude of CSB decreased with an increase of DCCD concentration. The results of table 3 show that capacity increased proportionally with the increase of DCCD concentration. In contrast, the resistance decreased with the increase of DCCD concentration.
These results find an explanation in the effect of the inhibition of energy metabolism caused by KCN and DCCD. This inhibition caused by KCN probably inhibits an H+-ATPase pump [31] . Thus dissipates an electro-chemical gradient through the membranes [32] .
With the resulting passive conduction of ions the electrical conductivity becomes retarded and provokes an increase of the electric capacity by accumulation of the electric charges of ions. The action of these inhibitors on the electrical phenomena has been observed in the case of the inhibition of membrane depolarization by DCCD in Beta vulgaris [33] and in the case of membrane polarization observed by the addition of NaCN, CCCP and DCCD [34] .
3.3. Effects of Root Medium Acidification on Impedance
The analysis of figure 5 reveals the action of culture medium acidification on the impedance parameters. The results of table 4 demonstrate that CH3COOH addition after one hour of treatment provokes a capacity increase of 47.5% (from 11.79 nF to 17.39 nF) and resistance reduction of 29.4% (from 77.2 KW to 54.5 KW) compared to the control.
In figure 6 we show that the CSB amplitude decreased when H2SO4 concentration was increased. Data in table 5 show that capacity values were greater when the H2SO4 concentration increased. Whereas, resistance values decreased while H2SO4 concentration increased.
These variations in capacities and resistances can be due to the fact that environmental acidification provokes an elevated electro-chemical H+-gradient that increases the H+ impulse through plasmalemma [35] . Resistance reduction observed during culture medium acidification could be explained by proton pump activation [36] [37]

Figure 2. Impedance of the first leaf of the whole plants of 14 day old corn cultivated hydroponically on Knop’s nutrient solution of different strengths ( n—number of repetitions).

Figure 3. Effects of KCN on the impedance of the first leaf of whole plants of 14 day old corn cultivated on Knop’s nutrient solution at (1x) (3 repetitions).

Table 1. Variations of parallel capacity (C) and parallel resistance (Rp) of the first leaf of 14 day old corn measured at characteristic frequency (FC) as a function of Knop’s nutrient solution of different strengths (0.1x; 1x; 2x; 4x). n—number of repetitions.
that would provoke H+ extrusion that is bound to H+-hexose cotransport mechanism forced by active H+ extrusion [38] and K+/H+ co-transport [35] [39] . Data suggest that pH variation stimulate the root system, this generates electrical signals from roots to leaves which change transpiration and photosynthesis [40] [41] .

Figure 4. Effects of DCCD applied at different concentrations on the impedance of the first leaf of whole plants of 21 day old pumpkin cultivated on Knop’s nutrient solution at (1x) (3 repetitions).

Figure 5. Effect of CH3COOH on the impedance of the first leaf of whole plants of 14 day old corn cultivated on Knop’s nutrient solution at (1x) (3 repetitions).
Table 2. Effects of KCN on parameters of impedance of the first leaf of 14 day old corn before and after a 1-hr treatment (C—capacity and Rp—resistance measured at characteristic frequency ).
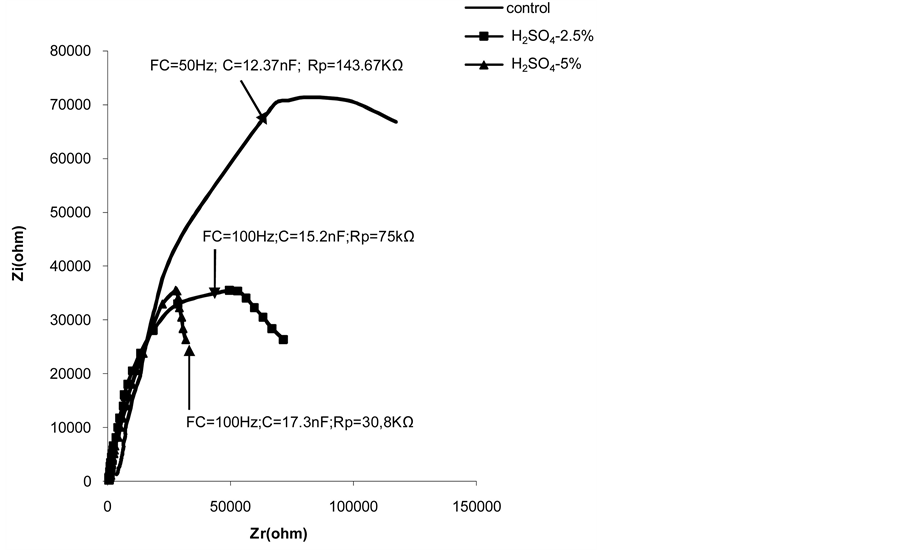
Figure 6. Effect of H2SO4 applied at different concentrations on the impedance of the first leaf of whole plants of 14 day old corn cultivated on Knop’s nutrient solution at (1x) (3 repetitions).
Table 3. Effects of DCCD on parameters of impedance of the first leaf of 21 day old pumpkin (C-capacity and Rpresistance measured at characteristic frequency).
Table 4. Effects of CH3COOH on parameters of impedance of the first leaf of 14 day old corn before and after a 1-hr treatment (C-capacity and Rp-resistance measured at characteristic frequency).
Table 5. Effects of H2SO4 on parameters of impedance of the first leaf of 14 day old corn (C-capacity and Rp-resistance mesured at characteristic frequency).
3.4. Effect of PEG 200 Added to the Root Medium on Impedance
Figure 7 shows that impedance parameters are sensitive to osmotic stress. Results in table 6 show that the presence of PEG 200 provoked a capacity increase of 44.89% (from 14.86 nF to 21.53 nF) and resistance reduction of 34.49% (from 112.40 KW to 73.63 KW). This result can be explained by cellular turgor reduction due to

Figure 7. Effect of PEG on the impedance of the first leaf of whole plants of 14 day old corn cultivated on Knop’s nutrient solution at (1x) (3 repetitions).
Table 6. Effects of PEG on parameters of impedance of the first leaf of 14 day old corn before and after a 1-hr treatment (Ccapacity and Rp-resistance measured at characteristic frequency).
the water loss by root and transpiration reduction by stomatal closure. In this case ionic charge concentration increases which can be explained by reduction of water absorption that causes a reduction of resistance. It was observed [42] , in internodal cells of Chara, that cellular permeability for water was reduced when osmotic pressure increased in the environment by mannitol addition, this suggest that water rate affects the electrical properties [43] .
3.5. Effect of NaCl Added to the Root Medium on Impedance
Figure 8 shows that impedance parameters vary with salt stress. The results in table 7 show that NaCl addition caused a capacity increase of 43.29% (from 11.99 nF to 17.18 nF) and a resistance reduction of 36.24% (from 93.90 KW to 59.87 KW) compared to the control.
These results can be explained by ion retranslocation via the phloem that is considered a potentially important mechanism to prevent salt accumulation in completely expanded leaves [44] [45] . Greater ion translocation has been found in corn, compared to other crop plants that can be due to carbon translocation observed in C4 plants in contrast to C3 plants [46] . These authors concluded that transport via the phloem plays an important role in the control of Na+ and Cl− ion contents in leaves. Thus we may conclude that Na+ and Cl− chemical properties affects the electrical properties measured [43] .
4. Conclusion
In conclusion, the spectroscopic analysis of electrical impedance is a very useful method for the study of the physiological state of plants and its variations. It is a non-destructive, fast method and with a suitable scheduling 300 to 350 samples can be measured per day which is a considerable advantage over destructive and slow diagnosis methods. The facts that intact plants are used and that measurements are done in situ reduce external disruptions maximally and give more reliable results on the real effect of a stress comparatively with measurements made on detached plant parts. In other hand, when we used, in this method, self-sealing electrodes any minor damage occurs comparatively with the process inserting electrode into the plant tissue [47] .
Capacity and resistance as electrical parameters of impedance are very sensitive to physiological variations in

Figure 8. Effects of NaCl on parameters of impedance of the first leaf of 14 day old corn before and after a 1-hr treatment (C-capacity and Rp-resistance measured at characteristic frequency).
Table 7. Effects of NaCl on parameters of impedance of the first leaf of 14 day old corn before and after a 1-hr treatment (Ccapacity and Rp-resistance measured at characteristic frequency).
plants and therefore can provide us with information on physiological changes in plants submitted to stress. They can also give information on soil contamination or help in evaluating a site for future crop exploitation. In general, elevated capacity and weak resistance are characteristics of an unfavourable physiological state.
Acknowledgments
This work was financed by the Ministry of Higher Education of Morocco through the Program of Support to Scientific Research (PARS Agro 106).