Diagnosis and Recommendation Integrated System (DRIS) to Assess the Nutritional State of Cotton Crop in Brazil ()
With this high cost for fertilizers and limestone, it is necessary to have a quite efficient management of these inputs, to avoid the rise of this cost. It is common to observe in farmland that the farmers do not have a good management design in their farms, it results in the rise of the production cost over the estimated.
The over input of fertilizers is an used practice among farmers, to achieve this aim it is necessary to evaluate the nutritional state of the plant to obtain information about the relation among nutrients available in the soil, nutrients content in the plant and yield. It is known that the plant is considered an extractor of nutrients from the soil. The use of leaf diagnosis can provide important information about the capability of nutrient extraction from soil, with the possibility of the plant answer to fertilizers input in the soil.
To accomplish this idea, it is need to have an efficient tool of diagnosis, however, it is not coming true. The sufficient range is the most used system of nutritional diagnosis in plants, but this system does not offer important results in crops under the field conditions [2-5].
The most disadvantage of the sufficient range method: its diagnosis results do not show the nutritional balance; it is not feasible to know the order of nutritional requirement; the leaf nutrient contents are not correlated to the yield under field conditions; it is sensitive to the stage of plant maturation, this way the diagnosis must be done at the same stage that the sufficient range was established [2,6].
With the intent to correct the problems observed into the sufficient range, reference [6] developed the Diagnosis and Recommendation Integrated System (DRIS).
This diagnosis system consists in dual ratios among all nutrients in diagnosis (N/P, N/K, …, K/N, K/Ca, etc.). But, to use DRIS is necessary to develop DRIS norms, these norms were developed from data of farmland or experimental units. The most important is that the data must be from high yield population.
For each nutrient under diagnosis, the DRIS method provides one DRIS index, this index can be positive or negative, which represents the effect of each nutrient into the nutritional balance of the plant. The closer the proximity of the DRIS index to zero, closer to the nutritional balance this nutrient will be [6-8]. The origin of theses indices is from the comparative analysis with the norms previously established being necessary to relate the nutrients in dual ratios (N/P, P/N, N/K, K/N, etc.) in the sample, and in this way, it is possible to assess the sample through the DRIS system.
It is necessary to interpret the DRIS index for each nutrient, this interpretation depends on the value and the sign of the index. The order of nutrient requirement by plant is the most used method to interpret the DRIS indices. In this method, the DRIS indices are arranged from the most negative to the most positive value. When the DRIS index is close to zero, it means that the nutrient is adequate for the plant [2,6,7,9].
The proposed in this study was to apply the Diagnosis and Recommendation Integrated System (DRIS) to assess the nutritional state of cotton crop through the order of nutrient requirement and nutritional balance.
2. Materials and Methods
2.1. Data Source
This study was performed with data from commercial cotton fields, of the growing season 2004/2005, in southern Mato Grosso, Brazil (approximately 120˚41'S, 450˚40'W, average altitude 497 m asl). The soil of the study area consisted predominantly of Oxisol [10]. Yield data of the conventionally tilled varieties DeltaOpal, DeltaPenta, DeltaPine Acala 90, CNPA ITA 90, and FiberMax 966 were compiled in a database.
2.2. Data Base
To constitute the database, 108 samples of complete leaves (blade + petiole), of which each consisted of 30 single samples were randomly selected in each commercial plot (average acreage 100 ha). One sample per plant was taken from the fifth leaf on the main stem [11], during flowering of the crop (stages F1 to F4), according to the classification of [12]. The samples were dried in a forced-air oven at 65˚C to constant weight, ground and sieved (60 mesh/cm2). The seed cotton yield (kg∙ha−1) was evaluated at the end of the cycle, after harvesting the plots with a combine harvester.
In the leaf samples, the total contents of N, P, K, Ca, Mg, S, B, Zn, Cu, Mn, and Fe were determined by the methodology described by [13]. The information stored in the database and used for DRIS were the total leaf contents of macronutrients (g∙kg−1) and micronutrients (mg∙kg−1) and seed cotton yield (kg∙kg−1).
2.3. Development of DRIS Norms
The database was divided into two subpopulations, using the mean + 2/3 standard deviation as criterion to separate the populations into a high-yielding group over 4785 kg∙ha−1 (mean + 2/3 standard deviation) and one with seed cotton yield below 4785 kg∙ha−1. The high-yielding population was compound by 18 plots and 90 plots were compound the low-yielding population.
The determination of the ratio (A/B or B/A) to establish the norm by the variance ratio method, the F value, was defined as the variance ratio of the low-yielding (nonreference) and high-yielding population (reference), and the order of the ratio with the highest value was chosen among the variance ratios [7,14-16] (Table 1).
2.4. Calculation of DRIS Function
To evaluate the nutritional state by DRIS method, it was chosen 16 samples among the whole data base, the choice of the samples were determined by the order of yield. The DRIS function was established in each sample, according to [6] (Equation (1)-(3)), using an adjustment factor (K) = 1:
For A/B < a/b;
 (1)
(1)
For A/B = a/b
 (2)
(2)
For A/B > a/b;
 (3)
(3)
2.5. Calculation of DRIS Índices
The DRIS indices were calculated following the general

Table 1. DRIS norms used to assess the nutritional state of the cotton crop.
formula proposed by [6], where for nutrient A (Equation (4)):
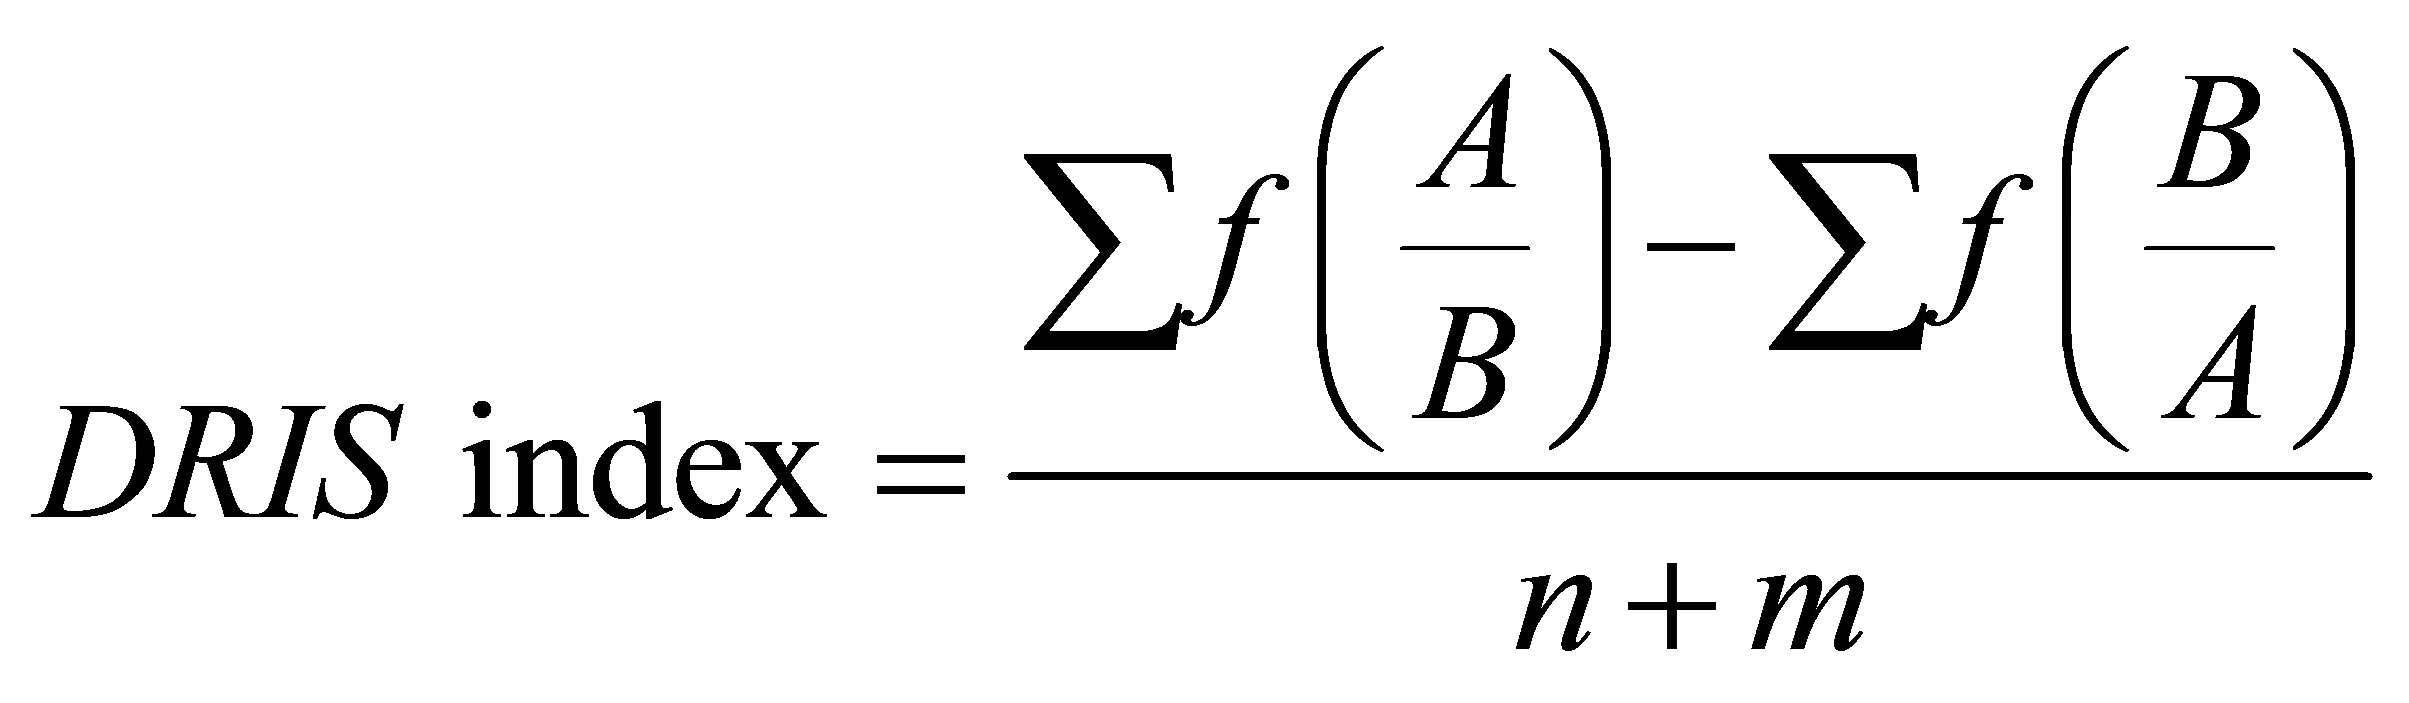 (4)
(4)
n = number of DRIS functions in the directly way (A/B), m = number of DRIS function in the reverse way (B/A).
2.6. Statistical Analysis
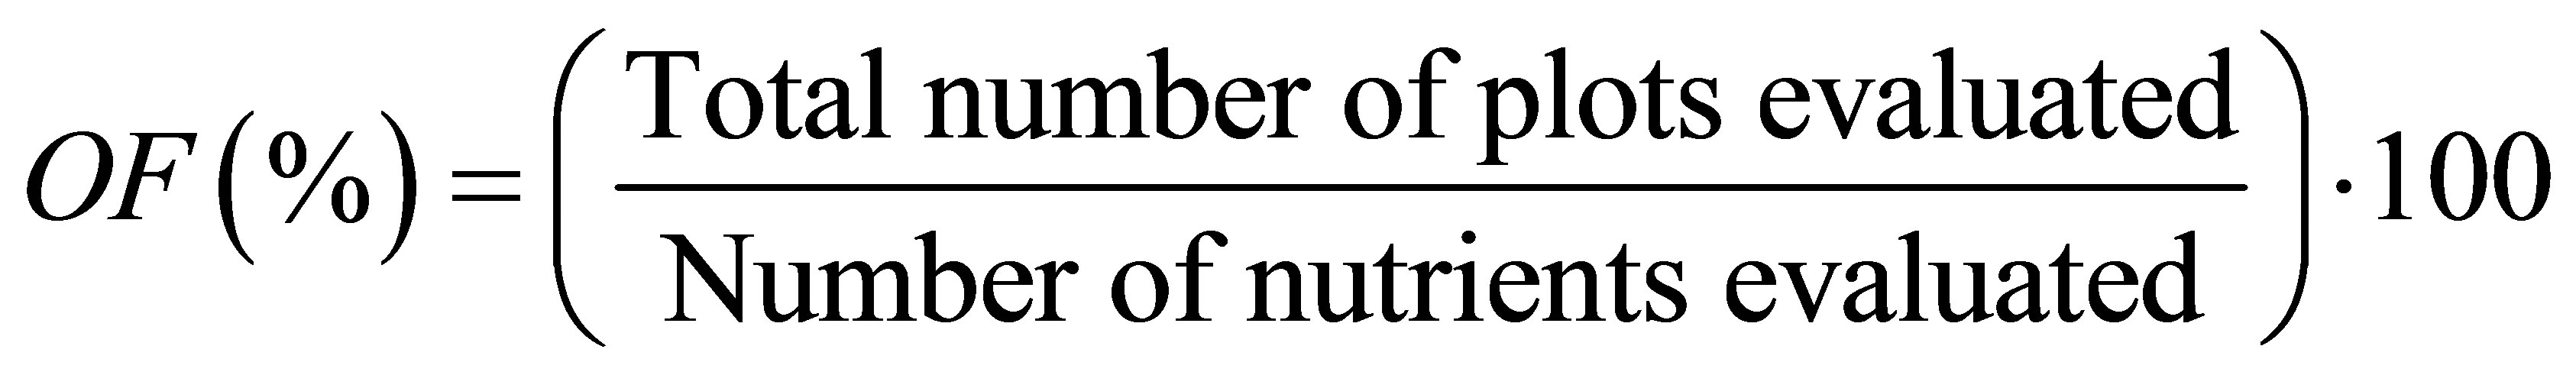
The hypothesis was tested whether the nutrient at which each nutrient appeared as the most required and less required had been randomly attributed. For this purpose, the chi-square test (χ2) of Pearson was applied at 1% probability, with n − 1 degrees of freedom (n = number of analyzed nutrients). If the hypothesis were true, the observed frequencies for all nutrients would be statistically equal to each other [15,16]. The expected frequencies (EF) and observed (OF) were calculated as following (Equation (5)-(7)):
 (5)
(5)
 (6)
(6)
 (7)
(7)
Statistical analysis was performed using the program SPSS for Windows, version11.0.0 [17]. The other DRIS calculations were performed with Excel® (2010) spreadsheets [18].
3. Results and Discussion
The use of DRIS method to diagnose the nutritional state of cotton crop make possible the identification of the nutrients that limited the yield. With this methodology, it was determined the positive and negative index for each nutrient in diagnosis (Figure 1). According to [6], when the DRIS index is close to zero, it means that this nutrient is in nutritional balance, on the other hand, when the DRIS index for one nutrient is far from zero, it means that this nutrient is out of nutritional balance. DRIS index below zero (negative) indicates nutritional limitation by deficiency and DRIS index above zero (positive) indicates nutritional limitation by excess (Figure 1).
The results showed that the minors yields of the cotton crop were related to the nutritional imbalance. This fact can be observed in Figure 1, where the yield of 3510 kg∙ha−1 the DRIS indices range from −3.3 to +6.2. Otherwise, in the higher yield (5310 kg∙ha−1) the DRIS index range from −0.641 a +0.998.
According to [19], the adequate range of DRIS indices to define the nutritional balance would be between −10 to +10, when the DRIS index is into this range it means that the nutrient is in nutritional balance. This author used the adjustment factor (K) = 10, and in this work it was used the adjustment factor (K) = 1, this way, based on the methodology of [19], the adequate range for the DRIS index, in this work, would be −1 to +1.
Based on this adequate range of DRIS indices, the minor yield (3510 kg∙ha−1) would be in nutritional deficiency of Zn > P > S > N, excess to Mn > Fe > B and in nutritional balance for K, Ca, Mg and Cu (Figure 1). However, the plots that showed the higher yield (5310 kg∙ha−1) would be in nutrition balance for all nutrients in diagnosis. Reference [2] proved that even all the nutrients being into the adequate range, it is important to identify the order of nutrition limitation and it is possible through the DRIS method.
It was applied the chi-square (χ2) test to certificate the hypothesis of randomness of the results diagnosed as the most and the less required nutrient by the plant. The test was effective (p < 0.01) to prove that the results were not random but the use of DRIS was effective in diagnosing the nutritional status, rejecting the hypothesis that the most and the less required nutrient had been randomly diagnosed by the DRIS method (Table 2).
The observed frequency showed different results than the expected frequency, this way, it was possible to confirm the diagnosis of the DRIS method. Thus, the order of the nutritional requirement of the cotton crop was established (Table 3).
The results showed that the order of the nutritional requirement by plant was different among the plots assessed, the result depends on the yield of the cotton crop. Among the plots assessed, the S was the nutrient that showed the higher frequency (36.36%) as the most nutrient required by plant, followed by B (27.27%) and Zn (27.27%). The Mn showed the highest frequency as the less required nutrient in diagnosis (36.36) (Table 3). The fact of Mn been the less required implies that this micronutrient can cause nutritional limitation because of excess into the tissue of the plant.
The soil of the work is classified as Oxisol, a typical tropical soil. The feature of this soil is the high content of Mn available in soil solution. The excess of Mn can cause toxity in the plant. According to [20], in tropical soil and subtropical that are acid, the avaibility of Mn is higher, this situation increase the chance of occurring the toxic of the plants.
The Zn and B have an important hole in mineral nutrition of cotton crop. The expectation of high yield in cotton crop is achieved when these micronutrients are in adequate level in the leaf tissue. It is feasible to observe that in higher yield the requirement for these micronutrients is high. In the two highest yields assessed in this work (4950 e 5310 kg∙ha−1), the B was the most required nutrient by cotton crop (Table 3).
The answer of the cotton crop to B is quite expressive, the deficiency of this micronutrient can limit the reach of high yield. According to [21], the deficiency of B in the cotton crop is wide in Brazil, due to the fact of the country being located in tropical conditions where there is low organic matter accumulation in the soil that is the major source of B in the soil.
The decision to correct B and Zn in the soil or not, to reach higher yield must be well thought because, many

Table 2. Chi-square test and values of observed (OF) and expected frequencies (EF) (%) for N, P, K, Ca, Mg, S, B, Zn, Cu, Mn, and Fe as the most required by plant and the less required by the DRIS method.

Table 3. Order of plant requirement by nutritional diagnosis of DRIS method.
factors can influence in the availability of these nutrients in the soil. The nutritional diagnose identifies the nutritional limitation, however, it is necessary to study the other factors that maybe influence in the vegetable production.
In this work, it was use the relationship between nutritional balance index (NBI) and yield to verify the efficiency of diagnosis in the plots selected to be assessed. The NBI and yield is one possibility to evaluate the efficiency of the DRIS method. According to [6], lower the NBI more nutritional balance is the plant. This procced were used previously form crops as Hevea brasilienses [6], grass [22]. Coffee [23], rice [24], etc.
The relation between NBI and yield resulted in linear equation, being possible to observe that lower the NBI, higher the yield. The relationship indicated that crops nutritionally balanced results in higher yield. The NBI is the sum of the all DRIS indices in module, this sum resulted in lower values for cotton crop with high yield (Figure 2).
In the Figure 2, it is feasible to observe that the lower yield was reach with higher values of NBI and higher yields were reach with lower NBI. It is conclude that high yield is reach just when the cotton crop is nutritionally balanced.
4. Conclusions
The DRIS method was efficient to evaluate the nutrition state of cotton. It was feasible to identify the order of plant requirement and nutritional balance. It was feasible to observe that the smaller the NBI greater the yield. It means that to reach high yield it is necessary to show

Figure 2. Relationship between nutritional balance indice (NBI) and yield.
low NBI.
The nutritional diagnosis by DRIS method was not randomized. The method was able to identify the nutritional limitation for cotton crop.
The Sulphur, Boron and Zinc showed the higher frequency as the most required nutrients by plant. The Magnesium and Manganese were the less required by the cotton plant, this means that both of them were possibly limiting the yield by excess in the tissue.
Acknowledgements
The authors are indebted to the Brazilian Federal Agency for Support and Evaluation of Graduate EducationCAPES for the doctoral fellowship of the first author at Universidade Federal da Grande Dourados (UFGD).
NOTES