Effects of Hyperventilation on Venous-Arterial Bicarbonate Concentration Difference: A Possible Pitfall in Venous Blood Gas Analysis ()
Keywords: Hyperventilation; Bicarbonate; Bland-Altman Analysis; Venous Blood Gas Analysis
1. Introduction
Since the pulse oximeter was invented and it became possible to evaluate the systemic oxygen level by measuring percutaneus oxygen saturation (SpO2), peripheral venous blood gas analysis (VBGA) with simultaneous SpO2 measurement has been considered useful as an alternative to arterial blood gas analysis (ABGA) [1-3]. Indeed, physicians are now widely and even routinely performing VBGA with SpO2 measurement instead of sampling arterial blood, because VBGA is much easier and less invasive than ABGA especially in the youngest pediatric patients and in an emergency room. The agreement between variables on arterial and venous blood gas analysis has been well reviewed [1]. The usual method to evaluate the agreement has been with the Bland-Altman analysis [4].
Previously we reported that intentional hyperventilation increased venous-arterial partial CO2 pressure (PCO2) differences and pH differences [2]. We also reported that underestimation of respiratory alkalosis may occur with the “SpO2 plus VBGA” method in untreated respiratory alkalosis patients [2]. Here we evaluated the agreement in venous-arterial bicarbonate concentration
 measurements by the Bland-Altman analysis.
The effects of intentional hyperventilation on the venousarterial  difference were also evaluated. In addition, the differences in healthy volunteers and in untreated respiratory alkalosis patients were also compared.
2. Methods
2.1. Subjects
The present study was approved by the Ethics Committees at Ohtawara Red Cross Hospital and the International University of Health and Welfare. 141 subjects (95 males and 46 females, ranging from 16 to 91 years of age) were enrolled in this study after we obtaining their informed consent. Among these 141 subjects, 11 healthy volunteers and 130 patients with various diseases were included. Among these 130 patients, 13 patients with hyperventilation with PaCO2 < 35 mmHg and arterial pH (pHa) > 7.45 without the treatment such as a paper bag re-breathing maneuver were included.
2.2. Blood Sampling and Gas Analysis
The brachial artery and the median vein were used for the blood sampling. Arterial and venous blood was sampled simultaneously with a small (1 ml) syringe containing heparin, and was immediately analyzed with an automatic blood gas analyzer (Rapidlab 840, Bayer Healthcare, Leverkusen, Germany, or Rapidlab 1265, Siemens Healthcare Diagnostics, Sudbury, United Kingdom). Blood sampling from healthy volunteers was done first at rest and then immediately after hyperventilation. The venous-arterial  difference is hereafter termed
 . End-tidal PCO2 (PETCO2) was measured with a gas analyzer (Respina IH26, NEC San-ei, Tokyo, Japan) [5].
Bicarbonate concentration was calculated by the following equation:

2.3. Protocols of Loading Maneuvers
In order to look at the effects of hyperventilation, the subjects breathed room air at a fixed rapid rate for 3 min. The breathing rate was changed from resting (11 - 20 times per min) to 30 and then to 60 times per min. The timing of breathing was announced by a time keeper and the subjects followed his voice. The subjects were requested to keep the same tidal volume so that the PETCO2 was 30 ± 2 and 22 ± 2 mmHg during the 30 and 60 breaths/min hyperventilation maneuvers, respectively.
2.4. Statistical Analysis
Values are expressed as mean ± standard deviation unless indicated. We tested the linear correlation for the bicarbonate difference between ABGA and VBGA by the Spearman rank method, and compared the differences by BlandAltman analysis [4]. We used an analysis of variance with a Fisher post hoc multiple comparison for the evaluation of repeated measures between resting and intentional hyperventilation. An unpaired t-test (two-tail) was used for the comparison between healthy volunteers and patients. P < 0.05 was considered statistically significant.
3. Results
3.1. Arterial and Venous Bicarbonate Concentration at Rest
The arterial and venous  data at rest (n = 141) are plotted in Figure 1. Data for both healthy volunteers and various patients are included. The relationship between the ABGA and VBGA was close for
  (r =
(r =
0.897, P = 3.85 × 10−51, Figure 1(a)). Bland-Altman plots are shown in Figure 1(b). The relative average bias of  was 2.00 mEq/l with venous
  higher than arterial
  and 95% limits of agreement of ±4.15 mEq/l.
3.2. Effects of Intentional Hyperventilation on Venous-Arterial Bicarbonate Concentration Difference
In the resting condition,  was 1.73 ± 1.71 mEq/l (n = 6, Figure 2). Hyperventilation challenges increased
  in an intensity-dependent manner.
3.3. Venous-Arterial Bicarbonate Concentration Difference in Patients with Hyperventilation
The  data from healthy volunteers and from patients with untreated respiratory alkalosis (PaCO2 < 35 mmHg and pH > 7.45) are shown in Figure 3. It was found that
  was larger in the untreated patients (P = 0.0024).
4. Discussion
A meta-analysis and a review using Bland-Altman analysis reported that venous pH, bicarbonate and base excess
have sufficient agreement to be clinically interchangeable for arterial values for patients in the emergency department [1,3]. On the other hand, agreement between arterial and venous PCO2 has been reported to be too poor and unpredictable in clinical usage as a one-off test, and PCO2 might be useful to screen for arterial hypercarbia or monitor trends in PCO2 for selected patients.
In untreated hyperventilation patients, we reported that the “VBGA plus SpO2” method may lead to underestimation or misdiagnosis of respiratory alkalosis [2]. We speculated that the phenomenon could be attributed to the increase in the differences in venous-arterial PCO2 and pH in the acute phase of hyperventilation. We also
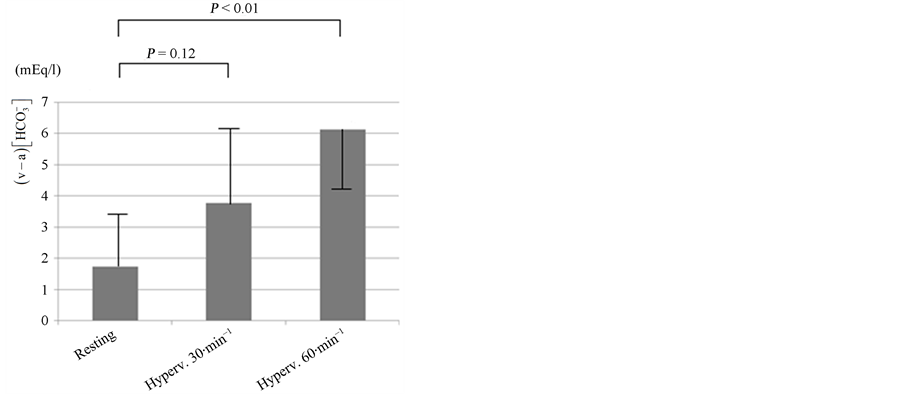
Figure 2. Intensity-response relationship between the level of hyperventilation and the venous-arterial bicarbonate concentration difference . The breathing rate was changed from resting (11 - 20 times per min) to 30 and then to 60 times per min. Hyperventilation (Hyperv.) increased
  in an intensity-dependent manner (n = 6). Error bars: SD.
speculated that the increases in these differences are due to the reduction of peripheral blood perfusion which was induced by hyperventilation-associated systemic vasoconstriction. Other reported factors that affect the differences in venous-arterial PCO2 and pH are finger exercise and hypotension [2,6].
Here we evaluated  in hyperventilation and found that
  increases after the 3 min hyperventilation challenge in an intensity-dependent manner (Figure 2).
  also increased in untreated respiratory alkalosis patients (Figure 3). The time course of
  after hyperventilation has not been well studied. Nevertheless, we suppose that
  is increased in the acute phase of hyperventilation (in the same time of developing respiratory alkalosis), but
 might decrease more swiftly than the normalization of respiratory alkalosis in arterial blood gas data. We experienced some already treated respiratory alkalosis patients using a paper-bag rebreathing maneuver without an increase in
  (data not shown).
Further investigation is needed to confirm this.
As for the Bland-Altman analysis data, our results for
 are similar to previous reports [7-9] (Table 1).
The authors wrote that the agreement was acceptably narrow. Nevertheless, we feel that the 95% limits of agreement of ±5.05 mEq/l [9] are not so narrow. We

Table 1 . Previously reported Bland-Altman analysis data comparing arterial and venous .
.
cannot clearly say that our data of 95% limits of agreement of ±4.15 mEq/l are narrow or not narrow (important or not important). Our feeling is intermediate on this.
Anyway, peripheral venous  seems to be useful.
As for the comparison between the arterial blood and “central” venous blood, Middleton et al. reported similar data [10] (Table 1).
Our report is the first that addresses how hyperventilation increases the difference between arterial and venous bicarbonate concentration. Physicians should keep this phenomenon in mind when performing venous blood gas analysis.
[2] A. M. Kelly, “Review Article: Can Venous Blood Gas Analysis Replace Arterial in Emergency Medical Care,” Emergency Medicine Australasia, Vol. 22, No. 6, 2010, pp. 493-498. http://dx.doi.org/10.1111/j.1742-6723.2010.01344.x
[3] A. Umeda, K. Kawasaki, T. Abe, et al., “Hyperventilation and Finger Exercise Increase Venous Arterial PCO2 and pH Differences,” American Journal of Emergency Medicine, Vol. 26, No. 9, 2008, pp. 975-980. http://dx.doi.org/10.1016/j.ajem.2007.12.001
[4] B. L. Lim and A. M. Kelly, “A Meta-Analysis on the Utility of Peripheral Venous Blood Gas Analyses in Exacerbations of Chronic Obstructive Pulmonary Disease in the Emergency Department,” European Journal of Emergency Medicine, Vol. 17, No. 5, 2010, pp. 246-248. http://dx.doi.org/10.1097/MEJ.0b013e328335622a
[5] J. M. Bland and D. G. Altman, “Statistical Methods for Assessing Agreement between Two Methods of Clinical Measurement,” Lancet, Vol. 1, No. 8476, 1986, pp. 307- 310. http://dx.doi.org/10.1016/S0140-6736(86)90837-8
[6] Y. Okada, T. Satoh, S. Kuwana, et al., “Electrical Stimulation of the Rabbit Pulmonary Artery Increases Respiratory Output,” Respiratory Physiology & Neurobiology, Vol. 140, No. 3, 2004, pp. 209-217. http://dx.doi.org/10.1111/j.1742-6723.2004.00642.x
[7] F. Shirani, R. Salehi, A. E. Naini, et al., “The Effects of Hypotension on Differences between the Results of Simultaneous Venous and Arterial Blood Gas Analysis,” Journal of Research in Medical Sciences, Vol. 16, No. 2, 2011, pp. 188-194.
[8] A. M. Kelly, R. McAlpine and E. Kyle, “Agreement between Bicarbonate Measured on Arterial and Venous Blood Gases,” Emergency Medicine Australasia, Vol. 16, No. 5-6, 2004, pp. 407-409. http://dx.doi.org/10.1111/j.1742-6723.2004.00642.x
[9] W. G. Herrington, H. J. Nye, M. S. Hammersley, et al., “Are Arterial and Venous Samples Clinically Equivalent for the Estimation of pH, Serum Bicarbonate and Potassium Concentration in Critically Ill Patients?” Diabetic Medicine, Vol. 29, No. 1, 2012, pp. 32-35. http://dx.doi.org/10.1111/j.1464-5491.2011.03390.x
[10] G. Malatesha, N. K. Singh, A. Bharijia, et al., “Comparison of Arterial and Venous pH, Bicarbonate, PCO2 and PO2 in Initial Emergency Department Assessment,” Emergency Medicine Journal, Vol. 24, No. 8, 2007, pp. 569- 571. http://dx.doi.org/10.1136/emj.2007.046979
[11] P. Middleton, A. M. Kelly, J. Brown, et al., “Agreement between Arterial and Central Venous Values for pH, Bicarbonate, Base Excess, and Lactate,” Emergency Medicine Journal, Vol. 23, No. 8, 2006, pp. 622-624. http://dx.doi.org/10.1136/emj.2006.035915
NOTES