mDAG: A web tool for analyzing, visualizing, and interpreting response patterns in gene expression data with multiple treatments ()
1. INTRODUCTION
In gene expression studies with many treatments (e.g. [1,2]), it is desirable to employ a post hoc approach in which only  groups of gene expression values are measured and
  tests are made to compare how a gene responds to all pairs of treatments. A number of post hoc approaches, such as [3,4], employed ternary digits to represent patterns of gene response. Although ternary-digit patterns are concise and have been found useful in calculating the statistical significance of observed response patterns, they are harder to interpret and visualize. Instead of ternary digits, recent studies exploited directed graphs to represent patterns of gene response to all treatment pairs, such as [5,6]. In this approach, vertices represent treatments and edges represent how a gene responds to all pairs of treatments. The authors showed that this representation made it possible to reason about the accuracy of response as a function of sample size. Specifically, as the number of samples (replicates) increases, gene patterns are more likely contractible. Moreover, representing patterns of gene response as directed graphs makes it possible to visualize how genes respond to all treatment pairs and to identify effectively primary responses and secondary responses of any particular subset of treatments of interest. This work led to the creation of a software package that allows visualization of gene responses and a visual distinction between possibly accurate response patterns (for genes whose replicates are sufficient) and possibly unreliable response patterns (for genes whose replicate maybe insufficient). To the best our knowledge, there has been no similar tool that assists researchers visualize how genes respond to multiple treatments.
mDAG is a web-based software that implements this approach. It allows users to analyze and visualize gene response patterns represented as directed graphs. Genes with same directed-graph response patterns are grouped together and linked to external resources, such as DAVID [7], GeneMANIA [8], and GCAT [9], for functional analyses. The software is configurable as a stand-alone application for individual usage, or as an online service on a server for group usage. At this release, the software assumes microarray data as inputs. Subsequent releases will allow data from other technologies that measure gene expression levels.
2. METHOD
2.1. Response Graphs
Give gene expression data of  treatment groups, each having multiple replicates, significantly differentially expressed genes are selected. Then, each gene is assigned a directed-graph pattern or response graph, in which each vertex represent a treatment group and edges represent how the gene responds to treatment pairs. Edges are de fined by
  statistical tests. Given a pair of vertices
  and
and , a Wilcoxon rank sum test considers replicate data of treatments
  and
and  and determines how the gene responds comparatively to
  and
and . If the gene is expressed statistically significantly higher under
  than
than , then the edge
  is established. Conversely, if the gene is expressed statistically significantly higher under
  than
than , then the edge
  is established. When the test cannot distinguish how the gene responds comparatively to
  and
and , there is no edge between
  and
and  in the graph. Details can be found in [6].
2.2. Assessing Confidence of Observed Patterns
Response graphs capture exactly primary and secondary patterns of gene responses to all treatment pairs. To help users assess confidence in observed patterns, two types of directed graph patterns are identified: contractible and non-contractible. A graph is said to be contractible if and only if non-adjacent vertices are equivalent, in the sense that their incoming vertices are identical and their outgoing vertices are also identical. Figure 1 shows examples of contractible and non-contractible graphs. As shown in [6] and validated in [10], contractible patterns are more likely to be accurate, whereas non-contractible patterns are inaccurate due to having too few samples. Contractible patterns are also more easily interpreted. As an example, genes bearing the pattern shown in Figure 1(B) are unaffected by treatment 3 and down-regulated by treatments 1 and 2; these genes also respond more strongly to treatment 2 compared to treatment 1. Our recent work [5] shows the utility of the contractibility of graphs to make inference about patterns of gene response.

Figure 1. Examples of graph patterns based on control and 3 hypothetical treatments. (A) a non-contractible graph; (B) a contractible graph, which codifies genes unaffected by treatment 3 and down-regulated by treatments 1 and 2.
3. IMPLEMENTATION
mDAG is written in Python, developed based on a web framework known as web2py, and support most popular browsers. For database storage, it can be configured to use SQLite, MySQL, Postgres, or a variety of database management systems. mDAG needs a minimum requirement that includes a pre-installed Python 2.6+ and Graphviz, an open source graph visualization software. It has an own scheduler program to manage requests properly as well as exploit computer resources effectively to perform requests. It can be configured as a stand-alone application for personal usage or installed on a server for group usage.
4. RESULTS
To illustrate the utility of the software, we simulated three sample datasets from a gene expression dataset of rats’ liver tissues [6]. The original dataset includes 12906 genes with control and three treatments and 5 replicates per treatment (including control). The simulated datasets have 8, 10, and 12 treatments (including control), respectively. To be convenient for manipulating with these datasets, we denote control by C and treatments by numbers (1 to 7 for the first, 1 to 9 for the second, and 1 to 11 for the third dataset).
4.1. Recognizing Contractible Patterns
To help users interpret patterns of gene responses, the software distinguishes two types of directed graph patterns: contractible and non-contractible patterns. The reason for differentiating these kinds of patterns is that as shown in [6], contractible patterns are more likely to be true patterns and can be interpreted unambiguously.
For example, consider Figure 2, which shows four sel-

Figure 2. Examples of response graphs: (a) a non-contractible pattern with control and 7 treatments; ((b)-(d)) contractible patterns with control and 7, 9, and 11 treatments, respectively.
ected patterns from an analysis with 8, 71, 7, and 23 genes, respectively. We see that pattern A is non-contractible and patterns B, C, and D are contractible. Non-contractible pattern A is ambiguous in that, for example, genes having this pattern respond indistinguishably to both treatment pairs 3 & 5, and 5 & 2, and yet they respond more to treatment 3 than to treatment 2. On the other hand, contractible pattern B captures precisely how genes respond to all treatments. The response can be unambiguously linearized as follows:  . This means that the 71 genes in pattern B are not affected by treatment 6, and are down-regulated by treatments
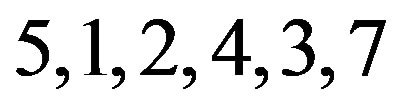 , but more so by treatments
 . Further, these genes respond indistinguishably to treatments 5 & 1, and to treatments 2, 4, 3, & 7. We can similarly and unambiguously interpret contractible patterns C and D.
For user convenience, the software distinguishes contractible and non-contractible patterns. For contractible patterns, the linearized responses are depicted.
4.2. Filtering to Identify Secondary Responses
Users are able to analyze further gene clusters by filtering patterns based on how genes respond specifically to individual treatments: affected or not affected, up-regulated or down-regulated by a treatment. Users can also filter patterns for a group of genes indicated by Probeset IDs, Gene Symbols, UniGene IDs, or Accession Numbers. Figure 3 shows how to filter patterns with gene response criteria (the left side) and how to filter patterns for a group of genes with proper identifiers (the right side).
Additionally, to facilitate gene cluster analyses, patt-

Figure 3. Filtering to identify secondary responses. Left: filtering based on treatment effect: up-regulated, down-regulated, affected, not affected, or any; Right: filtering based on Probset IDs.
erns of gene responses are pre-grouped into meta-clusters. A meta-cluster at k-level can be defined as a group of genes that have k groups of equivalent treatments (that can be one or more treatments). Each meta-cluster can consist of several directed graph patterns. Currently, our software shows first level meta-clusters, which includes all genes that have one group of equivalent treatments. For example, patterns in Figures 2(a) and (b) (see Section 4.1) share the same meta-cluster “< ”. We can also account for up-down responses for meta-clusters, in this case, pattern in Figure 2(b) has the meta-cluster “>
 ”.
”.
4.3. Functional Analyses
Genes sharing same directed-graph patterns hypothetically share similar biological function. To facilitate functional analyses, the software incorporates other tools that are well known for this task. Each cluster of genes with same patterns can be analyzed further via three external well-established tools with quite different approaches DAVID [7], GeneMANIA [8], and GCAT [9]. Figure 4 (the upper part) shows how to use these tools with our software.
Users are also able to link genes in patterns to NCBI resources by using their identifiers such as Probset IDs, Gene Symbols, UniGene IDs, or Accession Numbers. Figure 4 (the lower part) shows how to link to these resources from our software. Tools with well-defined APIs will be continually incorporated into the software. To facilitate subsequence analyses, the software also shows P-value and fold change for each gene. In the future, we will make users be able to set fold change threshold in the software by themselves. In this case, the edge  (
( ) will be established if and only if the gene is expressed statistically significantly higher under
  (
( ) than under
  (
( ), and fold change is higher than the given threshold. Otherwise, there is no edge between
  and
and .
.
5. CONCLUSION
We introduced a novel web-based software to facilitate

Figure 4. Functional analyses of genes with same patterns. Upper: analyzing biological functions of patterns by transferring their gene lists to proper external tools with several options; Lower: checking information of genes in patterns by linking genes to NCBI resources using their identifiers.
comparative gene-expression studies involving multiple treatments. This tool uses directed graphs to represent patterns of gene response to treatments in such a way that these response patterns are descriptive and visually informative. We showed how to use the software to interpret patterns of gene response, filter these patterns to identify secondary responses, and how to perform functional analyses for genes with same patterns. mDAG has features to help users analyze, organize and manage data conveniently and can be easily configured for personal or group usage.
6. ACKNOWLEDGEMENTS
This research is partially supported by the Center for Alternatives to Animal Testing at Johns Hopkins, and RO1 CA39416 grant. We thank Ryan S. Wible, the W. Harry Feinstone Center for Genomic Research, for valuable discussions and Ashutosh Pandey for the initial work on the software. We thank the anonymous reviewers for their insightful comments.
NOTES