Determination of the Biodiesel Content in Petrodiesel/Biodiesel Blends: A Method Based on Uv-Visible Spectroscopy and Chemometrics Tools ()
1. Introduction
Biodiesel is a renewable fuel comprised of mono-alkyl esters and obtained from the transesterification of vegetable oils or animal fat in the presence of a catalyst. The use of biodiesel is increasing given that it is made into motor fuel by mixing with petrodiesel [1]. The current and most used mixtures are: 2%, 3%, 5%, 10%, 15% and 20% biodiesel, which are denoted as B2, B3, B5, B10, B15 and B20, respectively. Biodiesel use helps to reduce fossil fuel consumption and decrease pollution, primarily carbon dioxide emission [2].
Generally, the quality control of fuels is performed by highly specialized analytical techniques, such as gas or liquid chromatography [3,4] for which the equipment and reagents are expensive. These techniques are destructive and emit pollutants into the environment. Additionally, these analyses are expensive and time-consuming.
It is therefore necessary to develop efficient, fast economical and environmentally friendly analytical techniques. Spectrometric techniques and chemometrics tools are useful for this purpose. Infrared spectroscopy and multivariate analysis [5-8] have been used in predictive models to determine the biodiesel concentrations present in petrodiesel-biodiesel blends. The fluorescence spectroscopy [9,10], the nuclear magnetic resonance [11] and the UV-visible spectroscopy [8,12,13] have also been used for the same purposes.
Due to the use of biodiesel-petrodiesel blends worldwide and the potential of palm oil for use in the manufacture of biodiesel, the aim of this study was to build predictive models for the determination of the concentration of biodiesel from African palm present in mixtures of petrodiesel using UV-visible spectral fingerprints and chemometrics techniques.
2. Experimental
2.1. Reagents and Chemicals
Methanol and sodium hydroxide reagent grade from Fermont were used for the synthesis of biodiesel. Crude African palm oil commercial grade was donated from AGROIPSA S.A. of Tabasco, México. The petrodiesel was acquired from a Petróleos Mexicanos (PEMEX) certified franchise.
2.2. Apparatus
The transesterification reaction was performed in a 1 L, spherical glass flask. The flask was equipped with a straight condenser to prevent the leakage of methanol vapors. A digital Scientific Thomas thermometer (±0.01˚C) with a platinum sensor was used for the measurement of the reaction temperature. The reagents were mixed by magnetic stirring and the temperature was manually controlled with a Barnstead-Electrothermal (BI) heating mantle.
2.3. UV-visible
The petrodiesel/biodiesel blends were analyzed using a Perkin-Elmer B050-7805 spectrophotometer. The software Lambda 10 (UV Win Lab) served as an interface between the computer and the spectrophotometer. The samples were placed in a 0.5 cm wide square quartz cell. A tungsten lamp was employed for the analysis in the visible region and a deuterium lamp was used for the UV region. The analysis of the samples was performed at a temperature of 25˚C. The spectra were collected over the range from 200 - 1100 nm, and 32 scans were performed for each sample, with a resolution of 2 nm. The numerical data from the acquired spectra were exported into Microsoft Excel 2007® and subsequently exported to the Piruette V. 4.5 software by Infometrix for the chemometrics analysis.
2.4. Procedure
2.4.1. Synthesis of Biodiesel
The crude African palm oil (CPO) was weighed into a 500 mL Erlenmeyer flask and transferred to the batch reactor. The catalyst was prepared by reacting anhydrous methanol (1:12 oil/methanol) with sodium hydroxide (2% wt/wt, based on the weight of the oil) into another 500 mL Erlenmeyer flask, and the mixture was stirred until the hydroxide was completely dissolved. The catalyst was added into the reactor that contained the CPO. The mixture was heated to 60˚C, and the reaction was maintained at atmospheric pressure for 150 min. The biodiesel was poured into a separatory funnel and washed with deionized water, after the methyl esters was poured into a distillation flask and distilled at 100˚C to remove the excess methanol and water. To remove trace contaminants, biodiesel was refined through a glass column packed with 100 g of Amberlite BD10DRY ionic resin. The biodiesel was packed in amber bottles and was maintained under refrigeration at 5˚C for later use. No sediment was formed during storage time.
2.4.2. Preparation of the Samples
To construct the predictive model, seventy-five samples that contained mixtures of biodiesel from African palm and petrodiesel at concentrations ranging between 0 to 100 wt% were prepared. A total of sixty-five samples were used for the construction of the calibration models.
2.4.3. Construction of the PLS model
The spectral fingerprint data of 65 samples were used for the construction of the PLS predictive model, were in the interval between 325 to 900 nm (Figure 1). Each spectrum consists of 286 variables, creating a matrix of size 65 × 286, with a total of 18,590 variables. To construct the PLS regression models, a central mean pretreatment and normalization were applied to the spectral fingerprint data. The standard error of calibration (SEC) was used to characterize the prediction capacity of the created model. The standard error of validation (SEV) was used to check the predictive model accuracy. To determine the robustness, the model were built by cross-validation was using “leave one out cross-validation” and “leave five out cross-validation” data. The predictive abilities of the model were evaluated through external validation, using a set of ten biodiesel-petrodiesel blends prepared in the laboratory, and not involved on the construction of the calibration model.
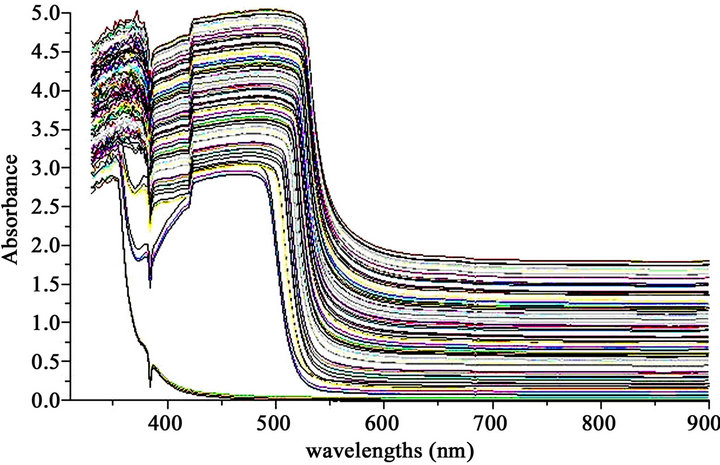
Figure 1. Spectra in the visible region of the petrodieselbiodiesel blends used for the construction of the predictive models.
3. Results and Discussion
3.1. Interpretation of the Spectra
The biodiesel spectrum has absorbance bands in the wavelength range between 400 to 550 nm of the visible region Figure 1. These bands are attributed to energy absorption by the double bond in unsaturated carbonyl compounds [8], because energy absorption in this type of organic compounds is based on transitions of n and π electrons to π* excited state. These transitions require a functional group with unsaturated bonds for the π orbital contribution [14]. The spectrum of the blends petrodiesel/biodiesel has multiple absorbance bands in the wavelength range between 200 to 235 nm in the UV region, these bands the may be related to the presence of aromatic compounds that contain unsaturated double bonds in its molecular structure [9].
3.2. Analysis of the PLS Model
The PLS predictive model with six principal components explained 99.8% of the variance. The low (SEC) and (SEV) values for the calibration model obtained by PLS regression indicate that the model has a high predictive ability. The values of both correlation coefficients of calibration (r Cal) and correlation coefficients validation (r Val) are close to unity, indicating a high correlation between the actual biodiesel concentrations and the biodiesel concentrations predicted by the model. The predictive R2 that was obtained by cross-validation indicates high accuracy of the PLS model predicting values for new observations Table 1.
The similarity criterion value (SEC/SEV) was determined to be between 0.5 and 1, indicating a good fit of the model based on previously reported criteria [15].
The regression line of the PLS model in Figure 2 and Figure 3 shows that the intercept and slope are close to zero and unity, respectively, indicating low systematic error for the regression. This result was confirmed by the low value of the bias. The cross-validation in both cases shows that the PLS model is robust because given that the statistical parameters used for the corresponding assessment were good (Table 1).
The predictive capacity of the PLS model was also assessed using the paired data Student’s t-test, where the values of the actual biodiesel concentrations and the concentrations predicted by the model were compared.
The t values (tcal) were calculated using the equations proposed by [16] and compared with tabulated values using 64 degrees of freedom and a significance level α = 0.05. The tcal value = 0.1204 was lower than the ttab value = 1.668; therefore, it is concluded, with a 95% certainty, that the predicted biodiesel concentrations are not significantly different from the actual biodiesel concentrations.
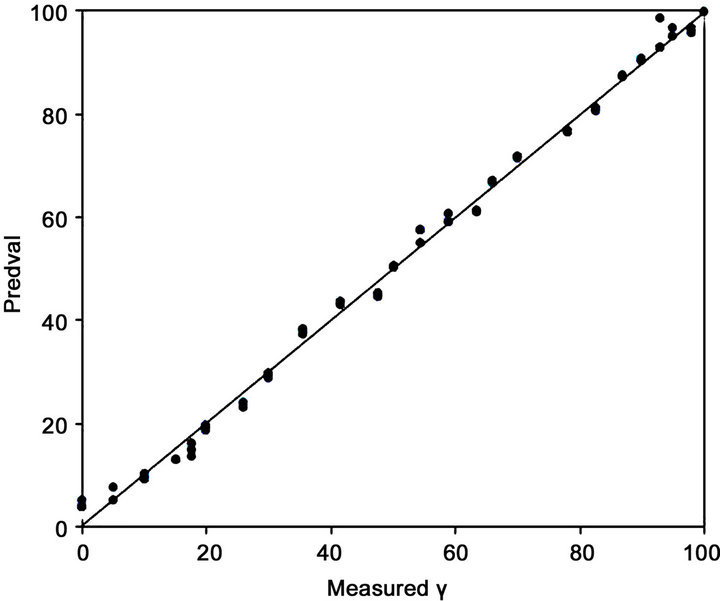
Figure 2. Calibration plots obtained for the PLS regression model using leave-one-out cross-validation.
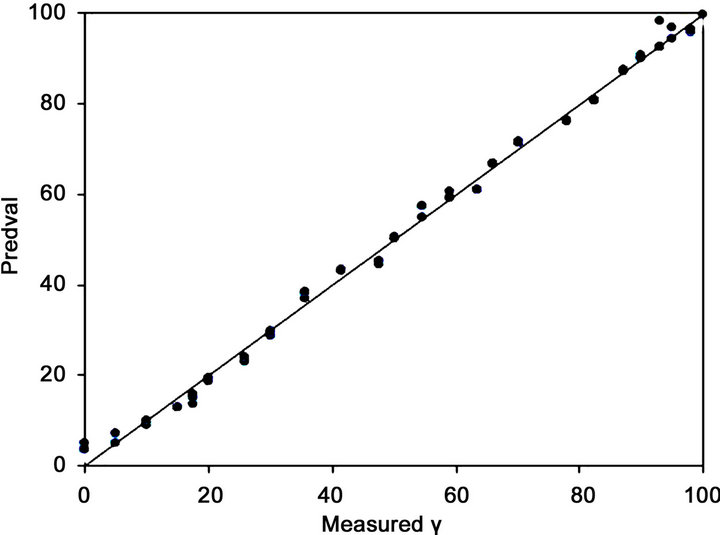
Figure 3. Calibration plots obtained for the PLS regression model using leave-five-out cross-validation.

Table 1. Comparison of the statistical parameters values used to assess the predictive capacity of the models.
4. Conclusion
The predictive PLS model constructed in this study from the spectral fingerprints of the visible region of the electromagnetic spectrum is a practical analytical method that can be used to predict the concentration of biodiesel from African palm in petrodiesel blends across the full range of possible concentration by weight. The technique has the advantage of being rapid, efficient, economical and environmentally friendly when compared to conventional chemical methods.
5. Acknowledgements
We thank the PROMEP project, PROMEP/103.5/09 4363, and the Research Line 3 of Alternate Energy and Biomaterials of Colegio de Postgraduados, for the funds to develop the present project.
NOTES