Assessment of the Direct Sun-Light on Rural Road Network through Solar Radiation Analysis Using GIS ()
1. Introduction
Solar radiation is made up of electromagnetic waves which travel from the sun to the earth with the speed of light. The quantity of short wave radiant energy emitted by the sun passing through a unit horizontal area in unit time is referred generally as global solar radiation. This incoming solar radiation is modified as it travels through the atmosphere and again once it hits the surface. So the three main components of solar radiation are the direct, the diffused and the reflected solar radiation (Figure 1).
Direct radiation is intercepted unimpeded, in a direct line from the sun. Diffuse radiation is scattered by atmospheric constituents, such as clouds and dust. Reflected radiation is reflected from surface features [1].
This global solar radiation can be used in predictions of various phenomena. Thus, solar radiation modeling can be a useful tool for the design of building energy systems, solar energy systems and a good estimate of the thermal environment within buildings [2,3]. Furthermore, solar radiation modeling can be used in Earth Sciences as a climatic element and as a key in biological processes [4] in the field of agriculture and forestry [5]. In this current work, solar radiation is computed within ArcGIS environment using the corresponding tool (The Solar Radiation Tool of the Spatial Analyst Tools). The solar radiation tools can perform calculations for a specific point or for a given surface (e.g. for a DEM) within ArcGIS.
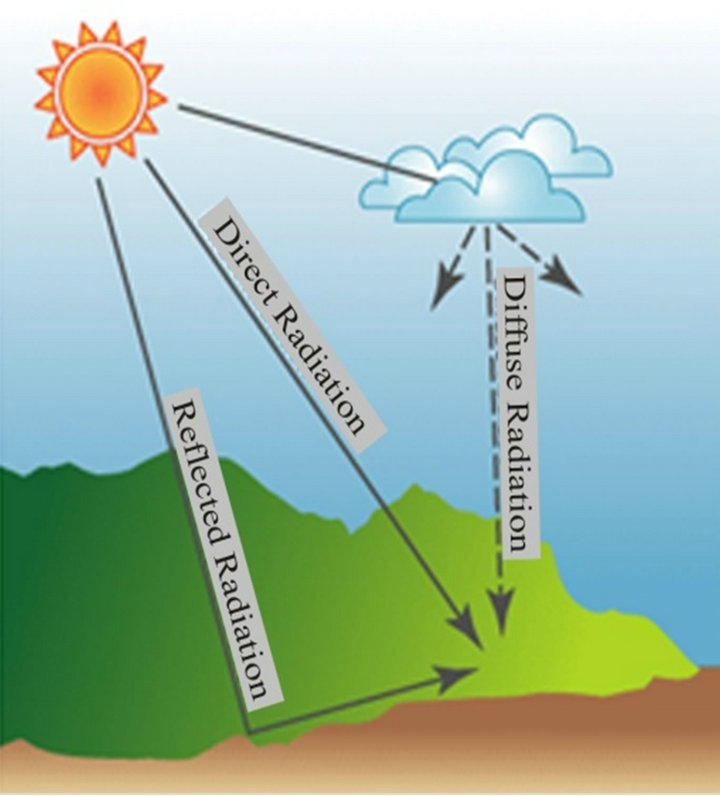
Figure 1. The three main components of solar radiation [1].
It is generally accepted that the use of GIS can be a very valuable tool in modeling various phenomena. GIS incorporates all the available material that technology offers. So hardware, software and databases are combined towards the extraction of new knowledge. They give the possibility to have fast results throughout the process, which extends from the data management to the analysis and the visualization of them [2]. This is a technology that is constantly evolving and which enables users to edit high volume of data. It is also a technology that provides the ability to analyze complex spatiotemporal phenomena.
Most scientists now have adopted GIS to analyze and visualize the derived results. Thus, there are a lot of developed applications for sciences such as business, education, natural resources and natural disasters, mapping, health services, public safety, transportation, urban planning, built of environment (environmental engineering), forestry, agriculture etc [3,6-8].
Thus, GIS offers the ability for applications in many different fields of science such as urban planning, hydrology, archeology, epidemiology, monitoring changes in land use, etc. [9-12]. This technology provides the necessary facilities to the users in order to perform various simulations towards having quick and reliable results. These results may be a key element for solving complex spatial problems and a decision tool for policy makers. At the same time, a GIS based spatial decision support system (SDSS) is a powerful modeling framework for decision makers in order to analyze and simulate various spatial phenomena [13,14].
GIS is also a technology that provides well-organized possibilities for the analysis of phenomena which are variable in space and time. In this current work, an aspect of road accident risk is evaluated in terms of the exposure to direct sunlight. This is a spatiotemporal phenomenon due to the continuous change of the position of the sun and the motion of a vehicle on a road. Road risk accident analysis may concern the study of accidents that had already occurred in an area and the study of risk factors which can be directly related to the occurrence of accidents [15-17]. Actually, this is part of the public health approach. This approach is not only helpful in the analysis of a specific risk factor in transportations, but also provides a framework for decision-making throughout its entire process, from identifying a problem to implementing an intervention [18-20].
Moreover, road risk analysis can identify high crash zones either between vehicles or in accidents which involve pedestrians [21]. A potential outcome of the proposed analysis is the prevention of accidents in rural road network. Therefore, risk analysis can be followed during a road network planning by considering spatial and thematic data [22].
In this study, GIS is used in order to simulate the exposure to direct sun light in a rural road network. The main goal was to provide a system which can identify the parts of the road that are in risk for a specific time period due to direct sunlight. When a vehicle is moving towards the direction of the sun and at the same time the sun altitude is low in comparison with road gradient, drivers may experience temporary visual defects which are a common accident triggering factor [23].
The phenomenon of the exposure to direct sunlight on a road segment is not static. The position of the sun and the moving vehicle are changing from time to time and from space to space. Thus, this exposure is a spatiotemporal phenomenon and should be handled accordingly [24].
To the best of our knowledge, there are many studies that use GIS in road risk assessment. However, studies related to the proposed analysis or similar analyzes [25] are limited. The main part of these studies explore the frequency of occurrence of accidents based on specific factors [26], while others use GIS as a tool for visualization of accident data and analysis of hot spots in highways [27,28].
The first part of this work refers to the physical process of the sun movement through the estimation of solar radiation for a specific time in the study area. Next, this is applied on the spatial data structures (DEM and road network) in order to isolate the road segments that are in risk due to the exposure to direct sunlight.
2. Data
In order to conduct the modeling a set of initial data was necessary. The original data used in this work can be divided into two main categories.
2.1. Spatial Data
The essential needed data for this current methodology is a Digital Elevation Model (DEM) of the study area. The presence of a full DEM would be the ideal case for the analysis. That is a 3D model in which the buildings within urban areas, the artificial barriers (e.g. bridges) and the trees next to the roads will appear in the correct position and with the correct geometry characteristics. The lack of this ideal situation led to the adoption of a model that is easier to manufacture. For the purpose of this work a Digital Terrain Model (DTM) was created within ArcGIS 9.3 environment using the ANUDEM algorithm [29,30]. This DTM was derived from the digitization of contour lines (contour line interval: 20 m), elevation/trigonometric points and the stream network (the source of the topographic maps was the Hellenic Military Geographical Service-HMGS). The result of this procedure was a 3D terrain model of 20 × 20 m spatial resolution.
To conduct the analysis at road segment level, it was necessary to import a route from the road network of the study area. The layer of the road network was digitized from the analog topographical map of Hellenic Military Geographical Service. Then an update was held by using GPS on the field. Furthermore, a last check was conducted on Google maps.
2.2. Sun Position Data
Data reflecting sun position during a specific time period were taken from the astronomical server of the United States Naval Observatory (USNO) [31]. These data provide information about the solar altitude and azimuth angles. Altitude of the sun is the angle above the horizon while azimuth corresponds to the direction of the sun measured clockwise from the North. Both altitude and azimuth are measured in decimal degrees. The input parameters required for the calculation of sun position are geographical coordinates (Lat, Lon) of the study area, the date and the time interval [7].
Table 1 illustrates the data concerning the position of the sun over the route duration from 08:15 am to 08:27 am for July 20, 2012 (time interval: 1 minute). At this time period the altitude of the sun is less than 30˚ and more roads segments are exposed to direct sunlight.