1. Introduction
Cobalt has no natural deposit as its mine; and all nickel deposits contain invariably small proportion of cobalt. In order to obtain purified nickel and to isolate cobalt, it is necessary to separate Co(II) from Ni(II). The Co2+/Ni2+ separation is a challenge to hydrometallurgists, who extract nickel following 1) leaching of ores, 2) purification of leach solution and 3) either reduction by hydrogen or electrolysis of purified solution. The purification of leach solution by solvent extraction is complicated by the difficult separation of Co2+ from Ni2+.
Previously, organo-phosphorous extractants like D2EHPA [1-10], Cyanex 272 [1-6,11-16], EHEHPA or PC 88A [1-5,17,18], M2EHPA [9], TBP [2,8,9], Cyanex 301 [4,7,11,16,19-21] and Cyanex 302 [4,7,11,14], TOPS 99 [12,22], TIBPS [22], etc. have been used for Ni2+/Co2+ separation. A few works [2-4,7,17,19] are available on extraction equilibrium of Ni2+. Recently, the extraction equilibrium of Ni2+ in the Ni2+- -Ac– (Na+, H+)-Cyanex 272-kerosene-3% (v/v) n-octan-1-ol system (where, 3% (v/v) n-octan-1-ol in a de-emulsifier) has been reported from Authors’ Laboratory [23]. The chemical structure of the active component of Cyanex 272 is [11]:

It is reported that equilibration time is only 2 min; and

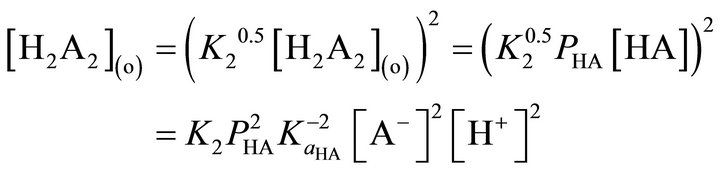
when, [H2A2](o,eq) ≤ 0.05 mol/L and
when, [H2A2](o,eq) ³ 0.10 mol/L. These equations have suggested, respectively, the extraction equilibrium reactions as:  and
and .
.
Although the kinetics of Ni2+ extraction by non-phosphorous based extractants [24-28], have been reported, there is no report on the extraction kinetics of Ni2+ by organophosphorous extractants except the works of Dresinger and Cooper [29,30] who have used either D2EHPA or EHEHPA as extractant and RDC as the flux measurement technique. As there no report on the extraction kinetics of Ni2+ by Cyanex 272, this study has been carried out. In this study, the single drop technique for F (of Ni2+-transfer)-measurement has been used.
2. Materials and Methods
2.1. Reagents
Cyanex 272 (Cytec Canada Inc.) was purified by the micro-emulsion formation method [31] to 99% BTMPPA (potentiometric titration), and characterized by its density (0.9152 g/mL at 298 K) and viscosity (120 mN/m at 298 K) [32]. Aliphatic colorless kerosene distilling over 200˚C - 260˚C was used as diluent. NiSO4·6H2O (Fluka, >99%) was used as a source of Ni2+. Other chemicals were of reagent grade and used as received.
2.2. Analytical
The [Ni2+] in the aqueous phase was determined by the bromine-dimethylglyoxime method [33] at 445 nm using a WPA S104 Spectrophotometer and occasionally by the AAS method using a Shimadzu AA-6800 Spectrophotometer, especially when its concentration was low. The stock solution of Ni2+ was prepared by dissolving 22.39 g NiSO4∙6H2O in water to make 1 L solution and standardized by EDTA-titration. The solution was found to contain 4.99 g/L Ni2+. The acidity of the aqueous solutions was measured by a Mettler Toledo MP 220 pH meter on calibration by double buffers of pH 4 and 7.
2.3. Procedure with the Single Drop Apparatus
The construction of single drop apparatus is described elsewhere [34]. Its schematic diagram is in Figure 1. A falling drop apparatus was used. In the experiment, the continuum was the organic phase and drops of aqueous solution were allowed to fall through the continuum and collected continuously from the bottom of the column, leaving a pool of ca 2 - 3 drops of aqueous phase to avoid entrainment. For each experiment, the volume of 100 collected drops was estimated by the density-mass method; so that the volume of a single drop could be calculated. In the actual experiments, an uncounted
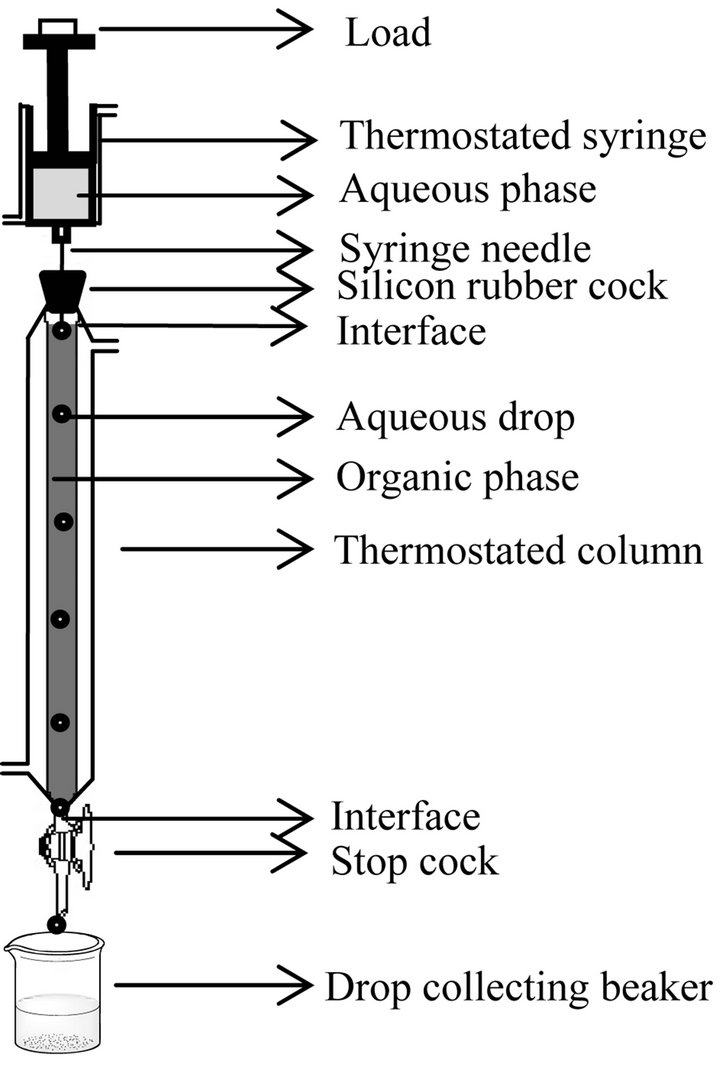
Figure 1. A schematic diagram of a single (falling) drop apparatus. Distance between two interfaces represent C.H. Thermostatic water circulation is aided by water circulating pump.
number of aqueous drops (internally circulating and slightly oscillating) of diameter (1.81 ± 0.03) mm were allowed to fall, collected in a previously weighed dry beaker and the volume of the collected aqueous phase (ca 2.5 mL) was determined by the density-mass method. The [Ni2+] in the collected mass was then estimated. On knowing the volume of a drop (determined previously), the number of drops in actual experiment could be determined. The cumulative time for 10 separate drops falling one after another was determined to get the average drop fall time, which was mostly dependent of column height and only slightly dependent on the composition of phases.
2.4. Theory of Rate Measurements by Flux (F)-Method
At a particular temperature, (F) of Ni2+ transfer can be represented as [35]:
 (1)
(1)
The quantity, F, at a constant temperature is related to the concentration terms as:
 (2)
(2)
where, the unit of (kf) depends on the values of a, b, c, d and e. Equation (2) can be rewritten as:
 (3)
(3)
Equation (3) states that if pH, [H2A2],  and [Ac−] are kept constant at pH, [H2A2],
  and [Ac−], respectively; and (F)-values are determined for various concentrations of [Ni2+], then the plot of log(F) vs log [Ni2+] will be a straight line with s = 1 and
 .
.
From I-value, (kf) can be calculated after determining the values of b, c, d and e. Similarly, the values of b, c, d and e together with four sets of (kf)-values can be determined from the log(F) vs pH, log(F) vs log[H2A2](o), log(F) vs log and log(F) vs log[Ac‒] plots, respectively. The temperature dependence data can be treated by Arrhenius equation and Activated complex theory [36].
3. Results and Discussion
3.1. Characterization of Rate Measurement by Single Drop Experimentation
The plot of  from a drop vs t (obtained by using different C.H) [37] is a straight line which cuts the time axis at −0.5 s (Dt = 0.5 s). This time is designated as end correction term (attributed to time for drop formation and coalescence). In F-calculation, Dt term must be added to t; otherwise, error appears as demonstrated below:
When  and Ff are calculated by neglecting and considering Dt value, respectively, then it is seen that log
  is decreased, whilst log Ff remains unchanged with increasing C.H and at any C.H,
  [37]. It is concluded that F will be independent of C.H if Dt is added to t; and any C.H. can be used if Ff (not
 ) is calculated.
3.2. Rate Measurements
The log(Ff, kmol/m2∙s) vs log([Ni2+], kmol/m3) plots are displayed in Figure 2. In all cases, straight lines are obtained with s = (1.01 ± 0.03) and I as typed on the body of figure. The unity s indicates that the rate of forward extraction of Ni2+ by Cyanex 272 is directly proportional to initial [Ni2+]. In other words, the reaction order wrt [Ni2+](ini) is unity (i.e., a = 1).
The logFf vs pH(ini) plots are shown in Figure 3 The experimental points for a particular system fall on a curve having higher slope in lpHr and lower slope in hpHr. The experimental points for a particular set of parameters fall on curve represented by:
 (4)
(4)
where, constant = −6.382 (for 0.025 mol/L [H2A2](o,ini) system), −6.062 (for 0.10 mol/L [H2A2](o,ini) system) or,
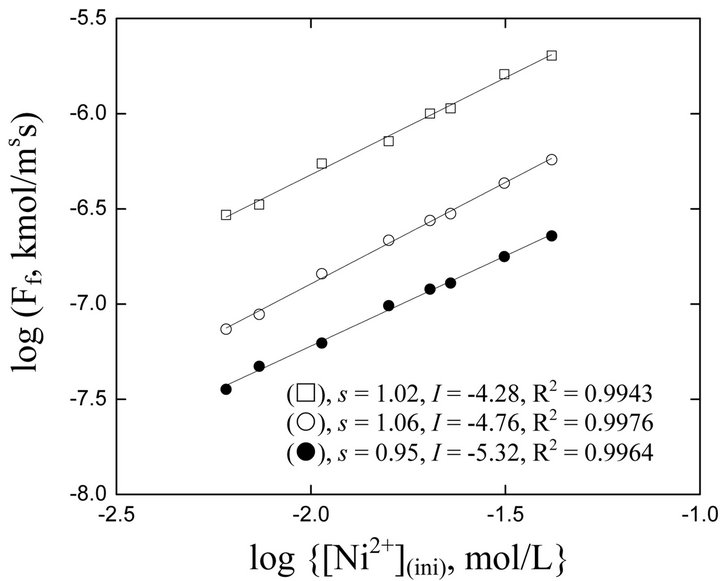
Figure 2. Effect of [Ni(II)](ini) on flux [Ac−] = 0.25 mol/L, Temp. = 303 K,  = 0.042 mol/L, C.H = 0.66 m. (), pH(ini) = 6.70, [H2A2](o,ini) = 0.025 mol/L; (), pH(ini) = 6.00, [H2A2](o,ini) = 0.025 mol/L; (£), pH(ini) = 6.70, [H2A2](o,ini) = 0.30 mol/L.

Figure 3. Effect of pH(ini) on flux. [Ni2+](ini) = 1.3405 g/L,  = 0.05 mol/L, C.H = 1.2/0.9/0.66 m. (), [H2A2](o,ini) = 0.025 mol/L; (), [H2A2](o,ini) = 0.10 mol/L; (£), [H2A2](o,ini) = 0.30 mol/L. Other parameters are as in Figure 2.
−5.80 (for 0.30 mol/L [H2A2](o,ini) system) and 106.32 is a proportionality constant resulting from non-linear curve fitting. Its unit is L/mol. I-values of the asymptotic lines are embodied in figure. It is concluded that the rate of Ni2+ extraction is independent of [H+] in lpHr; whereas, inversely proportional to [H+] in hpHr. In other words, the reaction order wrt [H+] is −1 (b = 1) and 0 (b = 0) in lpHr and hpHr, respectively.
Figure 4 displays logFf vs log[H2A2](o,ini) plots. For each pH system, the plot is a straight line whose s and I are given. The s-values indicate that the rate of forward extraction is directly proportional to the square root of the extractant concentration (i.e., c = 0.5).
The nature and extent of variations of Ff with  are displayed in Figure 5. The experimental points for a particular set of parameters fall on a curve represented by:
 (5)
(5)
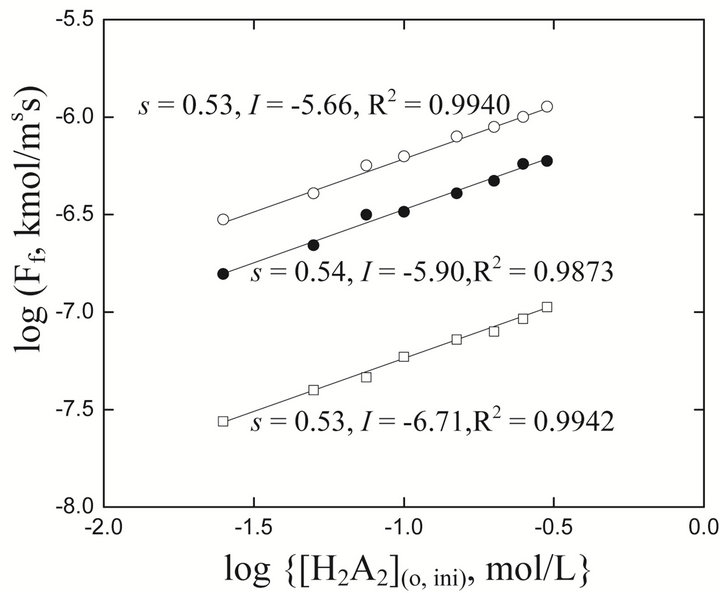
Figure 4. Effect of extractant concentration on flux [Ni2+](ini) = 1.3405 g/L,  = 0.05 mol/L. (), pH(ini) = 6.70, C.H = 0.66 m; (), pH(ini) = 6.10, C.H = 0.90 m; (£), pH(ini) = 5.20, C.H = 1.20 m. Other parameters are as in Figure 2.
where, constant = −6.4 (for pH(ini)= 6.70, [H2A2](o,ini) = 0.025 mol/L system) or, −5.95 (for pH(ini) = 6.40, [H2A2](o,ini) = 0.30 mol/L system); and 6.30 is a proportionality constant resulted fromnon-linear curve-fitting and its unit is considered as L/mol. The intercepts of the asymptotic lines are given in figure. The rate of Ni2+ transfer is therefore inversely proportional to the term . This means that d is 0 at lcr of
  and −1 at hcr of
 .
.
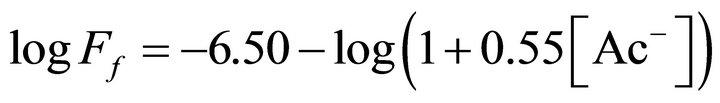
The log(Ff, kmol/m2 s) vs log[Ac−], mol/L) plot for pH(ini) = 6.60 and [H2A2](o,ini) = 0.025 mol/L is represented in Figure 6. Experimental points fall on a curve represented by:
 (6)
(6)
where, 0.55 L/mol is proportionality constant whose value is originated from non-linear regression analysis. I-values of the asymptotic lines are quoted. The rate of Ni2+ transfer is therefore inversely proportional to the term (1 + 0.55 [Ac−]). In other words, e = 0 at lcr of [Ac−] and e = −1 at hcr of [Ac−].
The logFf vs 1/T (Arrhenius) plots for 5-sets of experimental parameters are depicted in Figure 7. From top

Figure 7. Effect of temperature on flux (Arrhenius plots) [Ni2+](ini) = 1.3405 g/L. (), pH(ini) = 6.70, [H2A2](o,ini) = 0.10 mol/L, [Ac−] = 0.25 mol/L,  = 0.05 mol/L, C.H = 0.66 m; (), pH(ini) = 5.20, [H2A2](o,ini) = 0.10 mol/L, [Ac−] = 0.25 mol/L,
  = 0.05 mol/L, C.H = 1.2 m; (£), pH(ini) = 6.70, [H2A2](o,ini) = 0.10 mol/L, [Ac−] = 0.25 mol/L,
  = 1.00 mol/L, C.H = 1.2 m; (¢), pH(ini) = 6.60, [H2A2](o,ini) = 0.30 mol/L, [Ac−] = 2.00 mol/L,
  = 0.023 mol/L, C.H = 1.2 m; (r), pH(ini) = 6.70, [H2A2](o,ini) = 0.10 mol/L, [Ac−] = 2.00 mol/L,
  = 1.0 mol/L, C.H = 1.2 m.
to bottom, 1st, 4th and 5th systems yield straight lines and s of these lines give Ea values of 19, 56 and 17 kJ/mol, respectively. On the other hand, for the 2nd and 3rd systems, curves are obtained. From limiting s of the curves, Ea values of 25.5 kJ/mol and 57.5 kJ/mol are obtained at htr and ltr, respectively for the 3rd system; whereas, 27.5 kJ/mol and 62.0 kJ/mol are obtained at htr and ltr respectively, for the 2nd system.
The temperature dependence rate data have also been treated by the Activated Complex Theory to estimate the DH± and DS±. The plots of log (Ffh/kT) vs (1/T) are given in Figure 8. Natures of plots are similar to those of Arrhenius plots. The “s”, “I”, DH± and DS± values are embodied in the figure. In calculating DS± values, logf(R)- values are needed which are calculated using the relation:
 (7)
(7)
The calculated DH± value varies within 17 - 65 kJ/mol; whereas, DS± values are always negative.
3.3. Elucidation of the Value of kf
From “I” of the straight lines or the asymptotic lines in Figures 2-6, the average value of logkf at 303 K in presence of 3% (v/v) octan-1-ol in the organic phase has been evaluated to be −3.742, with stand. dev. of 0.04. The

Figure 8. The log{(Ffh/kT), kmol/m2s} vs (1/T) plots. Legends are as in Figure 8. (), logf(R) = −2.4679; (), logf(R) = −3.2299; (£), logf(R) = −2.9834; (¢), logf(R) = −2.4682; (r), logf(R) = −3.4670.
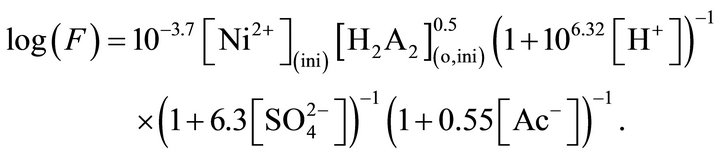
value of logkf has also been obtained graphically. As the flux equation can be represented as: logFf = logkf + logf(R), the plot of logFf vs logf(R) should be a straight line with s = 1 and I equaling to the value of logkf. The plot is given in Figure 9. A good fit Least Squares straight line is obtained with s = 1.0288 (should be 1) and I = −3.6781. The latter value corresponding to log kf is comparable to that obtained above. Hereafter, kf = 10−3.7 m5/2/kmol1/2∙s will be considered in discussion.
3.4. Mechanism of Forward Extraction
Based on the results obtained, F in this system at 303 K can be expressed as:
 (8)
(8)
Equation (8) is a too much complicated equation. It can be changed to a number of simplified flux equations depending on the concentration regions of H+,  and Ac−. Here, following two extreme cases will be considered for discussion:
1) At hcr of H+, but lcr of  and Ac‒
 (9)
(9)
where, 10‒10.02 = 10‒3.7 ´ 10‒6.32; and 2) At lcr of H+ but hcr of  and Ac‒
 (10)
(10)
where, 10‒4.24 = 10‒3.7/6.3 ´ 0.55.
In the present case, as the reaction order wrt extractant concentration is a one-half, the monomeric model of extractant will be applicable [35]. The monomeric model of H2A2 is:
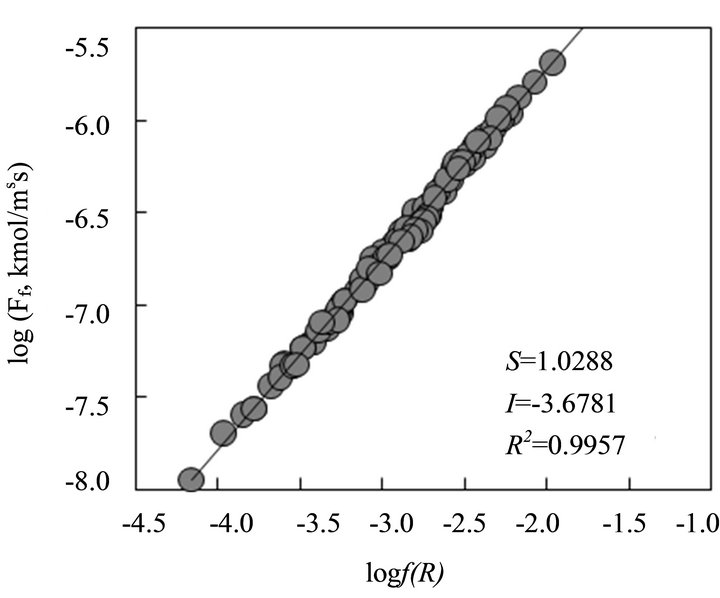
Figure 9. The logFf vs logf(R) plot at 303 K.
 (11)
(11)
Combination of Equation (9) with Equation (11) yields the flux equation as:
 (12)
(12)
Equation (12) gives the slow reaction step occurring in the bulk aqueous phase as:
 (13)
(13)
In this experimental parametric condition, Ni2+ extraction by Cyanex 272 is therefore chemically controlled and this statement is supported by high Ea (56 kJ/mol) obtained at the investigated hcr of H+ (pH = 5) and lcr of  (0.05 mol/L) and Ac‒ (0.25 mol/L).
The chemically controlled rate-determining step: 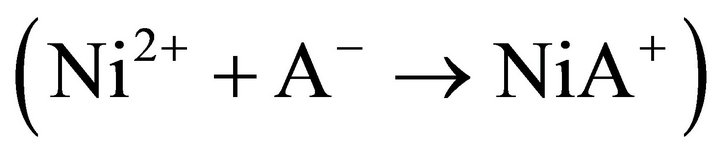 may occur either by an SN1 or SN2 mechanism [38]. For SN2 mechanism, the bimolecular reaction step may be shown as:
 (14)
(14)
with the rate expression :
 (15)
(15)
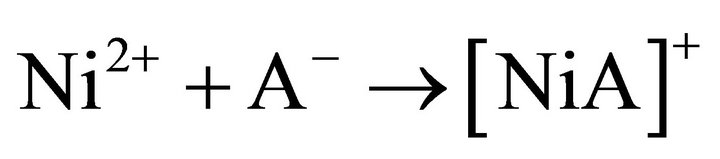
Equation (15) is identical to Equation (12). Consequently in an SN2 mechanism, the attachment of an additional ligand (A‒) to the restricted co-ordination sphere of Ni2+ acts as the rate determining step. The other is the SN1 mechanism which a unimolecular process as follows:
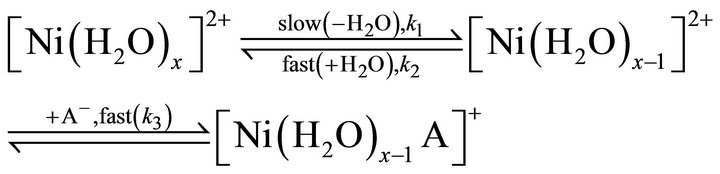 (16)
(16)
The steady state approximation results the rate expression for the SN1 mechanism as:
 (17)
(17)
and if , then the Equation (17) takes form of Equation (15); whereby (k1k3/k2) will represent kf.
Thus, it is possible to explain the same rate data by both SN1 and SN2 mechanisms; and as a result, it is difficult to decide whether the reaction proceeds via Equation (14) or (16). But this difficulty may effectively be overcome by the use of the thermodynamic data of the activated state, especially the (DS±) data for the system.
The solution effect dominates the entropy of activation where charged ions are involved. If the solvent molecules are tightly attached around Ni2+ ions, their entropy is lost i.e. DS± becomes negative. On the other hand, if the solvent molecules dissociate from the metal ions, their entropy is increased; and so, DS± becomes positive. Thus for an SN2 mechanism, where the ligand (A‒) co-ordinates to the metal ion, [Ni(H2O)x]2+ to form the higher co-ordinated activated complex, [Ni(H2O)x∙A]+, the value of DS± would be expected to be more negative than the ground state. But for the SN1 mechanism, where the formation of lower co-ordinated activated complex, [Ni(H2O)x‒1]2+ takes place, DS± should be positive. In the present case, DS± at all experimental parameters are highly negative; and so the rate controlling chemical reaction step represented by Equation (13) occurs via an SN2 mechanism.
On the other hand, at lcr of H+ but hcr of  and Ac‒, the existing Ni2+ species may be considered as [Ni(OH)(SO4)(Ac‒)]2‒. So Equation (10) takes the form:
 (18)
(18)
And with the help of b1 and b2, Equation (18) takes the form:
 (19)
(19)
Monomeric model of H2A2(o) i.e. Equation (11) transforms Equation (19) to
 (20)
(20)
This equation suggests the rate controlling extraction reaction step given in Equation (13) is also the rate determining chemical reaction step in the latter set of condition. But Ea of 17 kJ/mol obtained at lcr of [H+] (i.e. high pH: 6.7) and hcr of  (1 mol/L) and Ac‒ (2 mol/L) suggests that the diffusion of a reactant to the reaction site or the product from the reaction site to the bulk organic phase is slower than the reaction step given in Equation (13).
Thus depending on the extraction condition, the Ni2+ extraction in the present system by Cyanex 272 may be either 1) pure chemical controlled (at low pH,  and [Ac‒]) or 2) pure diffusion controlled (at high pH,
  and [Ac‒]) or 3) mixed (intermediate) controlled. In most of the cases (moderate pH and/or,
  and/or [Ac‒]) at 303 K, the process is mixed controlled which may be chemically controlled at ltr and diffusion controlled at htr.
4. Conclusions
The end effect in the single drop experimentation is 0.50 s and this time is needed to be summed up with drop fall time to calculate F of independent C.H. At 303 K, the empirical flux equation is:
Ea and DH± values depend on experimental condition and are found to vary within 17 - 58 kJ/mol and 17 - 67 kJ/mol. DS± value is always negative. At low pH,  and [Ac‒], the process is under chemical control; whereas, at high pH,
  and [Ac‒], the process is under diffusion control. But in most cases, the process is under intermediate control; which may be chemically controlled at ltr and diffusion controlled at htr. The rate determining chemical reaction step is identified as the formation of 1:1 complex between Ni2+ and anion (A‒) of the dimeric extractant. Moreover, negative DS± value indicates that the chemical rate determining step occurs through an SN2 mechanism.
List of Symbols and Abbreviations Used
a, b, c, d, e: Reaction orders w.r.t [Ni2+], [H+], [H2A2](o),  & [Ac−], respectively
 : Amount of Ni2+ transferred, kmol b1: Stability constant of NiOH+: [NiOH+] [H+]/ [Ni2+]
b2: Stability constant of NiOHSO4Ac2−: [[NiOHSO4Ac]2−]/[NiOH+] [Ac−]
[Ac−]
C.H: Column (better to say continuum) height, m D[Ni2+]: Concentration change in aqueous drop during travel, mg/L Dt: End correction term, s
[]: Sign of concentration A−: Anion of monomeric BTMPPA Ac−: Acetate ion BTMPPA, H2A2: Dimeric bis(2,4,4-trimethylpentyl)phosphinic acid DH±: Enthalpy change in activation, kJ/mol DS±: Entropy change in activation, kJ/mol K Ea: Activation energy, kJ/mol F: Ni2+ Transfer flux, kmol/m2∙s f(R): Function of reactants h: Planck’s constant (6.625 ´ 10−37 kJ∙s)
hcr: High concentration region hpHr: High pH region htr: High temperature region HA: Monomer of BTMPPA I: Intercept k: Boltzman constant (1.38 ´ 10−26 kJ/K)
 : Ionization constant of HA, kmol/m3
K2: Dimerization constant of BTMPPA, m3/kmol kf: Rate constant in forward extraction, m5/2/kmol1/2∙s lcr: Low concentration region lpHr: Low pH region ltr: Low temperature region N: Number of collected drop PHA: Distribution constant or partition coefficient of HA RDC: Rotating diffusion cell s: Slope SN2: Substitution nucleophilic bimolecular mechanism SN1: Substitution nucleophilic unimolecular mechanism t: Drop fall time, s T: Temperature, K v: Volume of collected drop, cm3
wrt: With respect to Subscript f: Forward
(ini): Initial
(int): Interface
(o): Organic
NOTES