A Novel Approach for Groundwater Budgeting Using GIS in a Part of Pondicherry Region, India ()
1. Introduction
Groundwater is one of the most important and scarce commodity. Groundwater exists in the geological formations through which it can penetrate, be transmitted and stored beneath the surface. When the rate of infiltration is sufficient and the rocks are saturated to an appreciable thickness, then the groundwater becomes usable enough to yield useful supplies of water to wells, springs and stream. At present nearly 1/5th of all the water used in the world are obtained from the groundwater. Land use/ land cover pattern of Pondicherry and its surroundings were studied by using IRS 1C LISS III data [1]. The land use/land cover patterns were visually interpreted and digitized using ERDAS IMAGINE software. The study observed that agriculture area (52.89%) is dominant in Pondicherry and its surroundings, followed by settlement with vegetation (18.35%). The dependency of groundwater for the agricultural purpose has considerably increased in the recent past. Nearly about 80% of groundwater is used for agriculture. The quantification of the groundwater resources has become essential for water management. There are differebt methods for assessing the rate of recharge e.g., by using stable isotope, tracer techniques, groundwater modeling (thangarajan et al.) etc. Aquifer recharge studies using different isotopes for determination of infiltration capacities, permeability and in delineation of aquifer, inter connection were studied by several authors [2-10]. An Indicator based model was described to assess and quantify the significance of vulnerability to salt water intrusion due to excessive groundwater withdrawal and also to analyze the impact of artificial recharge in minimizing the salt water intrusion for coastal aquifers [11]. A detailed study on the Pondicherry groundwater was also done by National Geophysical Research Institute Hyderabad [12] to estimate the areas of over exploitation and to derive water balance using geo-hydrological data. Groundwater utilization for agricultural intensification in the Pondicherry region was studied by CGWB [13]. A detailed study was also carried out by the State Groundwater Unit of Agriculture Department, Pondicherry [14] to augment the available groundwater resource. Since the available methods are sophisticated, time consuming and costly an alternate method for the assessment of groundwater recharge and discharge was attempted by using the available groundwater level and GIS technique. Visualization is a convenient and effective way to communicate complex information. Greater importance is being put on data visualization today, GIS is a leading technology in this movement. It has tremendous potential to affect a wide variety of fields in present day. Hence, an attempt has been made in this study to handle GIS technique for groundwater budgeting in this shallow alluvial aquifer of Pondicherry region using water level data.
2. Study Area
The study area is located 28 km in the North West part of Pondicherry region, it lies between latitudes of 110 50'N to 120 59'N and longitude of 700 35'E to700 45'E (Figure 1). The study area falls in the survey of Indian top sheets of 58 M/10. It geographically covers an extent of nearly 85 Sq.km. Groundwater of the study area occurs in alluvial aquifer under un-confined to semi-confined condition. The depth of the tube wells tapping this aquifer ranges between 25 m and 50 m bgl (below ground level). The average annual fluctuation is around 7.50 m. The studies [15] indicate that the transmissivity values of the aquifers is 275.4 m2/d at Madukarai in the west and is 770 m2/d at Thirukanji in the east.
2.1. Geology
The results of the shallow drilling in north of Pondicherry [16,17] reveals the geology of the region. Later the Central Groundwater Board, Governement of India [18] brought out a detailed report on the groundwater survey and exploration in the Union Territory of Pondicherry. In general the geology of Pondicherry region ranges from Archean to recent alluvium. The recent formation in the region is represented by Laterite and alluvium,

Figure 1. Location map of the study area.
Laterite occurs as thin cap over the Cuddalore formation. Thickalluvial deposits are built up along the course of Pennaiar and Gingee rivers. The study area falls in this region and is completely covered by alluvium.
3. Methodology
Water level data for the past 14 years were observed and the study was conducted for a period of three years (2000-2002).
3.1. Discharge
In the year 2000 the monthly water level data was studied and the minimum drawdown level of groundwater was noted. This is taken as the initial reading (IL). Similarly, in the simultaneous year (2001) the maximum drawdown level of groundwater is noted (DL). The difference between this two groundwater levels gives the discharge in region (IL~DL), using this phenomenon difference in water level was calculated for the different location in the study area. The rate of discharge (DR) can be calculated by the difference between the initial water level (IL) and maximum drawdown level (DL) divided by the time taken for discharge (DT).
3.2 Recharge
In the year 2001, the maximum drawdown level of groundwater level (DL) was noted and the subsequent rise in monthly water level was noted till the deviation of water level decrease was identified. This level of risen water table (RL) is the recharge level. The difference between this two groundwater levels gives the recharge (R). The time taken for the recharge water level from the maximum draw down level can be calculated (RT). The rates and recharge (RR) is given by,


The study pertains to a part of Pondicherry region covered by unconfined aquifers in alluvial formation. The water level data for the three years were analyzed as per the methodology mentioned above.
3.3. GIS
Map info (Ver.7.8) GIS software along with Vertical Mapper was used to spatially distribute the water level data in order to locate the region of maximum discharge and recharge. The rate of recharge and discharge were also calculated and spatially plotted on the map. GIS helps to approximately calculate the area of recharge and discharge falling in different contour intervals.
4. Result and Discussion
The initial (shallow) and maximum (deeper) water levels for each location were identified (Table 1). The shallow water table was identified during February in most of the locations. Similarly, the maximum draw down (DD) level was noted during the period of September. The maximum discharge (Table 1) was noted at the Kodukkur region, it lies in the northern part of the study area. The rate of the discharge is 13.97 m in 7 months, i.e., about 1.99 m/month. In general the subsurface water flow is from the north to the south, more over there are number of agricultural fields located in this region and the main crop cultivated is paddy. The alluvial plain here is generally a monotonous with slope ranging from 1m to 3 m. The lands in this plain are intensively cultivated throughout the year. The minimum discharge was noted at the V. Nerkunam region it is located in the eastern part of study area, the discharge rate is 0.69 m in 7 months, i.e., about 0.098 m/month. The average discharge level of the study area is 6 m and the average rate of discharge is 0.45 m. The maximum time taken for the discharge in the study area is 19 months. Assessment of groundwater resources of Pondicherry region by Sukhija [19] estimated the groundwater inputs and annual recharge is due to rainfall, return flow from agricultural fields, seepage from tanks, canals and groundwater in-flow. The general overview of groundwater and the water level changes were discussed in the CGWB report [20]. Besides the rivers and major canals, there are depressions acting as storage tanks which are spread all over the terrain to serve as surface water reservoirs.
From the recharge status (Table 2) of the study area, the maximum recharge is noted at the Kodukkur region, it lies in the northern part of the study area. The recharge is 14.19 m for the particular year and the rate of recharge is 1.18/month., the minimum recharge is noted at the Sompet region, it is located in the western part of the study area. The recharge of this region is about 0.4 m for four months; the rate of recharge is 0.10 m/month. A study of the distribution of rainfall reveals (Pethaperuaml 2008) that there is a decrease in the rainfall from east to west, about 1300 mm near the coast to 1100 mm in the west. The average recharge level is 2.6 m, in the Vampupet, Kalitheampattu and Rajaputhrapallayam region. The average rate of recharge of the study area is 0.58 m/ month. The northern part of the study area shows high rate of recharge due to three reasons; 1) agricultural return flow; 2) direct recharge from the river Gingee and 3) flow of groundwater from the adjacent areas.
4.1. Spatial Distribution of Discharge
Initially the difference between the shallow and deeper water level of the study area helps to identify the discharge level. A contour map (Figure 2) was derived out for this discharge level data (Table 3), depicting three categories of discharge as maximum, minimum and moderate. All categories discussed in this paper are in order to differentiat the available data. The contour interval ranging form 10.69 m to 13.97 m indicates maximum discharge region in the study area, which falls near Kodukkur, the spatial extent of this maximum discharge covers 1.79 sq.km. The contour interval ranging from 0.69m to 5.69 m, indicates minimum discharge regions in the study area, with a spatial extent of 51.22 sq.km. The medium discharge level was identified to have a spatial extent of 31.99 sq.km lying between contours 5.69–10.69 m.
4.1.1. Spatial Distribution of Rate of Discharge
The contour map for rate of discharge (Figure 3) shows four different categories (Table 4) of which the very high discharge rate is noted in Kodukkur covering an area of about 1.28 sq.km. The low discharge rate covers about 90% of the study area with a spatial extent of about

Table 1. Discharge status by using relative water level (2000–2001).

Table 2. Recharge status by using relative water level (2001–2002).

Table 3. Area occupied by difference rang of for discharge level relative water level.

Table 4. Area occupied by different ranges of for rate of discharge relative water level.

Figure 2. Contour map of discharge water level.
73.43 sq.km. The rate of discharge of the remaining part of the study area falls in medium (0.59-1.09 m/month) and high (1.09-1.59 m/month) category.
4.2. Spatial Distribution of Recharge
Difference between the maximum and minimum water level (Water Level Difference) helps to find the recharge. By using the recharge level data (Table 5) a contour map

Figure 3. Contour map for rate of discharge.
was drawn (Figure 4) with three different categories as low, medium and high recharge. The high recharge was again noted at Kodukkur, it lies between 10.20-14.18 m contour. It is interesting to note that both high discharge and recharge are noted in the same region. Kodukkur region is dominated by groundwater dependent irrigation system for paddy cultivation. Hence higher rate of discharge is noted in this region but since the area is an alluvial terrain with good porosity the agricultural return
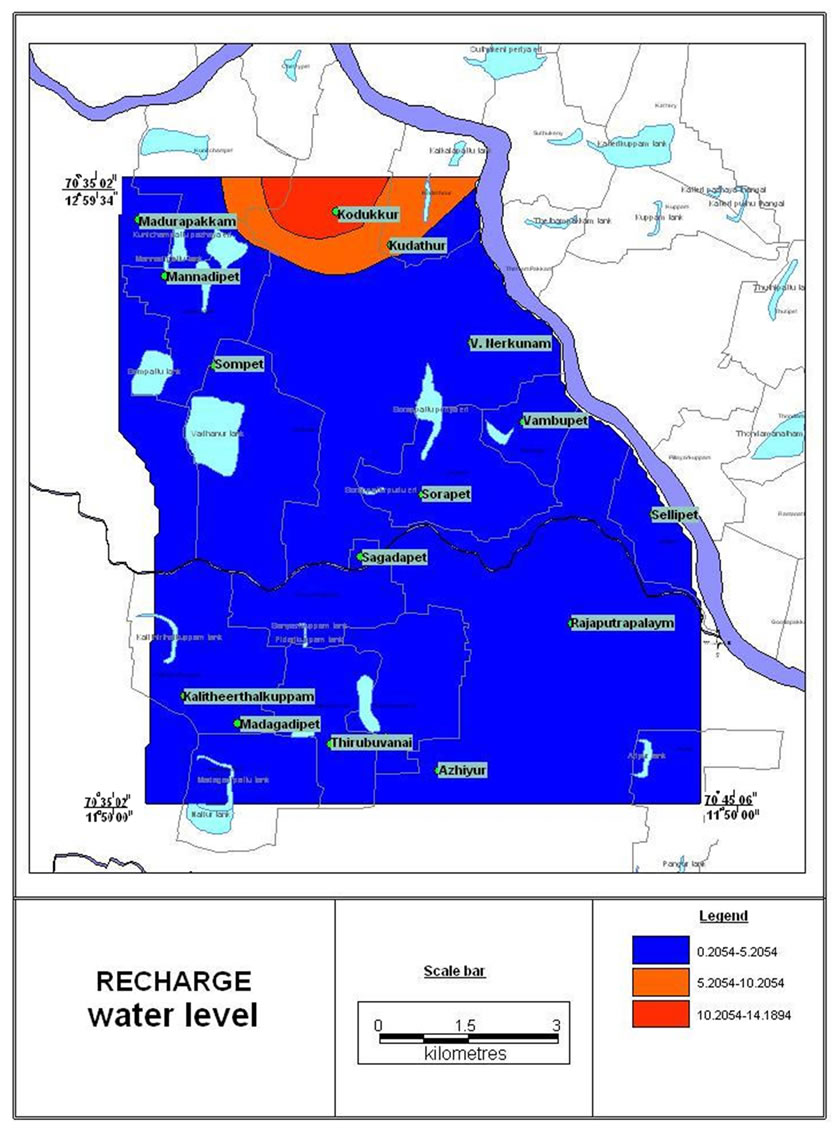
Figure 4. Map for recharged water level.

Table 5. Area occupied by different ranges of for recharge level relative water level (2002).
flow enhances the rate of recharge in this region. The spatial extent of this high recharge is 1.68 sq.km, the low recharge (Table 5) the study area falls between 0.20 to 5.20 m category, which covers an area of about 80.91 sq.km. The rest is occupied by the medium recharge region.
4.2.1. Spatial Distribution of Rate of Recharge
The calculated recharge rate was spatially plotted on a contour map (Figure 5) with six different categories (Table 6) like excellent, very good, good, moderate, poor and very poor. The Excellent recharge rate range between 2.54 m/month and 2.72 m/month. This is noted in Kodukkur and Sorapet villages, covering an area of 0.71 sq.km. Similarly, the Very poor recharge rate was found near Sompet, K. Kuppum, V. Nerkunam, Sagadapet and Rajaputra palayam villages, ranging between 0.041 m/month and 0.54 m/month which cover an area of 44.13 sq.km. The poor category ranges between 0.54

Table 6. Area occupied by different ranges of for rate of recharge relative water level.
m/month and 1.04 m/month covering an area of 28.24 sq.km. Rest of the area falls in, moderate (1.04–1.0 m/ month), good (1.54-2.04 m/month) and very good (2.04 –2.54 m/month) categories. The average rate of recharge in the study area is 1.38 m/month.
4.3. Volume Estimation
Based on the recharge and discharge contour maps, the mid point of the each contour range is multiplied with area lying between the contours, to derive the volume of the recharge/discharge area. This is in turn multiplied by the porosity of the formation (alluvium) to obtain the storage capacity of aquifer. If the porosity of the region is assumed to be 15%, the amount of water withdrawn is 67208.30 × 103 m3 and the quantity of water recharged is 39374.26 × 103 m3 .The rate of recharge was noticed to be higher in centre part of the study area at Sorapet.
The study shows that water level increases during monsoon period and decreases during post monsoon and summer. The discharge period is about 19 months on an average and the recharge is observed for a lesser interval of 5 month during the study period. Hence, it is noted that the duration of discharge is higher that the recharge. The estimated recharge volume also proves that the volume of the water recharged is almost half of the volume of discharge.
5. Conclusions
The variation in water level helps us to identify the difference in groundwater potential. The above study facilitates to spatially identify the regions with high discharge and good recharge. It also brings out the rate of recharge and discharge and therby to discriminate the regions with the above function. The study also reveals that the discharge and recharge is higher a one specific location which is mainly due to agricultural extraction and return flow respectively. This study also reveals a fact the though both the process takes place simultaneously in nature, there can be specific demarcation of period for discharge and recharge dominance. The discharge is noted for a longer period than the recharge is for a shorter period due the lesser availability of water. The spatial extent of the results will help the water managers to provide scientific solutions for the resource. So, the volume of the extraction and recharge in a particular area with the aid of GIS reduces the adhoc experimentation and this method is also less expensive. Hence the monthly water level data of a region along with GIS software can assist in evolving the maximum recharge and discharge regions along with the volume of the water recharged or discharged in a specific area.
6. Acknowledgements
The authors wish to express thank to the state groundwater unit and soil conservation, Pondicherry, BRNS for the financial support, and staff members in Department of Earth Sciences, Annamalai University for their cooperation.