Theoretical Interpretation of the Existence at 40℃ of an Absolute Maximum of the Hydration Rate of Calcium Sulphate Hemi Hydrate under Microwave Irradiation ()
1. Introduction
Our work on the hydration study of calcium hemi-hydrate under microwave irradiation [1,2], shows that the time tm, corresponding to the maximum of the thermal flow  in the hydration reaction changes with the hydration test temperature (between 10˚C and 40˚C). A limit of tm beyond the temperature of 40˚C appears that differs from the results obtained by conventional heating [3,4].
The hydration phenomenon of calcium sulphate hemi hydrate to gypsum is based on two simultaneous processes [5]:
Dissolution: hemi-hydrate + water → solution Re-crystallization: solution → dehydrate In isothermal mode [6], the hydration reaction itself, of  moles, of hemi hydrate, cannot provide more than
  moles of dehydrate,
  being the number of calcium sulphate moles in the balanced solution with the formed gypsum at the end of reaction at that temperature.
 with 0 < αG <1 (1)
αG: global rate of the hemi hydrate conversion into gypsum.
NG: represents the number of the formed gypsum moles at time t.
Therefore, we can define the dissolution rate  of hemi hydrate by taking for reference at the origin of time, the solution saturated by
  calcium sulphate moles in equilibrium with
  moles of hemi hydrate at the same temperature.
 (2)
(2)
NSH: represents the number of moles of hemi hydrate not yet dissolved at time t.
Conservation of the number of calcium sulphate moles under all their forms can be written:

ND: represents the numbers of calcium sulphate moles in the solution at time t.
By derivation versus time, the conservation relation will be the following:
where:

As: 
Therefore finally we can write:
 (3)
(3)
2. Theoretical Interpretation
The hydration curve on Figure 1 presents two parts:
Let us consider the first part where,
 (4)
(4)
In that case, equality of rates dissolution 
and crystallization  can generally be found in literature under the name of “stationary state approximation”. That enables us to use for this part the maximum rate equation of the gypsum formation reaction established by [7]:
 with
with 
 : represents the dissolved salt concentration at the maximum rate of dissolution.
 : represents the saturation concentration of salt that crystallises at temperature T (at the end of hydration reaction).
k: rate constant that depends on temperature.
p: represents the bi-dimensional nature of crystallization n: generally the whole number.
αmax: maximum global rate of gypsum conversion (not temperature dependant).
The maximum rate depends on temperature only through

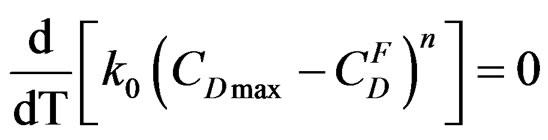
The existence of an absolute maximum of the maximum rate Vmax at temperature Tmax is given by:

Figure 1. Variation of tm of hydration under microwave irradiation of β calcium hemi hydrate with temperature.
Let us assume that k follows the Arrhenius law:
k = k0 exp ( ) where EC is the apparent activetion energy of the crystallisation reaction [8] and k0 a factor independent of temperature T. Figure 2 shows the experimental curves.
According to the shape of the experimental curves of the calcium sulphate concentration variation in solution and those of the reaction rate versus time.
We have:

 where:
  Referring to the hemi hydrate and gypsum solubility curves “Figure 3” [9], it appears that
  is practically independent on the temperature compared with
 , the variation of which can be expressed for temperatures between 20˚C and 80˚C, as:
 (6)
(6)
 is comparable to an apparent dissolution heat of hemi hydrate under a pressure of one atmosphere.
CaSO4 (mol·l–1·102)


Figure 2. Curve 1: Variation of the concentration of calcium sulphate in the aqueous solution with time during hydration; Curve 2: Variation of the corresponding thermal flow with time.

Figure 3. Solubility curves of calcium sulphates in water.
This enthalpy variation is supposed to depend only very little on temperature in the range of 20˚C to 80˚C.
 = –34903 J.mole–1
We have:

Let us take: ; Q is independent of temperature T.
Solubility curves of calcium sulphate in water are given on Figure 3.
Let us consider the second part of the curve where,
 (7)
(7)
Conductivity measurements curves are given on Figure 4.
The curves evidence that the diminution rate of the ions solution  and
and  concentration under microwaves is higher than that obtained at the same temperature under conventional heating (the curve slopes obtained under microwaves are more significant). This shows a higher value of crystallization rate [10,11].
We can write therefore that:

and:
 (8)
(8)
 is an empirical function that expressed the variation of
  versus temperature.
This relationship cannot be verified for higher temperatures than 80˚C because of the hemi-hydrate formation α taking ever place in an aqueous solution.
The variation rate of  decreases accordingly to the temperature, therefore the differential will be:
 is negative and

Figure 4. Electrical resistance evolution of solution versus time during the calcium sulphate hemi-hydrate hydration reaction (T = 50˚C). Curve 1: conventional heating; Curve 2: microwave heating.


After derivation ; finally we get the following relationship between EC and T corresponding to the limit temperature of 40˚C.

 (9)
(9)

From the experimental curves, we can get  (T)= tm (T) and determine the following parameters ℓ and g by solving the two equations with two unknown factors by the numerical method.

 (10)
(10)
T1 and T2 are two temperature’s values corresponding to each part of the curve where the crystallization rate  is maximum (level on the curve).
From that we find: ℓ = 0.9 and γ = 0.052.
And finally EC = n 19269.8 J.mole–1.
With this crystallization rate equation similar to that we formerly used, one generally takes n = 1 for a diffusion steered process and n = 2 for a process steered by the solid to water interaction.
Therefore we get for a diffusion process: EC = 19269.8 J·mole–1.
And for a non-diffusion process:
EC = 38539.6 J·mole–1.
3. Conclusion
The kinetic model proposed shows that the apparent activation energy of the crystallization reaction obtained under microwave irradiation is lower than that of the same reaction obtained in a conventional way. We found in fact about 30 kJ.mole–1 for the hydration reaction which has been carried out under microwave irradiation at 40˚C instead of 50 kJ.mole–1 under a conventional heating. This will explain the higher rate observed for the hydration reaction carried out under microwave irradiation as well as the increasing number of germination sites producing a great number of crystals getting a clear difference in the structure of hydration products.