1. Introduction
Diabetes mellitus (DM) is a disorder in which blood sugar levels are abnormally high because either absolute or relative insulin deficiency. The levels of sugar in the body vary normally throughout the day. They rise after a meal and return to normal within about 2 hours after eating. In type 1 diabetes (IDDM), more than 90% of the insulin-producing cells of the pancreas are permanently destroyed. Only about 10% of all people with DM have type 1 disease. Most people who have type 1 DM develop the disease before age of 30. In type 2 diabetes (NIDDM), the pancreas continues to produce insulin, sometimes even at higher than normal levels. However, the body develops resistance to the effects of insulin, so there is not enough insulin to meet the body’s needs. Type 2 DM may occur in children and adolescents, but usually begins in people older than 30 years and becomes progressively more common with age. About 15% of people older than 70 years have type 2 DM. Certain racial and cultural groups are at increased risk of developing type 2 DM. Type 2 DM tend to run in families. Obesity is the chief risk factor for developing type 2 DM and 80% - 90% of people with this disease are obese. Certain diseases and drugs are known to affect the body uses insulin and can lead to type 2 DM. High levels of corticosteroids and pregnancy are the most common causes of altered insulin use. [1]
Treatment of diabetes involves diet, exercise, education and for most people, drugs. If a person with DM keeps blood sugar levels tightly controlled, complications are less likely to develop. Oral antidiabetic drugs and/or insulin doses may be affected by co-administration of many drugs including aspirin. Dose adjustments may be necessary. Potentiation of oral antidiabetic agents may be caused partially by displacement from serum proteins. Glipizide & gliburide, because of their non-ionic binding characteristics, may not be affected as much as other oral agents; however caution in concomitant use is recommended [1].
The pain killer effect of aspirin is best known for its effects on the two cyclooxygenase enzymes (COX1 & COX2), but, recently, aspirin could specifically inhibit the protein I-kappa-B-kinase beta (IKK-beta). This kinase is used for its role in the cascade of signals that activate the nuclear factor kappa-b (NF-kappa-B) family of cellular genes which regulate inflammatory and immune responses. Now, it turns out that IKK-beta also works in another pathway to contribute to insulin resistance by interfering with insulin signaling [1-7].
Insulin resistance is a primary factor in the development of type 2 diabetes, Yuan et al. hypothesized that IKKβ is a key downstream mediator in this process and demonstrated that high doses of salicylates, inhibit IKKβ activity [8], reversed hyperglycemia, hyperinsulinemia, and dyslipidemia in obese rodents by sensitizing insulin signaling [9]. Evidence that these effects were mediated by salicylate inhibition of IKKβ activity, as opposed to inhibition of cyclooxygenases, was obtained by demonstrating that heterozygous deletion of IKKβ protected mice against the development of insulin resistance during high-fat feeding or lipid infusion [9]. However, the effects of aspirin in patients with type 2 diabetes are less clear. While early studies suggested a neutral effect of aspirin on glucose metabolism in diabetic patients [10-15], more recent clinical trials have demonstrated a detrimental effect of aspirin therapy on insulin sensitivity [16-18]. Important differences between these studies focused on aspirin doses. Lower aspirin dosages (<3 g/d) and therapeutic duration (a few days) in the more recent studies show different effects on blood glucose levels than in the earlier studies (6 - 9 g/d for 1 - 3 weeks). In view of the recent rodent data demonstrating a potentially important role of IKKβ in mediating insulin resistance and the ability of (high-dose) salicylate to inhibit IKKβ activity, we decided to examine the role of different doses of aspirin (low, moderate and high) in experimentally induced diabetic rats.
2. Materials and Methods
2.1. Induction of DM and Measurement of Blood Glucose Level
DMin rats were induced by administration of nicotinamide (NAD) (230 mg/kg, i.p.), 15 min prior to the single dose of streptozotocin (STZ) (65 mg/kg, i.p.) [19,20]. Control animals were received an equal volume of saline. The STZ solution contained STZ in saline with a sodium citrate buffer, pH 4.0. The blood glucose levels (by using standard diagnostic kits) were recorded to monitor the degree of diabetes.
2.2. Groups
Ninety male albino rats (150 - 200 g for each rat) were used in this study. They will be divided into 6 main groups. The first was served as control which receives no medications. The second group was diabetic induced rats as mentioned above. The third group was controlled by insulin after induction of D.M., the dose of which was decided according to blood glucose level and weight of each rat. The first three groups consist of 10 rats each. Groups from the fourth to the six consist of 20 diabetic induced rats and further subdivided as follows:
Group IV:
GIV a: consists of 10 rats that received low dose aspirin orally (100 mg/kg/day) for 14 days.
GIV b: consists of 10 rats that received low dose aspirin orally (100 mg/kg/day) for 14 days and insulin.
Group V:
GV a: consists of 10 rats that receive moderate dose aspirin orally (300 mg/kg/day) for 14 days.
GV b: consists of 10 rats that received moderate dose aspirin orally (300 mg/kg/day) for 14 days and insulin.
Group VI:
GVI a: consists of 10 rats that received high dose aspirin orally (600 mg/kg/day) for 14 days.
GVI b: consists of 10 rats that received high dose aspirin orally (600 mg/kg/day) for 14 days and insulin.
The dose of insulin was calculated according to the weight of the rat and the blood glucose level.
2.3. Parameters
At the end of the protocol, overnight fasting blood samples were collected from the rat tail of each of the 6 groups and the following parameters were measured:
1) Fasting blood sugar level (FBS).
2) Glycosylated hemoglobin (HBA1c).
3) Total serum proteins.
4) C-peptide.
5) Lipid profile.
6) C-reactive proteins.
2.4. Statistical Analysis
Data analysis was performed using SPSS software, version 16. All results are expressed as means ± SD. Difference between the experimental groups were evaluated by Kruskal-Wallis, followed by the Mann-Whitney test (for significant variables), for multiple comparisons on ranks. The ranks of the data rather than their values were used to calculate the statistic. Data were ranked by ordering them from lowest to highest and assigning them, in order, the integer values from 1 to the sample size. Ties were resolved by assigning tied values the mean of the ranks they would have received if there were no ties. Accordingly, the mean rank score was calculated for each group by dividing the sum of the ranks by the sample size of that group. Differences were considered statistically significant with P values < 0.05.
3. Results
3.1. Fasting Blood Sugar (FBS, mg/dl)
Tables 1(a), (b) and Figure 1 showed that diabetic rats or that received aspirin in different doses have significant higher FBS levels than that of normal non-diabetic rats or diabetic rats treated with insulin (P < 0.001). Moderate and high dose aspirin (MDA & HDA) significantly reduced FBS compared to diabetic rats (P < 0.05).
Tables 1(a), (b) and Figure 2 showed that diabetic rats treated with insulin still showed a significant higher FBS level than that of normal non-diabetic group (P < 0.001).

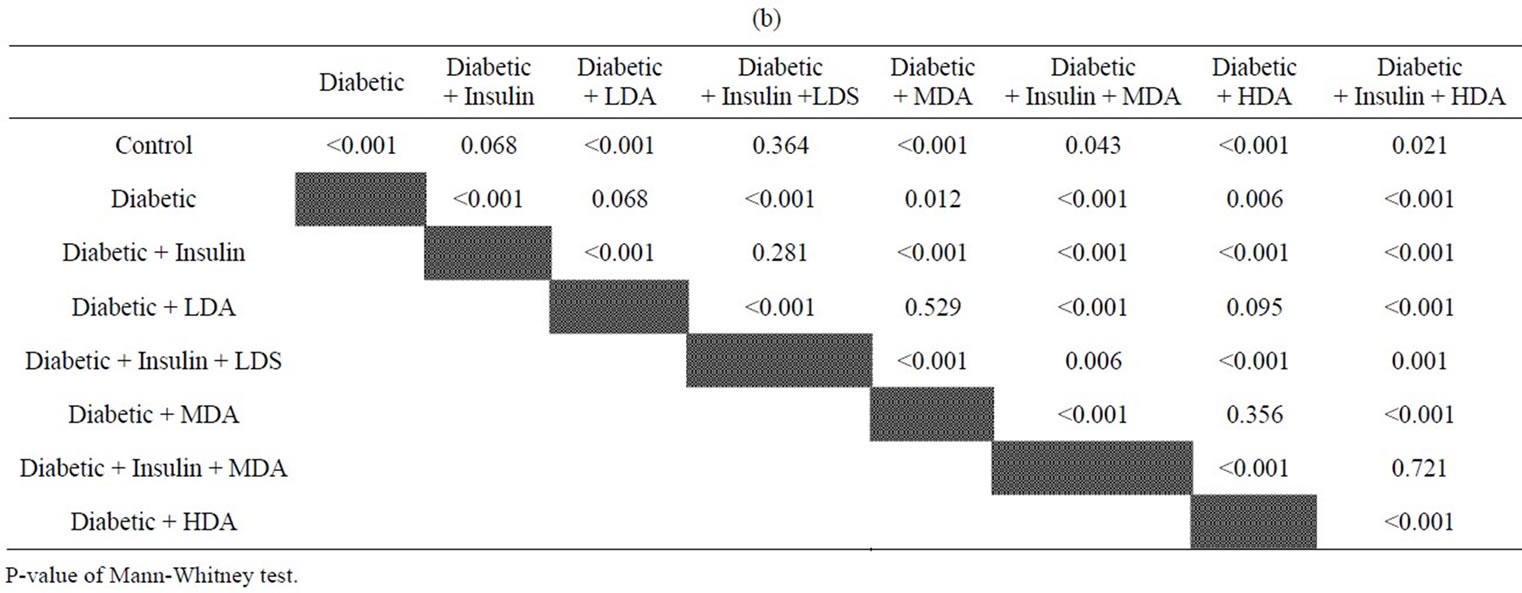
Table 1. (a) Comparison of fasting blood glucose level (mg/dl) between experimental groups; (b) Comparison between compared groups of experimental rates regarding fasting blood glucose level.

Figure 1. Fasting Blood Sugar Level in normal and diabetic rats with or without administration of insulin or aspirin in different doses. * = As compared to Normal Rats (NR); # = As compared to Diabetic Rats (DR); @ = As compared to Diabetic Rats treated with insulin (DR + Ins); NR = Normal Rats; DR = Diabetic Rats; DR + Ins = Diabetic rats treated with insulin; DR + LDA, MDA & HDA = Diabetic rats given low, moderate & high dose aspirin.

Figure 2. Fasting Blood Sugar Level in normal and diabetic rats without or with administration of insulin alone or insulin and different doses of aspirin. * = As compared to Normal Rats (Normal R); # = As compared to Diabetic Rats (DR); @ = As compared to Diabetic Rats treated with insulin or insulin and LDA (DR + Ins & DR + Ins + LDA); NR = Normal Rats; DR = Diabetic Rats (DR); DR + Ins = Diabetic Rats treated with insulin; DR + Ins + LDA, MDA & HAD = Diabetic rats treated with insulin and given low, moderate & high dose aspirin.
MDA & HDA in treated diabetic rats with insulin resulted in significant reduction of FBS levels as compared to treated diabetic rats with insulin only (P <0.001) or that treated with insulin and given LDA (P < 0.05 & 0.001 respectively).
3.2. HemoglobinA1c% (Glycosylated Hemoglobin%)
Tables 2(a), (b) and Figure 3 showed that HBA1c% of diabetic rats or that treated either with insulin or different doses of aspirin (without insulin) were still higher significantly than that of normal non-diabetic rats (P < 0.001 for DR, <0.05 for DR + Ins, <0.001 for DR + LDA, <0.05 for DR + MDA or HDA)
Tables 2(a), (b) & Figure 4 showed that addition of aspirin to diabetic rats treated with insulin resulted in reduction of HBA1c% as compared to diabetic rats to become about normal levels (No significant changes with normal non diabetic rats) (P < 0.05 for DR + Ins + LDA and <0.001 for DR + Ins + MDA or HDA). Again, HDA in diabetic rats treated with insulin showed lower HBA1c% level than diabetic rats treated with insulin only or insulin and LDA (P < 0.05).
3.3. C-Peptide (ng/ml)
Tables 3(a), (b) & Figures 5 and 6 showed that C-peptide levels were lower significantly in all diabetic rats whether taking aspirin or aspirin and insulin in different


Table 2. (a) Comparison of Glycosylated haemoglobin percentage (HBA1c%) between experimental groups; (b) Comparison between compared groups of experimental rates regarding glycosylated haemoglobin %.

Figure 3. HemoglobinA1c% (HBA1c%) Level in normal and diabetic rats with or without administration of insulin or aspirin in different doses. * = As compared to Normal Rats (NR); NR = Normal Rats; DR = Diabetic Rats; DR + Ins = Diabetic rats treated with insulin; DR + LDA, MDA & HAD = Diabetic rats given low, moderate & high dose aspirin.

Figure 4. HemoglobinA1c% (HBA1c%) Level in normal and diabetic rats without or with administration of insulin and aspirin in different doses. * = As compared to Normal Rats (NR); # = As compared to Diabetic Rats (DR); @ = As compared to Diabetic Rats treated with insulin (DR + Ins) or DR + Ins and LDA (DR + Ins + LDA); NR = Normal Rats; DR = Diabetic Rats; DR + Ins= Diabetic rats treated with insulin; DR + Ins + LDA, MDA & HAD = Diabetic rats given insulin and either low, Moderate or high dose aspirin.


Table 3. (a) Comparison of C-Peptide value between experimental groups (ng/dl); (b) Comparison between compared groups of experimental rates regarding c-peptide (ng/dl).

Figure 5. C-peptide Level in normal and diabetic rats with or without administration of insulin or aspirin in different doses, * = As compared to Normal Rats (NR); NR = Normal Rats; DR = Diabetic Rats; DR + Ins= Diabetic rats treated with insulin; DR + LDA, MDA & HAD = Diabetic rats given low, moderate & high dose aspirin.

Figure 6. C-Peptide Level in normal and diabetic rats without or with administration of insulin and aspirin in different doses, * = As compared to Normal Rats (NR); NR = Normal Rats; DR = Diabetic Rats; DR + Ins= Diabetic rats treated with insulin; DR + Ins + LDA, MDA & HAD = Diabetic rats given insulinand either low, moderate or high dose aspirin.
doses as compared to normal non-diabetic rats (P< 0.001 for all groups). No significant differences were observed between diabetic rats taking insulin or not, aspirin alone or aspirin and insulin in different doses.
3.4. Serum Triglycerides (TGs) Level (mgldl)
Tables 4(a), (b) and figure 7 showed that diabetic rats taking MDA had a significant higher serum TGs level as compared to normal non-diabetic rats (P < 0.05). Moderate and high dose aspirin in diabetic rats had significant increased serum TGs levels as compared to either diabetic rats treated with insulin or diabetic rats not taking insulin but on low dose aspirin (P < 0.05).
Tables 4(a), (b) and figure 8 showed that treated diabetic rats with insulin and taking moderate dose aspirin had significant higher serum TGs levels as compared to either normal non-diabetic rats or treated diabetic rats taking insulin (P < 0.05)
Other parameters showed no significant changes between the different groups studied.
4. Discussion
Although the hypoglycemic potential of salicylate therapy was demonstrated more than 100 years ago [21] and again recently [22], clinical utility in diabetes treatment has been limited by nausea, vomiting, tinnitus and deafness associated with high dose therapy [23-25].
Our study using different doses of aspirin [low (LDA), moderate (MDA) and high dose (HDA)], showed that moderate and to a greater extent high dose aspirin administration to diabetic rats have greater impact on fasting blood glucose levels whether treated with insulin or
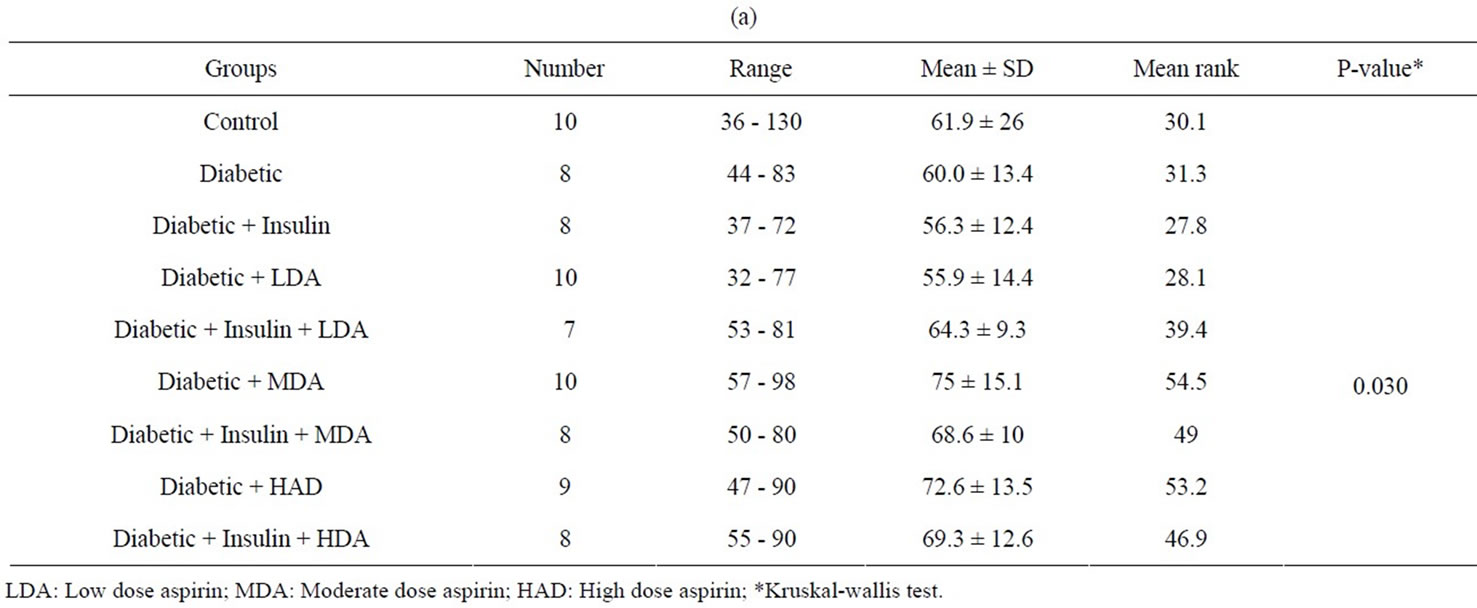
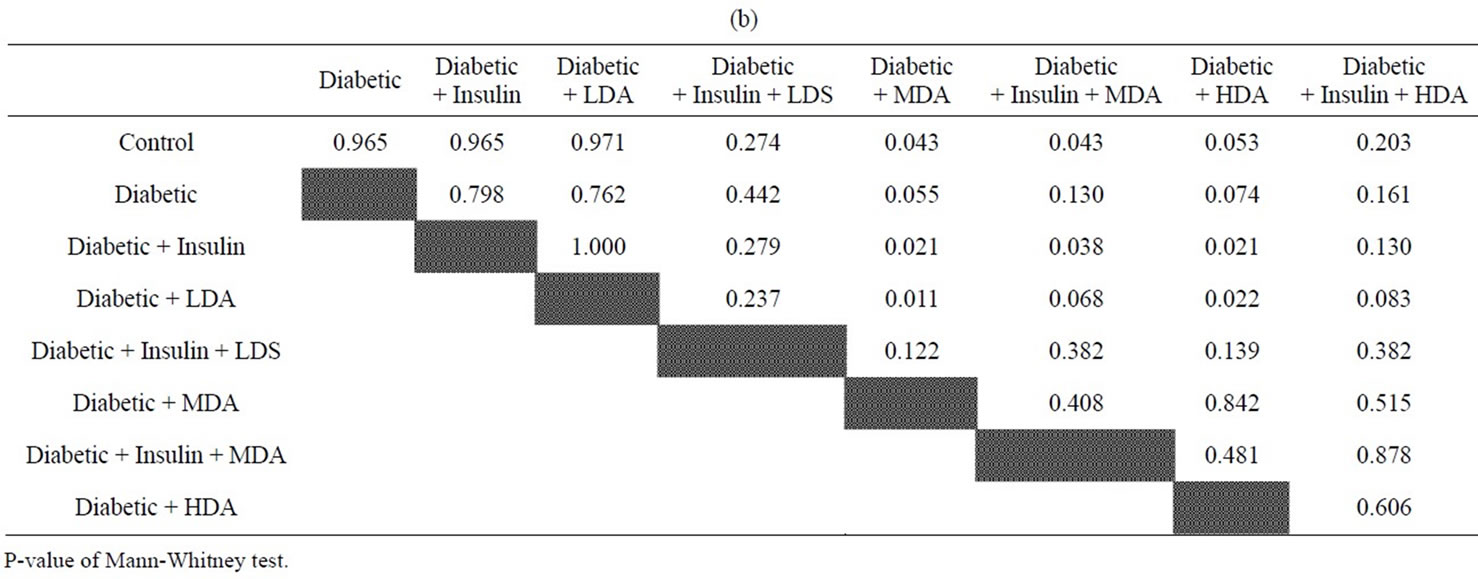
Table 4. (a) Comparison of triglycerides level (mg/dl) between experimental groups; (b) Comparison between compared groups of experimental rates regarding triglycerides.

Figure 7. Triglycerides (TGs)) Level in normal and diabetic rats with or without administration of insulin or aspirin in different doses. * = As compared to Normal Rats (NR); # = As compared to diabetic rats treated with insulin (DR + Ins); @ = As compared to diabetic rats taking low dose aspirin (DR + LDA); NR = Normal Rats; DR = Diabetic Rats; DR + Ins= Diabetic rats treated with insulin; DR + LDA, MDA & HAD = Diabetic rats given low, moderate & high dose aspirin.

Figure 8. Triglycerides (TGs)) Level in normal and diabetic rats without orwith administration of insulin and aspirin in different doses. * = As compared to Normal Rats (NR); # = As compared to diabetic rats treated with insulin (DR + Ins); NR = Normal Rats; DR = Diabetic Rats; DR + Ins = Diabetic rats treated with insulin; DR + Ins + LDA, MDA & HAD = Diabetic rats given insulinand either Low, Moderate or high dose aspirin.
not. Again, HBA1c% (glycosylated hemoglobin%) in diabetic rats treated with insulin and receiving HDA was lower than diabetic rats treated with insulin only or even taking LDA in addition. On the contrary, different doses of aspirin (LDA, MDA & HDA) administration to diabetic rats have no any influence on HBA1c% as compared to normal non-diabetic rats.
Although the mechanisms by which salicylates affect glucose metabolism are not completely elucidated, studies have described both inhibitory effects on hepatic glucose production [26,27] and improved insulin action from inhibition of kinases IKKβ (inhibitor of Kβ). Since Pickup et al. [28] first proposed diabetes as an inflammatory disease state in 1997, growing evidence has pointed to a correlation between various pro-inflammatory cytokines and insulin resistance in type 2 DM [29-31]. Many studies demonstrated the correlation of insulin resistance to TNF-α [32]. Specifically, TNF-α can decrease glucose uptake and utilization of peripheral tissues by targeting insulin signaling pathways and glucose transport 4 (GLUT 4). NF-kβ is a pro-inflammatory marker that controls the production of a host inflammatory markers and mediators, including TNF-α, IL-6 and C-reactive proteins [33-35]. TNF-α induces activation of the IKKβ kinases which regulates NF-kβ transcriptional activity. Aspirin is supposed to inhibit NF-kβ expression and also reduced TNF-α level and improved insulin resistance [32]. Again, Yaun et al. [8], hypothesized that IKKβ is a key downstream mediator of insulin resistance in type 2 DM and demonstrated that high doses of salicylates which inhibit IKKβ activity [8], reversed hyperglycemia, hyperinsulinemia and dyslipidemia in obese rodents by sensitizing insulin signaling [9].
The positive impact of moderate and high dose aspirin on FBS levels in our study could be explained by the two mechanisms mentioned (inhibition of hepatic glucose production and reduction of peripheral insulin resistance), however, HBA1c% reduction by higher doses of aspirin in insulin treated rats only supported the second mechanism of enhancing peripheral insulin action through inhibition of NF-kβ & IKKβ. These results are in accordance with Yaun hypothesis [8] supporting it as opposed to the inhibition of the cyclooxygenases pathway [36,37] as evidenced by the lack of any effect of different aspirin doses on C-reactive proteins level in diabetic rats in our study.
The liver is the key organ of insulin resistance in type 2 DM. Decreased hepatic insulin sensitivity may lead to increased hepatic gluconeogenesis, post-prandial hyperinsulinemia and increased formation of triglycerides (TGs) [32]. High dose aspirin, through its effect on peripheral insulin resistance as evidenced in many studies as well as in our study was supposed to improve insulin resistance in the liver of diabetic rats and lower, rather than augmenting TGs level. Actually, our study showed an elevated levels of TGs in diabetic rats receiving MDA alone as compared to normal non-diabetic rats, Again, moderate and HDA in diabetic rats not taking insulin had high TGs level as compared to diabetic rats treated with insulin only.
Although the carefully performed study by Kim et al. [9] provides new insight into the mechanism of fat induced insulin resistance, we would like to caution against the preliminary conclusion concerning beneficial effects of salicylates on hepatic insulin resistance. In contrast to the finding of Kim et al. [9] in the TGs infusion model in the rat, earlier studies in human volunteers using hyperglycemic clamp techniques, reported increased insulin resistance by salicylate compounds [38,39]. These findings suggest that the effects of salicylates may depend on the experimental model and possibly on the species studied [40]. Our negative results regarding the effect of different doses of aspirin on serum TGs levels in diabetic rats could be explained by the short duration of aspirin administration to diabetic rats to affect hepatic insulin resistance or to the experimental model and/or species difference as in previous studies [37-40].
The study concluded that the inflammatory pathways hold a substantial part in insulin resistance in type 2 DM. The influence of salicylate compounds on insulin sensitivity is multifactorial especially in high doses, and involves both beneficial and deleterious effects depending on the species and experimental model studied. This could not preclude patients from taking low dose aspirin to prevent cardiovascular disease [41], but more basal and clinical studies are needed before recommending higher dosage of salicylates for the treatment of type 2 diabetes itself.
5. Acknowledgements
This study was sponsored by Institute of Scientific Research and Revival of Islamic Heritage with grant no. 43109010.
The authors would like to thank Prof. Moataz AbdelFattah, Professor of Medical Statistics and Clinical Epidemiology, Medical Research Institute, Alexandria University, Egypt for his statistical advice throughout preparation of this manuscript.