Study on Stock Index Futures’ Mean Reversion Effect and Arbitrage in China Based on High-Frequency Data ()
1. Introduction
Since Chinese first index futures launched on China Financial Futures Exchange (CFFE), the trading volume jumped to the biggest among all futures. Besides price discovery and hedging, the function of index futures includes arbitrage, which makes a stable relationship between spot and futures market. Generally, arbitrage on index futures can divide into three types: futures-spot arbitrage, inter-delivery arbitrage, and cross-market arbitrage. Future-spot arbitrage opportunity arises when index futures deviates its theoretical value which is calculated by cost of carry theory. Because of transaction cost, index futures normally would stay in a band which arbitrage trade cannot make profit and we called “no-arbitrage band”. When futures’ price stays out of the band, index futures are mispricing. Then, arbitrageur will obtain profit by cash-and-carry arbitrage, which means they short index futures and long spot when futures price is above the upper limit of noarbitrage band, and wind the position of both on expiration day. If index futures exceeds lower limit, they could do the opposite actions of above which named reverse cash-and-carry-arbitrage.
The research about index futures’ arbitrage has been popular. Cornell [1] proposed the cost of carry theoryand compared actual and model price of NYSE composite index futures and S & P500 index futures, which is the milestone for arbitrage research. Figlewski [2] analyzed several S & P500 index futures contracts statistically, and found there were many arbitrage opportunities indeed. Besides, Harris [3], Brennan [4], Chung [5], and Richie [6] made some similar conclusions. Fremault [7] discovered three effects of arbitrage trading for hedgers, speculators and arbitrageurs in futures and spot market. Sutcliffe [8] claimed that it is important to separate arbitrage opportunities from mispricing. McMillan [9] investigated mispricing of ISE30 index futures in Turkey, and found there was only cash-and-carry arbitrage opportunities when spot cannot be shorten.
Since profits cannot be obtained unless index futures return to no-arbitrage band, then the research has been involved into mean reversion effect of index futures. MacKinlay and Ramaswamy [10] discovered mean reversion effect existed in S & P500 index futures. Additionally, Lim [11] and Yadav [12] found Nikkei225 and FTSE-100 had this effect. Neal [13] employed logit regression model using one minute data to analyze arbitrage trades on the NYSE for first contract in 1989, who found that there mispricing reversal is significant positive related to absolute mispricing amount.
Then, some researches focused on explanation of mean reversion effect of index futures. Traditionally, reversion effect is viewed as a consequence of arbitrage in market. Garbade and Silber [14] used vector autoregression and found continuum of traders induces continuity in mean reversion. Chan [15], Kawaller [16], Stoll [17] have estimated similar model and obtain the same conclusion. Kawaller [18] and Tse [19] considered the effect was resulted from different arbitrageurs, and the reversion is a smooth auto-regression process. Yadav and Pope [20] suggested transaction was the trigger of reversion. Kempf [21] made the same conclusion by discussing the influence of short restriction and clear the position before expiration day. Fung [22] observed S & P500 index futures had price reversal phenomenon which due to the investors’ overreaction for information. Kumar [23], Holden [24-25] had some similar conclusion with arbitrage trade reason.
However, the liquidity theory challenges the traditional explanation, which argues the illiquidity in stock market cause the reversion of futures. One of the earliest illiquidity explanations was Kraus and Stoll [26], who found that large trade would bring about reversal price, which is consistent with Biais [27]. Alphonse [29] accounted the mean reversion of CAC40 index futures in France from spot’s illiquidity.
Therefore, some researches have been done around the mean reversion effect of index futures and its reasons. However, the timing effect of it was less involved. Dwyer [30] regressed S & P500 index futures by Threshold Error Correction Model (TECM) and did impulse response, who found the futures’ price need 5 - 7 minutes to go back to no-arbitrage band. The problem is the conclusion is sensitive to threshold’s value, and impulse response does not cover the test from tail to middle area.
Based on high frequency data, this paper empirically researches the mean reversion and its time effect by ADF model for the first time in Chinese index futures. Meanwhile, we explored some factors by a logit model which may influence arbitrage opportunities.
2. Methodology and Data
The arbitrage chances would appear if only the index futures exceeds no-arbitrage band. Taking transaction into account, we calculated no-arbitrage band of CSI300 index futures as following.


where Fu and Fd is upper and lower limit, respectively. FTT is theoretical price for index futures at T time. Ft and St is futures and spot price at t time. Cst and Cft is the spot commission and futures transactions. Csl and Css is impact price for longing and shorting spot, while Cfl and Cfs is impact price for long and shorting futures, respectively, and r is riskless interest rate.
Once the price exceeds no-arbitrage band, index futures is mispricing and we named mispricing ratio (MR) to value as following.

Referring Mackinlay’s [10] research which first and higher orders of autocorrelation coefficient show the persistence of mispricing, we estimated ADF functions as following.
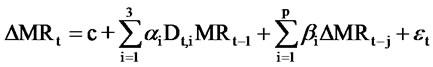 (1)
(1)
where,  is the first order difference of mispricing ratio. As for Dt,i, if there is no mispricing and arbitrage opportunity at t time, Dt,1 = 1. If there are positive mispricing ratio, we can short index futures, Dt,2 = 1; otherwise, negative mispricing ratio makes Dt,3 = 1. In addition, p lagged mispricing changes also included in the regression equation to correct for autocorrelation in mispricing changes.
In order to investigate the higher order difference, we also estimated functions as following.
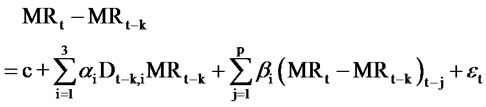 (2)
(2)
Finally, we estimated a logit model to test for some significance variables that may influence arbitrage opportunity including the expiration days, trading volumes, positions and spread between highest and lowest price in one minute of index futures.
Based on 1 minute high frequency data, this paper studies the arbitrage and mean reversion effect for CSI300 index futures. Since there are four contacts on the same time, we construct the continuous contract with the most active. The CSI300 index futures market open at 9:15, and close at 15:15, which is earlier and later 15 minutes than its underlying index, respectively. Therefore, the data we collected in 9:30 to 11:30 and 13:00 to 15:00 for the period from 23rd August 2010 to 18th February 2011.
As for transaction part, the commission for spot Cst is 0.3% from ETF. The trading fee for index futures is RMB30 for each deal, and price multiplier for each point of RMB 300, so the transaction cost for index futures Cft is 30/(30 × Ft). Since the trading volume is huge for spot and the continuous contract of index futures, we consider that the impact cost for them is zero, which means Css, Csl, Cfs, Cfl are all zero.
3. Empirical Analysis
3.1. No-Arbitrage Band and Mispricing Ratio
Based on these data, we calculated the no-arbitrage band and mispricing ratio of CSI300 index futures, which is drawn in Figure 1.
From Figure 1, we can see that most of time index futures stays out of upper limit of no-arbitrage band when mispricing exist. The detail of arbitrage opportunity and the time mispricing persist are shown in Table 1. There are 36.2% of the time that index futures exceeds upper limit, while only 0.2% for lower limit, which suggest there are much more cash-and-carry-arbitrage for CSI300 index futures than the reverse one. This is consistent with McMillan [7], who found there are only cash-and-carryarbitrage chances for ISE40 index futures, and the reason is margin trading and short selling just start in China, which cannot short spot. Thus, the deficiency for investment channel and limitation for trading mechanism lead to the asymmetrical arbitrage direction. Moreover, the persistent time for positive mispricing is 12.6 minutes on average, which illustrate that index futures need 12.6 minutes to return to no-arbitrage band.
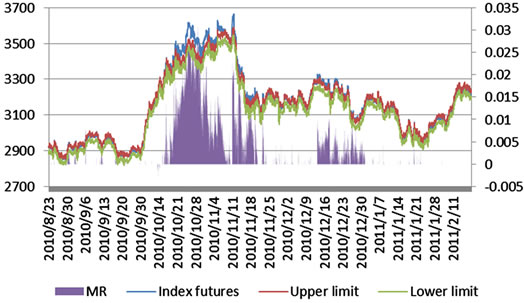
Figure 1. No-arbitrage band and mispricing ratio of CSI300 index futures.
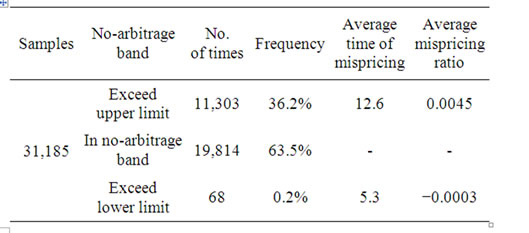
Table 1. Arbitrage opportunities and mispricing ratio.
Figure 2 depicts the relationship between mispricing and the time to expiration. From Figure 2(a), the biggest mispricing is happened on 23 days before maturity, which suggest if investors start to arbitrage at this time, they will gain profit mostly. Besides, it shows that the closer to expiration day, the less the mispricing and it appears. Figure 2(b) shows the average mispricing ratio for different days to expiration. In general, the closer to expiration day, the less mispricing ratio, which state that CSI300 index futures convergent to its underlying as closing to maturity. While when days to expiration is more than 24 days, there are huge mispricing ratio occasionally, but it is not significant on statistical.