Metagenomic profiles of soil microbiota under two different cropping systems detected by STRs-based PCR ()
1. INTRODUCTION
The soil is a highly complex and dynamic environment that sustain a great diversity of microbes associated to its biological properties [1]. Telluric biota is involved directly and indirectly in the provision of a wide range of ecosystem services, essential to land productivity, such as nutrient cycling and regulation of ecosystem processes [2]. For these reasons, the size of microbial diversity in the soil environment is, generally, directly related to global fertility and to its broad-spectrum quality [3]. Changes in soil microbial community structures occurred under different management practices, have been extensively explored with holistic approach by using various tools ranging from traditional plate counting until to innovative molecular-based techniques and “omic” strategies, including metagenomic analysis [4,5]. Newer researches to measure soil biodiversity, in fact, are focusing on genetic diversity viewed as the amount and distribution of genomic information within the generality of microbial species living in soil niches. Metagenomic strategy analyze the set of the total microbiota genomes, termed metagenome, extracted from indigenous community in a given soil [6,7]. This approach have a lot of credit respect to traditional methods that provide very limited information, because only a small percentage of total soil microbiota, estimated between 0.1% and 10%, is cultivable in vitro [1,8]. Studies on microbiota diversity by molecular approach are increasing in this last years. In particular, studies were performed to evaluate the influence of soil type [9], the impact of a number of soil treatments, such as grassland restoration [10], saltrich water irrigation [11] or farm management style [12], on composition of telluric microbial community.
Among diverse analytical approaches that are known and described so far, polymerase chain reaction (PCR)- based DNA fingerprinting technology applied to highly repeated sequences, randomly located within the whole genome, allow the rapid molecular characterization of soil microflora [13,14].
These DNA sequences also include miniand microsatellite regions that can be used to develop probe able to generate characteristic PCR-amplifed satellites fingerprints resolved by non-denaturing gel electrophoresis [15]. Minisatellites referred to as variable number of tandem repeats, include the core sequence of the wild type phage M13 (5’-GAGGGTGGCGGTTCT-3’) [16], while microsatellites consist of simple or short sequence (di, tri, tetra etc.) repeats (SSRs), also referred to as simple tandem repeats (STRs), and include primers (GACA)4 [17,18], (CA)8, (CT)8, (CAC)5, (GTG)5 [13] and (GATA)4 [19].
Metagenomic analysis by PCR-amplifed miniand microsatellites fingerprinting strategy was applied in this study to rigorously reveal genetic diversity of soil microbiota under two different cropping systems. Aim of this paper is to show metagenomic profiles of two compared soils that were cultivated with horse bean-wheat-horse bean succession and only with a wheat triennial homosuccession.
2. MATERIALS AND METHODS
2.1. Soil Samples
Soil samples were collected at a deep of 20 cm about three months after harvesting of wheat and horse-bean cultivated in the third year of a crop succession horse bean-wheat-horse bean (H-W-H) and a homosuccession of wheat (W). A total of six soil samples were collected from plots (three for each of the two crop successions) located at experimental farm of Battipaglia (CRA-ORT), in Southern Italy. Each soil sample, obtained mixing six sub-samples collected from the same plot, was sieved (sieve 2 mm), dried at 40˚C for 48 h and stored at room temperature.
2.2. DNA Extraction and Purification
DNA was extracted from 5 g of soil, in according to the protocol described previously [20]. DNA extracted was purified from humic acids by agarose gel electrophoresis. Concentration and purification of DNA were measured, respectively, by absorbance at 260 and 280 nm using a Bio-photometer (Eppendorf, Germany).
2.3. Mini and Microsatellite Amplification
It was performed by PCR using M13 minisatellite primer (5’-GAGGGTGGCGGTTCT-3’) and (GACA)4, (TGTC)4, (GTG)5, (CGA)5 and (CCA)5 microsatellite primers. The primers used in this study were chosen among those that, previously, were successfully applied to differentiate genetic populations of various soil-borne microbes [21-25].
Each amplification was carried out in a volume of 25 μl containing 10 ng of DNA, 0.2 mM of dNTPs, 2.5 mM of MgCl2, 1 U of Taq-DNA polymerase (Triple Master Taq, Eppendorf) and 50 ng of primer. Amplification program was: 94˚C for 30 s (60 s in the first cycle), 50˚C (for M13 primer) or 55˚C (for all microsatellite primers) for 60 s, 72˚C for 60 s, for a total of 40 cycles. The thermocycler used was the Perkin Elmer 2400 model. For each DNA sample, amplifications were repeated 3 times.
2.4. Electrophoresis and Staining
Electrophoresis was performed in 1.5% agarose gel in 0.5 X TAE buffer, using electrophoretic cell GNA 200 model from Pharmacia Biotech. Run was done at 100 V for about 3 hours. Detection of the bands was made by ethidium bromide staining.
2.5. Numerical Analysis of Band Patterns
Looking amplification bands on the gels of the six DNA soil samples, a rectangular binary matrix (1 = presence of the band; 0 = absence of the band) was constructed. Molecular markers used for to construct the matrix were the most stable, that were present in at least two out three soil samples (replications) for each succession. With the software numerical taxonomy NTSYS-PC version 2.0, from the binary rectangular matrix, a triangular similarity matrix was obtained using the Dice similarity coefficient (SD) and, after that, with the UPGMA (unweighted pair group method using arithmetic averages) clustering method, the dendrogram of similarity was constructed [26,27]. The structural diversity of soil bacteria were also assessed by Richness (S) according to the following equations: , where Si is the total number of bands in each lane sample and n is the total replicates [28].
3. RESULTS AND DISCUSSION
Genetic fingerprinting by PCR analysis of soil metagenome, based on the diversity of miniand microsatellite sequences, revealed different ability of oligonucleotides to generate distinguishable profiles (Table 1). Readable patterns were obtained only with ColiphageM13 and (GACA)4 primers while, for the other four primers, no well-defined profiles were detected. In fact, (TGTC)4 oligonucleotide got unsuccessful and no band were displayed, while (GTG)5, (CGA)5 and (CCA)5 oligonucleotides generated a lot of not distinguishable bands, displaying smears on gel electrophoresis. M13- PCR metagenomic fingerprinting resulted in complex banding pattern, containing generally about 15 visualized amplicons that were found identical for all analyzed soil samples. M13 primers resulted not able to discriminate between the two cropping systems and in spatial sampling (Figure 1).
On the contrary, complex and different band patterns were found with the (GACA)4 oligonucleotide, able to discriminate among the two cropping systems regardless of the spatial variability of the sampling points (Figure 2). Considering the totality of (GACA)4-PCR profiles, a total of 43 well-resolved markers were detected. On electrophoresis gel were visualized, on average, about 17 bands for each profile which include few evident bands (about 14 on average). Together with this strong signals, a greater number of fainter well-resolved bands appeared in the profiles, determining some differences that were

Table 1. Main characteristics of the primers used in PCR-based fingerprinting of soil metagenome and relative displayed gel-patterns.
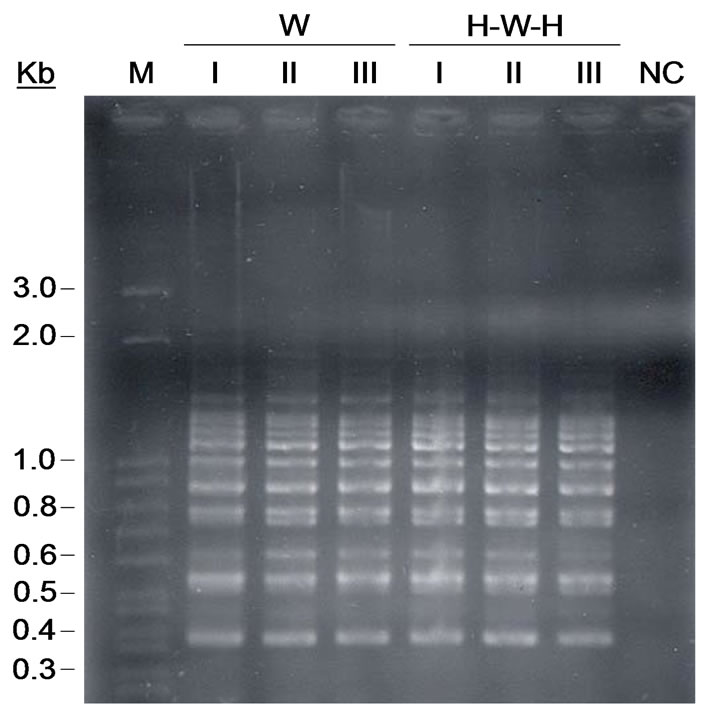
Figure 1. STRs fingerprints of PCR-amplifed phage M13 minisatellite sequence from directly extracted soil community DNA. Lanes: W soil and H-W-H soil samples with different spatial replicates (I, II e III).
all considered when clustering method was applied. According to (GACA)4-PCR fingerprinting soil microbial communities derived from H-W-H and W cropping systems grouped in separate clusters with a Dice’s similarity coefficient of 0.58; the results of numerical analysis carried-out with the UPGMA method, are showed with the relative similarity dendrogram (Figure 3). Two soil communities profiles differ also for Richness (Table 2).
Furthermore, in our work, a striking diversity was observed in patterns of both tested soils, due to numerous faint bands in the background and to discordance of one of the three replicates. For both cropping systems, two out three replicates derived from the same soil utilization were largely similar, while the third was found with some differences, with a Dice’s similarity coefficient of about 0.94 for both wheat 3-year monoculture and H-W-H succession.
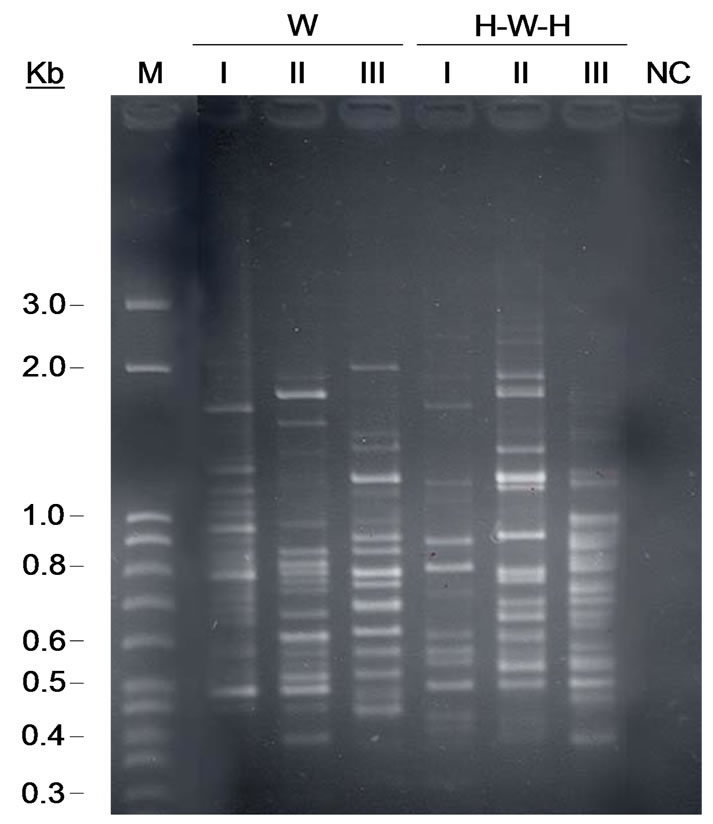
Figure 2. STRs fingerprints of PCR-amplifed (GACA)4 microsatellite tandem sequence from directly extracted soil community DNA. Lanes: W soil and. H-W-H soil samples with different spatial sampling (I, II e III).
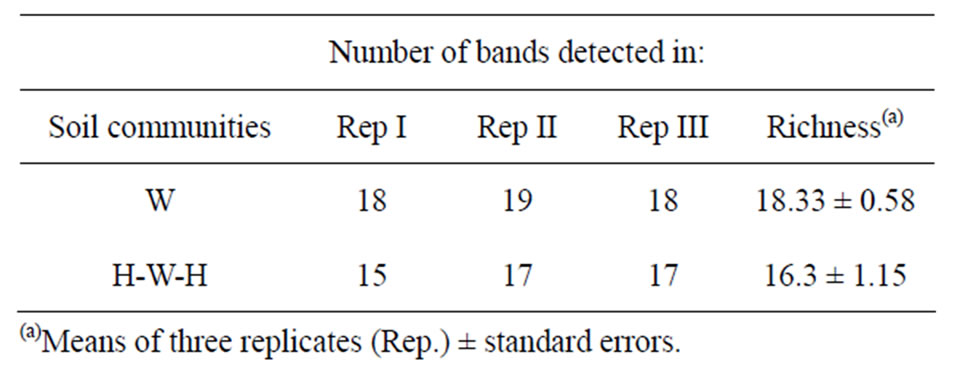
Table 2. Total bands generated by (GACA)4-PCR and visualized on electrophoresis gel with 2.5% agarose.
Amplification of repetitive microsatellite-DNA region through PCR using (GACA)4 primer was found a promising molecular tool for rapid and reliable soil metagenome fingerprinting. The utilization of these highly con-
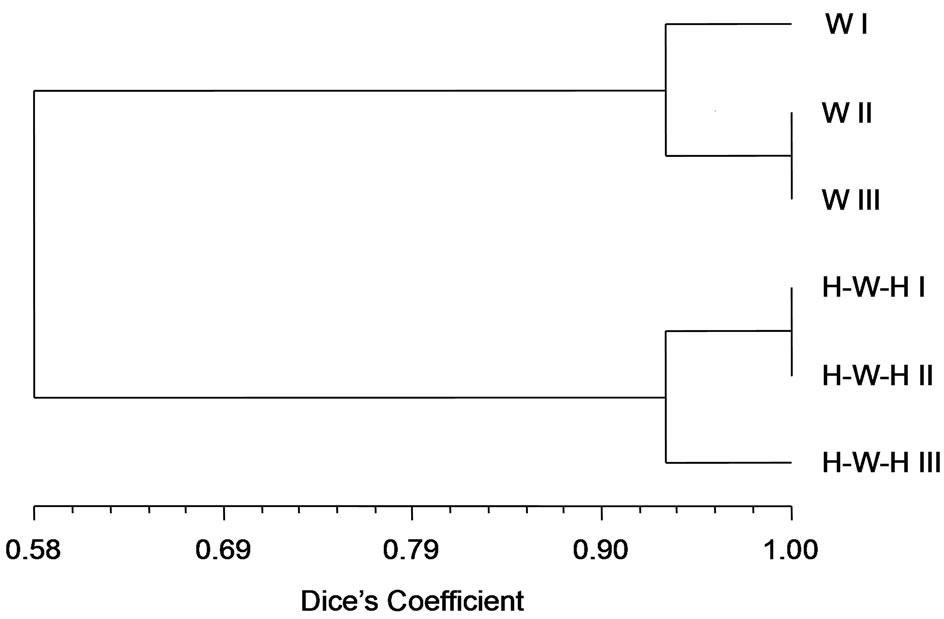
Figure 3. Cluster analysis (UPGMA, Dice’s coefficient of similarity) of molecular banding patterns generated by (GACA)4- PCR of Figure 2. The similarity dendrogram (scale 0-1) was calculated from lanes of all W or H-W-H replicates, for I, II and III spatial sampling.
served DNA-elements to study soil microbial diversity is not widespread, but our study demonstrate that this molecular approach can be adequate to the scope. Amplification failure and non-discriminating gel-patterns registered with M13, (TGTC)4, (GTG)5, (CGA)5 and (CCA)5 primers, suggest that the use of this method may be limited by the complexity of the communities and the suitability of the probe as previously reported [15].
The molecular approach used in this study consistently detected differences between the two compared cropderived soil communities, as confirmed by (GACA)4- PCR fingerprints cluster analysis, that suggest a strong and divergent impact of H-W-H rotation and W monoculture on microbial population. Likely, the different profiles observed in microbial structures of the two soils were due to plant-soil biota interactions and were driven by a trophyc resource utilization mechanism. Cover plants, in fact, could exert specific selective pressure on soil microbiota by root exudates deposition and decay of litter and roots, making available to microbes different C-pools [29] with substantial consequences on their genetic structure. The evidences suggest that the diverse cropping system is the main cause of microbial structure changes observed in this study. This is in agreement with earlier studies which hypothesized that cover plants may affect telluric microbial population [30-33].
Furthermore, the particular spatial distribution of microbiota detected among replicates into each group, evidenced that the structure of microbial communities, derived from the two soil utilization types, was rather complex and was affected by slight variability in the space. Nevertheless, PCR-pattern analysis revealed that prolonged cover plant pressure, such as that pursued by a forage crop, allow to overcame naturally space-structured variability existing into soil community. At the scale at which microbes perceive their environment, most microbial habitats are spatially heterogeneous, due to a large number of potential niches. These microhabitats, together create different islands of soil biological activity and better known as hot-spots that can have profound effects on the functional and phylogenetic microbial structure [34,35]. Therefore, findings of this work agree on the conclusive hypothesis that intensive cropping systems may contribute also to smooth out soil patchiness and make soil microbiological conditions more homogeneous. Moreover, soil microbiota changes, detected by analysis of the metagenome, are well correlated with cover plants sown in succession. This paper let to conclude that the use of PCR amplified short tandem repeat sequences, derived from total environmental DNA, may be a good molecular approach to obtain fingerprints of microbial community changes and to calculate microbial diversity indicators. Although these high variable repetitive DNA sequences were indicated as possible markers for soil microbial genetic fingerprinting [15], in literature there is a gap about experimental evidences that support this application. Therefore, this work investtigated the potential use of these selected specific STRs as fingerprinting method at community level too. However, further studies are necessary to compare the performances of the proposed methodology with major standard fingerprinting methods used for microbial community analysis and will be particularly useful to extend the base of the research to a larger number of case studies with more than two treatments, in order to strengthen the reliability of the method.
4. ACKNOWLEDGEMENTS
Funding for this research was provided by Mi.P.A.A.F.