Water and Nitrogen Management Effects on Biomass Accumulation and Partitioning in Two Potato Cultivars ()
1. Introduction
In potato plants, tubers constitute the part with economic significance. The production of tubers is influenced by interaction of climate conditions, cultural practices, genotype, early development of plants, rate and amount of biomass accumulation in the aboveground growth, and subsequent allocation of assimilate from the aboveground portion of the plant into the tubers [1-4]. Indeed, excessive vegetative growth during the late growing stage has negative effects on the amount and quality of tubers [5-8]. Partitioning of biomass into different plant parts is a dynamic process throughout the growth and development of the plant [1,9,10], which in turn is influenced by different management factors and variation in climate factors [2]. Partitioning of biomass only at the end of the growing period, such as calculation of harvest index, i.e. ratio of biomass of the plant part of economic significance (i.e. grain, fruit, tuber etc.) in relation to total biomass, provides very little information on the difference in biomass partitioning in the early growing period. Cultivar characteristics, i.e. early or late maturing cultivars, influence assimilate allocation into tubers. Early potato cultivars tend to allocate a greater portion of the photosynthates into tubers early in the growing season as compared to that in the late cultivars [11].
The objective of this study was to evaluate the biomass accumulation and partitioning in two potato cultivars under different irrigation and nitrogen (N) management programs in highly productive (60 - 80 Mg/ha) potato growing condition in the US-Northwest.
2. Materials and Methods
Plant samples for biomass accumulation and partitioning were taken from select treatments only from a large longterm experiment on the evaluation of deficit irrigation (DI) and N management practices on yield and tuber quality of two potato cultivars [12]. The field experiment was conducted in 2007 Benton County, WA, in a Quincy fine sand (mixed, mesic Xeric Torripsamments). The experiment included factorial combination of 1) two cultivars (“Ranger Russet” and “Umatilla Russet”); 2) two irrigation regimes, i.e. full irrigation (FI),replenish full evapotranspiration(ET);deficit irrigation (DI), replenish 80% of ET; 3) three pre-plant N rates (56, 112, and 168 kg N/ha); and 4) three in-season N rates (112, 224, and 336 kg N/ha), with three replications. Planting was done on March 12, 2007, and seedling emergence was on April 26, 2007. Differential irrigation treatments began as of May 17, 2007. Irrigation was done by center pivot system (Lindsay Manufacturing Co., Lindsay, NE). In the FI treatment the pivot was programmed daily to apply water to replenish the water deficit to full ET. The ET data was provided by the Washington Agriculture Weather Network Station at the experiment site. In the case of DI treatment the pivot speed was adjusted to apply only 80% of ET. The cumulative amounts of water application were 843, and 700 mm for FI and DI, respectively. The cumulative ET for the growing season was 850 mm.
The pre-plant N rate (as per treatment) was applied on March 7, 2007 using urea (46% N). Pre-plant soil test data was used to estimate the P and K requirement and applied as single super phosphate (8.7% P), and muriate of potash (50% K). These N, P, and K granular fertilizer were incorporated with soil during pre-plant tillage. Further details of the experiment and tuber yield and quality response data for all treatments are presented elsewhere [12]. The plot size was 6 rows (0.86 m spacing) of 12.2 m length each (5.2 × 12.2 m). The experiment was terminated on September 10, 2007. The tuber yield was measured by digging two middle rows of 6.1 m length each using a one row potato digger (Braco Manufacturing Co., Moses Lake, WA). The tuber weight was recorded and per hectare yield was calculated using the harvest plot area.
In-season fertigations (using Urea ammonium nitrate, UAN, 32%N) began on May 18, 2007, applied in five doses at two weeks intervals. Recommended pest and disease control sprays were made, as needed. Plant samples were taken only from the two extreme N rates, i.e. pre-plant + in-season N rates of 56 + 112, and 168 + 336 kg/ha. Therefore, total number of plant samples at each sampling date were 24; i.e. 2 cultivars × 2 irrigation rates × 2 N rates × 3 replications.
Plant Sampling
On May 23, June 14, July 13, and August 7 (22, 44, 66, and 98 days after seedling emergence; DAE), plant samples were taken from 0.5 m row length from selected treatments as described above. Plant tops were harvested, rinsed in distilled water, leaves were separated from the stem. Stem count and fresh weight of stems and leaves were recorded. Leaf area was measured using a leaf area meter (Li-Cor, 3100; Li-Cor Environmental, Lincoln, NE). A subsample of the leaves was used to measure leaf length, width, and leaf area (with leaf area meter). This data was used to establish relationship between the leaf area measured by the area meter and calculated area by leaf length × width. Roots and tubers were collected from within the plant sampling area, and washed to clean the soil residues. Tuber count and fresh weight of tubers and roots were recorded. Tubers with peel were sliced into about 5 mm thin slices. Each of the plant parts were dried at 75˚C for 72 h and dry weights were recorded.
3. Results and Discussion
Cumulative degree days (temperature > 10˚C) during the entire growing period was about 1750˚C, while cumulative ET was close to 825 mm (Figure 1). Four samplings taken in this study corresponded to 22, 44, 66, and 98 days after emergence (DAE). Considering the lack of sampling between 66 and 98 DAE, the biomass accumulation peaked on 66 DAE in both cultivars across all N and irrigation treatments (Figure 2), with exception of high N rates in “Ranger Russet” cultivar at both irrigation treatments. For the latter, biomass accumulation in tuber and consequently in total plant increased until 98 DAE. On 66 DAE, in “Umatilla Russet” cultivar, tuber and total plant biomass weights were significantly greater with full ET irrigation as compared to that with DI treatment. This difference was, however, not maintained during the 98 DAE sampling. In Ranger Russet cultivar, deficit irrigation had no significant effects on the tuber or whole plant biomass throughout the growing season.
On 98 DAE, tuber biomass of “Ranger Russet” as percent of total plant biomass was 82 and 84% with full ET and DI at the high N rate, while 86 and 95% for the respective irrigation regime at the low N rate (Figure 3). The corresponding values for the “Umatilla Russet” were 88% and 86% at the high N rate and 93% (for both irrigation treatments) at the low N rate (Figure 4).
Tuber fresh weight on per plant basis from 0.5 m row sampling and plant density was used to calculate total tuber yield on per hectare basis across four sampling dates during the growing period (Figures 5 and 6). In

Figure 1. Cumulative evapotranspiration (ET) and degree days (>10˚C) during 2007 potato growing season in the Northwest US.
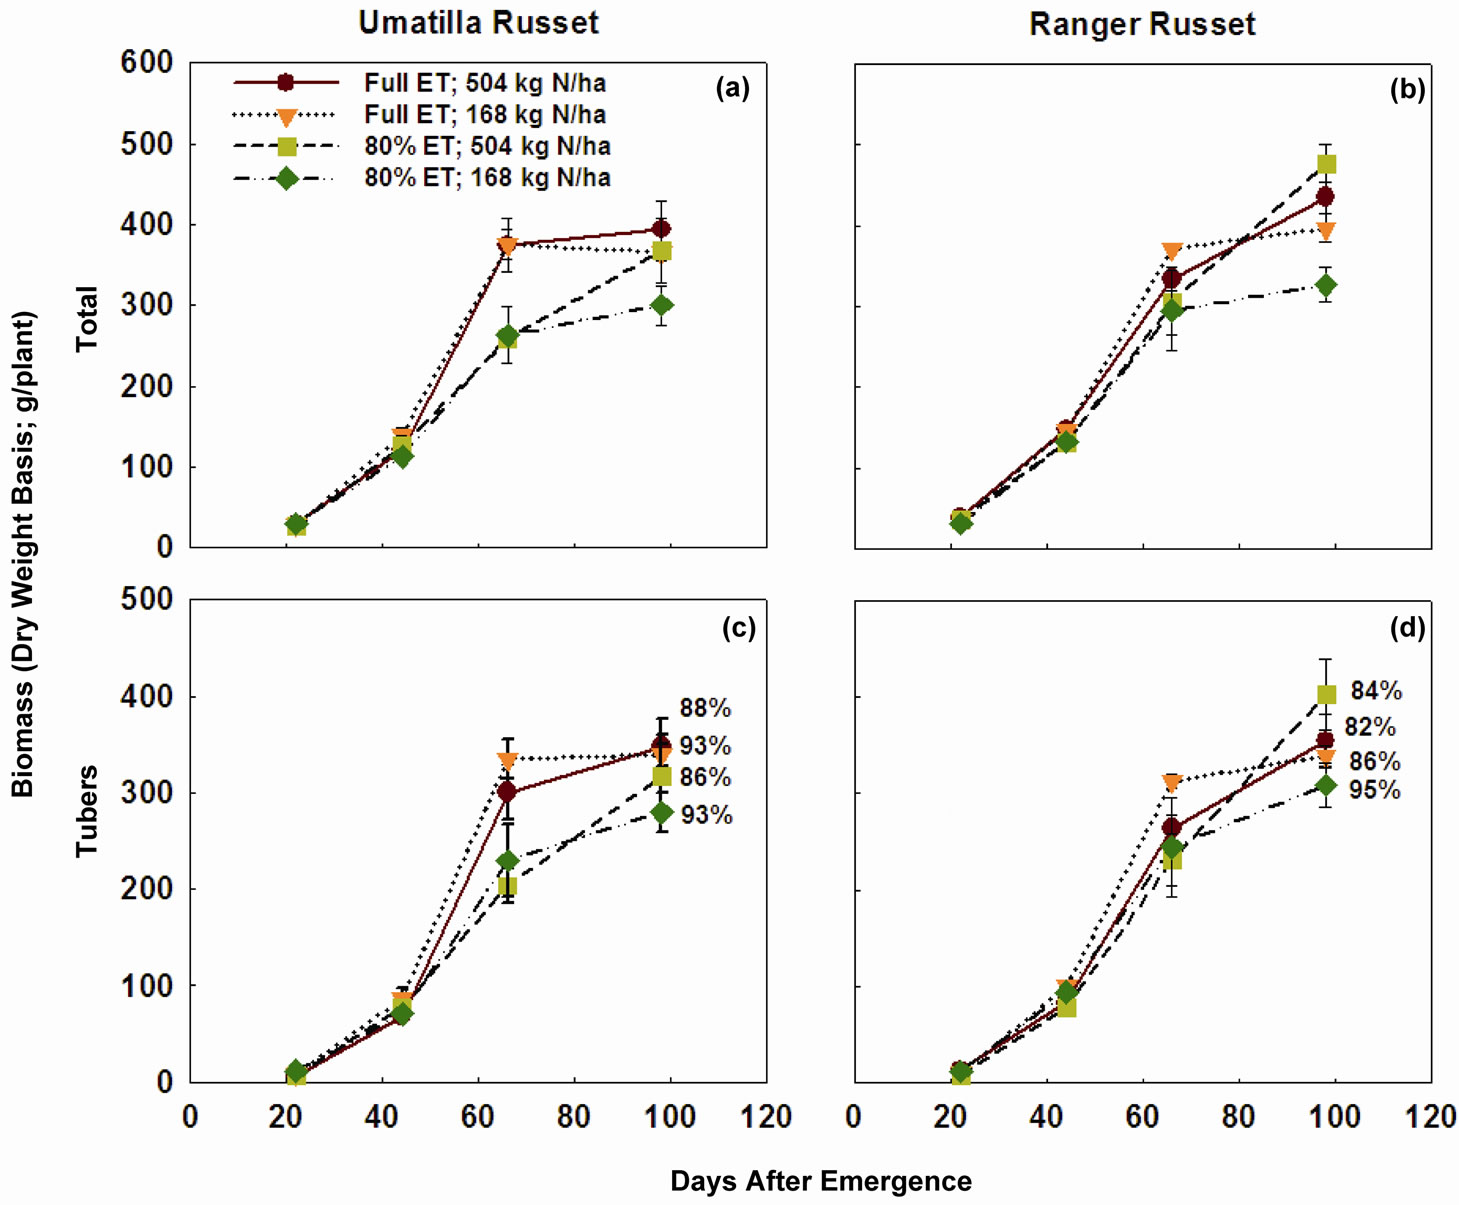
Figure 2. Total plant biomass and tuber biomass of two potato cultivars grown under two irrigation regimes and nitrogen rates. Plants were sampled 22, 44, 66, and 98 days after emergence (DAE). Vertical line across each data point represents standard error of the mean. Tuber biomass as percent of plant total biomass for each treatment for the 98 DAE sampling is shown in (c) and (d). ET = Evapotranspiration.

Figure 3. Leaf, stem, root, and tuberbiomass of Ranger Russet potato cultivar grown under two irrigation regimes and nitrogen rates. Plants were sampled 22, 44, 66, and 98 days after emergence. ET = Evapotranspiration.

Figure 4. Leaf, stem, root, and tuber biomass of Umatilla Russet potato cultivar grown under two irrigation regimes and nitrogen rates. Plants were sampled 22, 44, 66, and 98 days after emergence. ET = Evapotranspiration.

Figure 5. Tuber yield (Mg/ha; fresh weight basis) calculated based on weight of tubers in 0.5 m row length plants of Ranger Russet potato cultivar grown under two irrigation regimes and nitrogen rates. Plants were sampled 22, 44, 66, and 98 days after emergence. Value in parenthesis next to each data point represents fresh weight of single tuber at each sampling for each treatment.

Figure 6. Tuber yield (Mg/ha; fresh weight basis) calculated based on weight of tubers in 0.5 m row length plants of Umatilla Russet potato cultivar grown under two irrigation regimes and nitrogen rates. Plants were sampled 22, 44, 66, and 98 days after emergence. Value in parenthesis next to each data point represents fresh weight of single tuber at each sampling for each treatment.
“Ranger Russet” at high N rate, with full ET irrigation, the estimated tuber yield peaked on 66 DAE at 80 Mg/ha, with only modest increase in estimated tuber yield for 98 DAE. With DI treatment, the estimated tuber yield was lower than that for full ET irrigation during 66 DAE. However, tuber yield continued to increase between 66 to 98 DAE resulting in tuber yield very similar to that with full ET irrigation by 98 DAE. With the low N rate, however, the estimated tuber yield with DI was lower than that with full ET irrigation both at 66 and 98 DAE. Therefore, clearly the DI and lower N rate contributed to much greater negative effects on the tuber yield than limitation of either N or irrigation as a single factor.
In “Umatilla Russet” estimated total tuber yield based on 98 DAE sampling was similar (about 80 Mg/ha) across both irrigation and N rate treatments (Figure 6). This is indicative of greater potential for water and N uptake efficiencies of “Umatilla Russet” cultivar as compared to those of the “Ranger Russet” cultivar.
Accuracy of estimation of total tuber yield based on a small sampling of plants (0.5 m row), late during the growing period can be judged by comparing the estimated tuber yield from this technique with that obtained by traditional technique of measuring tuber weight from two rows of 6.1 m length each, and calculation of tuber yield on per hectare basis (Figure 7). Indeed, there was a good agreement between estimated and measured tuber yield, except in the case of DI with low N rate treatment on “Umatilla Russet” cultivar. For this treatment, the predicted tuber yield based on small sampling over estimated the measured tuber yield.
Leaf area is a good measure of plant canopy. Optimal plant canopy is important to support adequate production of photosynthates and, in turn, optimal production and quality of tubers. However, excessive canopy development may hinder tuber quality and quantity by improper distribution of biomass between vegetative and economically important parts of the plants.
Leaf area measurements by conventional leaf area meters are often laborious and require destructive sampling of the plant. Therefore, a rapid non-destructive technique for estimation of leaf area is highly desirable. In this study at each destructive plant sampling we measured leaf length and width, on a small subsample, to calculate apparent leaf area by multiplication of leaf length and width. Leaves in this subsample were also used for measuring leaf area by leaf area meter. The measured leaf area by leaf area meter was compared with the apparent leaf area by multiplication of leaf length × width. These two measurements were well correlated with an R2 value > 0.72, during May through July measurements (Figure 8). Therefore, this regression can be used to calculate the leaf area using the values obtained by length and width measurements of leaves which is less time consum-

Figure 7. Calculated tuber yield is based on the tuber weight of 0.5 m row sample (taken about a week prior to plot harvest) multiplied by the area factor and measured tuber yield using tuber weight of 2 rows of 6.1 m each multiplied by the area factor. Means followed by different letters within each treatment comparison indicate significant difference by T-Test. NS = Non-Significant.

Figure 8. Leaf area measured using a leaf area meter vs apparent estimated leaf area calculated as length × width of a subsample of leaves from selected treatments for four sampling dates.
ing unlike measurement of leaf area by leaf area meter.
4. Acknowledgements
We appreciate the generous support of AgriNorthwest Company, for providing the field facility for conducting this experiment. We also appreciate Bill Boge and Marc Seymour for managing the field experiment, sampling, and other measurements.