1. Introduction
Solanum lycopersicum L. (Tomato) is a red fruit with high economic value worldwide and is one of the major crops involved in North-South trade in Nigeria. Tomato is grown as either a small scale in backyard garden or commercial field in several parts of Nigeria, both as dry or wet season crops. It is regarded as one of the most important vegetables worldwide because of its high consumption, almost year round availability and large content of health related components. It can be affected by fungi such as Fusariumoxysporum and Geotrichum candidum [1].
Fusariumoxysporum is a soil-borne fungus that affects a several of host crops, including onion, lettuce, tomato, cucurbits, peas, watermelon, peppers, spinach, beans and banana, and also important non-food crops, such as carnation and narcissus; causing crown and root rots as well as vascular wilts [2]. Due to its varied host range in addition to its economic and scientific impact, means that F.oxysporum was recently identified as the fifth most important plant pathogenic fungus. F. oxysporum is a pervasive soil-born fungus, having a high genetic and ecological diversity with latent to cause diseases of many crop species such as tomatoes [2].
Geotrichum candidum is a filamentous “yeast-like” fungus. It’s a ubiquitous organism as it’s found in a wide range of habitats including air, water, silage and soil. Geotrichum candidum is the causal agent of sour rot of tomato fruit (Solanum lycopersicum) and other fresh produce [3].
F. oxysporum and G. candidum have an inherent morphological instability, which enables the organism to occupy a wide range of ecological niche, thereby making its taxonomy complicated and controversial [4] [5] [6]. Morphologically identification of F.oxysporum and G.candidum sometimes suffers errors and misidentification, leaving a need for molecular tools for strain identification. Characterization by molecular techniques using polymerase chain reaction (PCR) to amplify the internal transcribed sequences (ITS) and random amplified polymorphic DNA (RAPD) marker allows identifying organisms that cannot be distinguished morphologically; and can also help to comprehend the mechanisms of pathogenic variation [7]. The study was carried out to evaluate molecular diversity of F. oxysporum and G. candidum isolated from two tomato varieties obtained from Akure, Ilorin and Ibadan, Nigeria.
2. Methodology
2.1. Sample Materials and Collections
Two varieties of tomato samples were collected randomly in a well-labeled brown paper envelop from three state capitals in Nigeria (Shasha in Akure, Ondo state; Eye-nkorin in Ilorin, Kwara State and Shasha in Ibadan, Oyo State). From each location, and for each variety, as many as twenty samples were collected (Figures 1-3).
![]()
Figure 1.Solanum lycopersicum L. (Tomato) from Ilorin, Kwara state. A1: Tiwantiwa, A2: Hausa scissors.
![]()
Figure 2. Solanumlycopersicum L. (Tomato) from Akure, Ondo state. A1: Tiwantiwa, A2: Hausa scissors.
![]()
Figure 3. Solanumlycopersicum L. (Tomato) from Ibadan, Oyo state. A1: Tiwantiwa, A2: Hausa scissors [10].
2.2. Isolation and Identification of the Fungi
The fungi were isolated in Plant Pathology/Mycology laboratory, Department of Botany, University of Ibadan, Nigeria, using a classical method of Koch postulate as modified by Mailafia et al. [8]. Fungal isolates were identified using cultural and morphological characteristics in accordance with Tafinta et al. [9] and Mailafia et al. [8].
2.3. DNA Extraction
DNA extraction was done according to the method of Dellaporta et al. [11] as modified by [12].
2.4. Molecular Identification of Fungi Isolates
To use the ITS gene for characterization of the fungi isolates, ITS1 and ITS4 primers set which flank the ITS1, 5.8S and ITS2 region was used for PCR. PCR carried out in a GeneAmp 9700 PCR System Thermalcycler (Applied Biosystem Inc., USA); PCR conditions included an initial denaturation at 94˚C for 5 min, followed by 35 cycles of each cycle comprised of 30 seconds denaturation at 94˚C, 30 seconds. Annealing of primer at 55˚C, 1.5 min extension at 72˚C and a final extension for 7 min at 72˚C [13].
2.5. DNA Integrity and Sequencing
The integrity of the amplified about 550 Mb gene fragment was checked using the method of Pryce et al. [13] and Groenewald [14] on a 1.5% Agarose gel ran to confirm amplification. The sizes of the PCR products were estimated by comparison with the mobility of a 100 bp molecular weight ladder that was ran alongside experimental samples in the gel.3.5.3.
The amplified fragments were sequenced using a Genetic Analyzer 3130xl sequencer from Applied Bio-systems using manufacturers’ manual while the sequencing kit used was that of Big Dye® terminator v3.1 cycle sequencing kit [13] [14].
2.6. Molecular Characterization of Fungal Isolates Using RAPD Markers
PCR Protocol and Bands Separation
Polymorphic four (4) RAPD universal markers were used for genotyping the entire genome of the fungal isolates. The separation of bands as produced by each primer was done on a 1.5% Agarose gel (Table 1).
![]()
Table 1. RAPD universal markers for genotyping the entire fungal genome.
2.7. Data Analysis
Data matrix was analyzed using the Power-marker V2.35 software. Genetic diversity parameters such as major allele frequency, gene diversity and polymorphic information content were then generated using the power marker software. The genetic relationship among samples were also estimated by constructing a Phylogenetic tree through Unweighed Pair Group Method with Arithmetic Means [UPGMA] using the Mega6 Software and genetic distance where computed also using the Mega6 Software.
3. Results
3.1. Molecular Characterization and Blast Result Based on DNA ITS Sequencing
Figure 4 shows the agarose gel electrophoresis wherein an amplicon of approximately 550 bp was produced, showing positive PCR amplification. Although DNA was purified, the direct PCR resulted in a single band with the expected size.
Table 2 shows the quality of RAPD primers used in screening fungal isolates. The study showed the same numbers of observation for all the RAPD primers. T-01 marker showed the lowest major allele frequency of 0.0833, while T-10 marker has the highest value for major allele frequency of 0.6667 and an average value of 0.3958. The highest allele number was observed on T-01 RAPD marker (12) with the least value (5) obtained on T-10 and a mean value of 8.250. T-01 marker showed maximum value (0.9167) of genetic diversity, while RAPD marker T-10 had minimum value (0.5278) of genetic diversity. Primer T-01 gave a maximum value of PIC with 0.9103 (91.03%), whereas T-10 primer gave minimum
![]()
Figure 4. Agarose gel electrophoresis indicating a positive amplification of the ITS region of fungal isolates. A band size of approximately 550 bp indicates a positive amplification. Loading arrangement Mk, 1 - 9 indicates molecular marker, AkureA1a, AkureA1b, AkureA2a, AkureA2b, KwaraA1a, KwaraA1b, KwaraA2a, KwaraA2b, Ibadan A1a, Ibadan A1b, Ibadan A2a, Ibadan A2b and respectively.
PIC value of 0.5025 (50.25% polymorphism). The table shows the mean value of polymorphic information content value of the RAPD markers in this study is 0.7293 (72.93% polymorphism). The mean number of polymorphic information content value of the RAPD markers in this study is 0.7293 (72.93% polymorphism).
Table 3 gives the Agarose Gel matrix derived by scoring the presence or absence of amplification as produced by the individual RAPD primers. The study shows that all the RAPD markers produce a scoreable polymorphic band. The highest number of scoring was observed on T01 primer and the lowest number of scoring was noticed on T10 primer. Each primer sets was scored using 1 (presence of positive amplification at a particular band size) and 0 (absence of positive amplification at a particular band size).
![]()
Table 2. Quality of RAPD primers used in screening fungal isolates.
PIC—Polymorphism Information Content.
![]()
Table 3. Agarose Gel matrix derived by scoring the presence or absence of amplification as produced by the individual RAPD primers.
3.2. Sequencing Data Analysis
Figure 5 gives the phylogenetic tree of isolates based on their evolutionary relationship. The phylogenetic tree showed the evolutionary relationships among the fungal isolates were separated into two different clusters. The first cluster was further separated into three sub-clusters and the other group into a sub-cluster. The tree includes reference strains of Fusariumoxysporum and Geotrichum candidum.
Table 4 gives the genetic distance between the 12 fungal isolates in pairwise
![]()
Figure 5. Phylogenetic tree of isolates based on their evolutionary relationship constructed through Unweighed Pair Group Method with Arithmetic Means [UPGMA] using the Mega6 Software.
![]()
Table 4. Genetic distance between the 12 fungal isolates in pairwise fashion.
fashion. Genetic distances (GD) among pairs of fungi isolate strains ranged from 0.12 to 6.30, for the 12 fungal isolates in pairwise fashion, with an average of 1.32 as shown in Table 4. The smallest genetic distance obtained was observed between isolates from IbadanA1a and AkureA1a; and IbadanA2a and KwaraA1a, while the greatest distance was between isolates from AkureA1a and IbadanA2a.
4. Discussion
The cultural and morphological characteristics of isolates from two tomato varieties were confirmed and authenticated as F. oxysporum and G. candidum with the help of Mycological Atlas. All the 12 fungal isolates identified using DNA sequences of ITS and the targeted regions which were successfully amplified from all the fungal isolates was similar to the work of Akbar et al. [15], Thornton et al. [3] and Ziedan et al. [6]. The non-significant difference in the magnitude of amplified sequences of the fungal isolates compared with that from the GenBank after alignment agreed with the submissions of Si Mohammed et al. [16], Akbar et al. [15] and Ziedan et al. [6]. Moreover, according to ITS sequences alignment conducted on BLAST using NCBI (http://www.ncbi.nlm.nih.gov/), the fungal isolates revealed a 99% - 100% similarity for Fusarium oxysporum and 98% - 100% similarity for Geotrichum candidum with the related fungi documented in the GenBank which agrees with the work reported by Valinhas et al. [17]. Therefore, the name consigned to the species was in accordance with the closest match with identified species. Based on ITS sequences, the NCBI tool confirms the identity of our isolates as F. oxysporum and Geotrichum candidum, which corroborated the report of Si Mohammed et al. [16], Akbar et al. [15] and Ziedan et al. [6].
The PIC value indicates that the fungal isolates had high degree of genetic diversity. Polymorphism has been detected in other fungi as a reliable record of genetic evolution [15] [18] [19]. The same or very similar strains were isolated from widely different regions; this is similar to the work submitted by Marcelino et al. [18] and Olowe et al. [20]. Genetic distances among the strains range from 0.12 to 6.30 for the 12 fungal isolates in pairwise fashion, with an average of 1.32. Souza et al. [21] and Bruel et al. [22] obtained a mean genetic divergence of 0.65 and 0.51 between seven and sixteen commercial maize hybrids respectively. Study on molecular of F. oxysporum and G. candidum strains shows that evolutionary relationship among the strains was not determined by their location.
Appendices
Fusariumoxysporum strain Akure_A1a

Plate 1. Culture plate of Fusariumoxysporum strain.
Fusariumoxysporum strain Akure_A1b

Plate 2. Culture plate of Fusariumoxysporum strain (A).
Geotrichumcandidum strain Akure_A2a
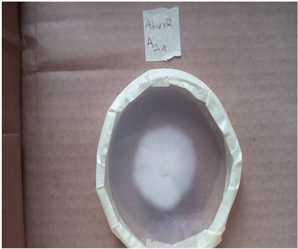
Plate 3. Culture plate ofGeotrichum candidum strain.
Geotrichumcandidum strain Ilorin_A1a
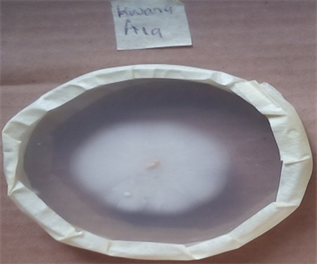
Plate 4. Culture plate of Geotrichumcandidum strain.
Geotrichumcandidum strain Ilorin_A1b
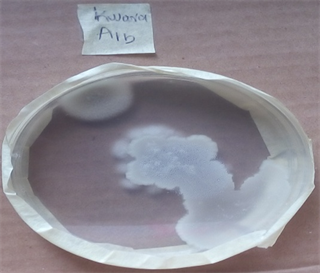
Plate 5. Culture plate of Geotrichumcandidum strain.
Fusariumoxysporum strain Ilorin_A2a
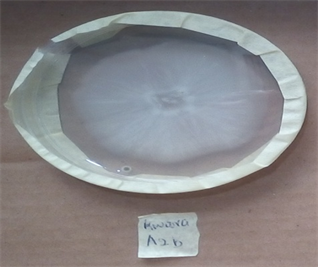
Plate 6. Culture plate ofFusarium oxysporum strain.
Geotrichumcandidum strain Ilorin_A2b
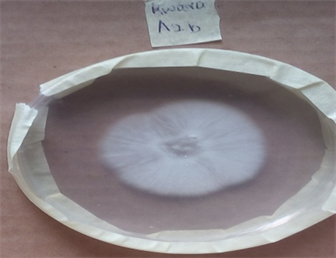
Plate 7. Culture plate of Geotrichumcandidum strain.
Fusariumoxysporum strain Ibadan_A1a
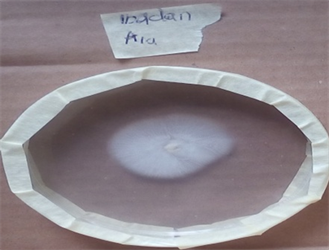
Plate 8. Culture plate of Fusariumoxysporum strain.
Geotrichumcandidum strain Ibadan_A1b
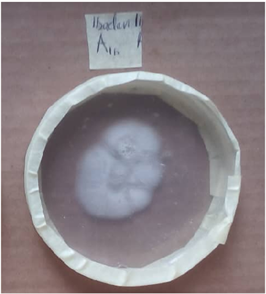
Plate 9. Culture plate of Geotrichumcandidum strain.
Geotrichumcandidum strain Ibadan_A2b
![]()
Plate 10. Culture plate ofGeotrichum candidum strain.
Sequencing Analysis
Akure
MN650245 Fusariumoxysporum strain Akure_A1a
GCAAGGTGAACTGCGGAGGGATCATTACCGAGTTTACAACTCCCAAACCCCTGTGAACATACCACTTGTTGCCTCGGCGGATCAGCCCGCTCCCGGTAAAACGGGACGGCCCGCCAGAGGACCCCTAAACTCTGTTTCTATATGTAACTTCTGAGTAAAACCATAAATAAATCAAAACTTTCAACAACGGATCTCTTGGTTCTGGCATCGATGAAGAACGCAGCAAAATGCGATAAGTAATGTGAATTGCAGAATTCAGTGAATCATCGAATCTTTGAACGCACATTGCGCCCGCCAGTATTCTGGCGGGCATGCCTGTTCGAGCGTCATTTCAACCCTCAAGCACAGCTTGGTGTTGGGACTCGCGTTAATTCGCGTTCCTCAAATTGATTGGCGGTCACGTCGAGCTTCCATAGCGTAGTAGTAAAACCCTCGTTACTGGTAATCGTCGCGGCCACGCCGTTAAACCCCAACTTCTGAATGTTGACCTCGGATCAGGTAGGAATACCCGCTGAACTTAAGCATATCAATAAGGGGAAAAA
MN650246 Fusariumoxysporum strain Akure_A1b
GTGAACATACCACTTGTTGCCTCGGCGGATCAGCCCGCTCCCGGTAAAACGGGACGGCCCGCCAGAGGACCCCTAAACTCTGTTTCTATATGTAACTTCTGAGTAAAACCATAAATAAATCAAAACTTTCAACAACGGATCTCTTGGTTCTGGCATCGATGAAGAACGCAGCAAAATGCGATAAGTAATGTGAATTGCAGAATTCAGTGATCATCGAATCTTTGAACGCACATTGCGCCCGCCAGTATTCTGGCGGGCATGCCTGTTCGAGCGTCATTTCAACCCTCAAGCACAGCTTGGTGTTGGGACTCGCGTTAATTCGCGTTCCTCAAATTGATTGGCGGTCACGTCGAGCTTCCATAGCGTAGTAGTAAAACCCTCGTTACTGGTAATCGTCGCGGCCACGCCGTTAAACCCCAACTTCTGAATGTGACCTCGGATCAGGTAGGAATACCCGCTGAACTTAAGCATATC
MN650247 Geotrichumcandidum strain Akure_A2a
AACCAAAATCGTAACAAGGTTTCCGTAGGTGAACCTGCGGAAGGATCATTAATGATTTTTAATATTTGTGAATTTACTACAAACAAAAATTTAATTTTATAGTCAAAAATAAAAAAAAAATTAAAACTTTTAACAATGGATCTCTTGGTTCTCGTATCGATGAAGAACGCAGCGAAACGCGATATTTCTTGTGAATTGCAGAAGTGAATCATCAGTTTTTCGAACGCACATTCGCACTTTCGGGGTATCCCCCAAAGTATACTTTGTTTGAGCGTTGTTTTCTCTCTTGGAATTTGCATTTTGCTTTTTCTAAAAAATCGAATCAAATTTCGTTTTGAAACTTTCAATTTATCTCAACCTCAGATCAAGTAGGATTACCCGCTGAACTTAAGCATATCAAAGGGGGGCC
MN650248 Fusariumoxysporum strain Akure_A2b
TCGTAACAAGGTCTCCGTTGGTGAACCAGCGGAGGGATCATTACCGAGTTTACAACTCCCAAACCCCTGTGAACATACCACTTGTTGCCTCGGCGGATCAGCCCGCTCCCGGTAAAACGGGACGGCCCGCCAGAGGACCCCTAAACTCTGTTTCTATATGTAACTTCTGAGTAAAACCATAAATAAATCAAAACTTTCAACAACGGATCTCTTGGTTCTGGCATCGATGAAGAACGCAGCAAAATGCGATAAGTAATGTGAATTGCAGAATTCAGTGAATCATCGAATCTTTGAACGCACATTGCGCCCGCCAGTATTCTGGCGGGCATGCCTGTTCGAGCGTCATTTCAACCCTCAAGCACAGCTTGGTGTTGGGACTCGCGTTAATTCGCGTTCCTCAAATTGATTGGCGGTCACGTCGAGCTTCCATAGCGTAGTAGTAAAACCCTCGTTACTGGTAATCGTCGCGGCCACGCCGTTAAACCCCAACTTCTGAATGTTGACCTCGGATCAGGTAGGAATACCCGCTGAACTTAAGCATATCAATAAGCGGAGGAA
Kwara
MN650249 Geotrichumcandidum strain Kwara_A1a
AACAATCGTAACAAGGTTTCCGTAGGTGAACCTGCGGAAGGATCATTAATGATTTTTAATATTTGTGAATTTACTACAAACAAAAATTTAATTTTATAGTCAAAAATAAAAAAAAAATTAAAACTTTTAACAATGGATCTCTTGGTTCTCGTATCGATGAAGAACGCAGCGAAACGCGATATTTCTTGTGAATTGCAGAAGTGAATCATCATTTTTCGAACGCACATTCGCACTTTCGGGGTATCCCCCAAAGTATACTTTGTTTGCGTTGTTTTCTCTCTTGGAATTTGCATTTTGCTTTTTCTAAAAAATCGAATCAAATTTCGTTTTGAAACTTTCAATTTATCTCAACCTCAGATCAAGTAGGATTACCCGCTGAACTTAAGCATATCAAAGGCATCAC
MN650250 Geotrichumcandidum strain Kwara_A1b
ATCGTAACAAGGTTTCCGTAGGTGAACCTGCGGAAGGATCATTAATGATTTTTAATATTTGTGAATTTACTACAAACAAAAATTTAATTTTATAGTCAAAAATAAAAAAAAAATTAAAACTTTTAACAATGGATCTCTTGGTTCTCGTATCGATGAAGAACGCAGCGAAACGCGATATTTCTTGTGAATTGCAGAAGTGAATCATCAGTTTTTCGAACGCACATTCGCACTTTCGGGGTATCCCCCAAAGTATACTTTGTTTGAGCGTTGTTTTCTCTCTTGGAATTTGCATTTTGCTTTTTCTAAAAAATCGAATCAAATTTCGTTTTGAAACTTTCAATTTATCTCAACCTCAGATCAAGTAGGATTACCCGCTGAACTTAAGCATATCAAAGGG
MN650251 Fusariumoxysporum strain Kwara_A2a
TCTCCCTTGGTGAACCAGCGGAGGGATCATTACCGAGTTTACAACTCCCAAACCCCTGTGAACATACCACTTGTTGCCTCGGCGGATCAGCCCGCTCCCGGTAAAACGGGACGGCCCGCCAGAGGACCCCTAAACTCTGTTTCTATATGTAACTTCTGAGTAAAACCATAAATAAATCAAAACTTTCAACAACGGATCTTTGGTTCTGGCATCGATGAAGAACGCAGCAAAATGCGATAAGTAATGTGAATTGCAGAATTCAGTGAATATCGAATCTTTGAACGCACATTGCGCCCGCCAGTATTCTGGCGGGCATGCCTGTTCGAGCGTCATTTCAACCCTCAAGCACAGCTTGGTGTTGGGACTCGCGTTAATTCGCGTTCCTCAAATTGATTGGCGGTCACGTCGAGCTTCCATAGCGTAGTAGTAAAACCCTCGTTACTGGTC
MN650252 Geotrichumcandidum strain Kwara_A2b
GACAATCGTAACAAGGTTTCCGTAGGTGAACCTGCGGAAGGATCATTAATGATTTTTAATATTTGTGAATTTACTACAAACAAAAATTTAATTTTATAGTCAAAAATAAAAAAAAAATTAAAACTTTTAACAATGGATCTCTTGGTTCTCGTATCGATGAAGAACGCAGCGAAACGCGATATTTCTTGTGAATTGCAGAAGTGAATCATCATTTTTCGAACGCACATTCGCACTTTCGGGGTATCCCCCAAAGTATACTTTGTTTGCGTTGTTTTCTCTCTTGGAATTTGCATTTTGCTTTTTCTAAAAAATCGAATCAAATTTCGTTTTGAAACTTTCAATTTATCTCAACCTCAGATCAAGTAGGATTACCCGCTGAACTTAAGCATATCAAAGGCAT
Ibadan
MN650253 Fusariumoxysporum strain Ibadan_A1a
CTTAGAACCTGCGGAGGGATCATTACCGAGTTTACAACTCCCAAACCCCTGTGAACATACCACTTGTTGCCTCGGCGGATCAGCCCGCTCCCGGTAAAACGGGACGGCCCGCCAGAGGACCCCTAAACTCTGTTTCTATATGTAACTTCCGAGTAAAACCATAAATAAATCAAAACTTTCAACAACGGATCTCTTGGTTCTGGCACGATGAAGAACGCAGCAAAATGCGATAAGTAATGTGAATTGCAGAATTCAGTGAATCATCGAATCTTTGACCGCACATTGCGCCCGCCAGTATTCTGGCGGGCATGCCTGTTCGAGCGTCATTTCAACCCTCAAGCACAGCTTGGTGTTGGGACTCGCGTTAATTCGCGTTCCTCAAATTGATTGGCGGTCACGTCGAGCTTCCATAGCTAGTAGTAAAACCCTCGTTACTGGTAATCGTCGCGGCCACGCCGTTAAACCCAACTTCTGAATGTTGA
MN650254 Geotrichumcandidum strain Ibadan_A1b
ACCCCCCAATCGTAACAAGGTTTCCGTAGGTGAACCTGCGGAAGGATCATTAATGATTTTTAATATTTGTGAATTTACTACAAACAAAAATTTAATTTTATAGTCAAAAATAAAAAAAAAATTAAAACTTTTAACAATGGATCTCTTGGTTCTCGTATCGATGAAGAACGCAGCGAAACGCGATATTTCTTGTGAATTGCAGAAGTGAATCATCATTTTTCGAACGCACATTCGCACTTTCGGGGTATCCCCCAAAGTATACTTTGTTTGCGTTGTTTTCTCTCTTGGAATTTGCATTTTGCTTTTTCTAAAAAATCGAATCAAATTTCGTTTTGAAACTTTCAATTTATCTCAACCTCAGATCAAGTAGGATTACCCGCTGAACTTAAGCATATCAAAGGCATG
MN650255 Geotrichumcandidum strain Ibadan_A2a
CCATTGACAAACGTAACAAGGTTTCCGTAGGTGAACCTGCGGAAGGATCATTAATGATTTTTAATATTTGTGAATTTACTACAAACAAAAATTTAATTTTATAGTCAAAAATAAAAAAAAAATTAAAACTTTTAACAATGGATCTCTTGGTTCTCGTATCGATGAAGAACGCAGCGAAACCCGATATTTCTTGTGAATTGCAGAAGTGAATCATCATTTTTCGAACGCACATTCGCACTTTCGGGGTATCCCCCAAAGTATACTTTGTTTGCGTTGTTTTCTCTCTTGGAATTTGCATTTTGCTTTTTCTAAAAAATCGAATCAAATTTCGTTTTGAAACTTTCAATTTATCTCAACCTCAGATCAAGTAGGATTACCCGCTGAACTTAAGCATATCAAAGGCATCGT
MN650256 Geotrichumcandidum strain Ibadan_A2b
ACCCCCAAAATCGTAACAAGGTTTCCGTAGGTGAACCTGCGGAAGGATCATTAATGATTTTTAATATTTGTGAATTTACTACAAACAAAAATTTAATTTTATAGTCAAAAATAAAAAAAAAATTAAAACTTTTAACAATGGATCTCTTGGTTCTCGTATCGATGAAGAACGCAGCGAAACGCGATATTTCTTGTGAATTGCAGAAGTGAATCATCATTTTTCGAACGCACATTCGCACTTTCGGGGTATCCCCCAAAGTATACTTTGTTTGCGTTGTTTTCTCTCTTGGAATTTGCATTTTGCTTTTTCTAAAAAATCGAATCAAATTTCGTTTTGAAACTTTTAATTTATCTCAACCTCAGATCAAGTAGGATTACCCGCTGAACTTAAGCATATCAAAGGCATTTAAAA
![]()
Plate 11. 12 SAMPLES (P-Z, Z1) RAPD_T01. RAPD profiles of the twelve fungi isolated from two tomato accessions collected from different locations as detected by RAPD primers OPT-01 (5’-GGGCCACTCA-3’), M = 100 bp marker. M is molecular marker of low range DNA ladder.
![]()
Plate 12. 12 SAMPLES (P-Z, Z1) RAPD_T10. RAPD profiles of the twelve fungi isolated from two tomato accessions collected from different locations as detected by RAPD primers OPT-10 (5’-CCTTCGGAAG-3’), M = 100 bp marker.
![]()
Plate 13. 12 SAMPLES (P-Z, Z1) RAPD_B08. RAPD profiles of the twelve fungi isolated from two tomato accessions collected from different locations as detected by RAPD primers OPB-08 (5’-GTCCACACGG-3’), M = 100 bp marker.
![]()
Plate 14. 12 SAMPLES (P-Z, Z1) RAPD_T02. RAPD profiles of the twelve fungi isolated from two tomato accessions collected from different locations as detected by RAPD primers OPT-02 (5’-GGAGAGACTC-3’), M = 100 bp marker.