Soil Moisture Retrieval Quantitatively with Remotely Sensed Data and Its Crucial Factors Analysis ()
1. Introduction
The Biospheric Aspects of the Hydrological Cycle (BAHC), one of the core projects of the International Geosphere Biosphere Programme (IGBP) coordinated by the International Council for Science (ICSU), was established to study the role of vegetation in the hydrological interactions between the land surfaces and atmosphere. One objective of BAHC is to determine the biospheric controls of the hydrological cycle through field measurements for the purpose of developing models of energy and water fluxes in the soil-vegetation-atmosphere system at temporal and spatial scales ranging from vegetation patches to General Circulation Model (GCM) grid cells [1,2]. This encouraged us to focus not only on the water itself, but also on its correlation factors such as the vegetation, the ground and so on when studying water environments and water resources, especially for water closely related to vegetation [3–9]. Soil moisture observations are one of these studies. Soil moisture is a key component of the hydrological cycle, controlling the partitioning of precipitation between runoff, evapotranspiration and deep infiltration. As a link between the biosphere and the edaphic zone, soil water plays a crucial role in terrestrial ecosystems by determining plant growth. If the soil water level falls below a species-specific threshold, plants experience water stress, and decreased soil moisture under warmer conditions can inhibit photosynthesis [10]. Soil moisture observations over large areas are increasingly required in a range of environmental applications including meteorology, hydrology, water resource management and climatology. Remote sensing can provide considerable cost-and time-savings when applied to mapping soil moisture over large areas. Various approaches have been developed over the past two decades to infer near-surface soil moisture from remote sensing measurements of surface temperature, radar backscatter and microwave brightness temperature [11–15].
In this paper, the soil moisture in study area was retrieved with Landsat Enhance Thematic Mapper Plus (ETM+) data and Advanced Spaceborne Thermal Emission and Reflection Radiometer (ASTER) data first, then, the influence factors of soil moisture was analyzed. The objective of this paper is to provide a new method for soil moisture monitoring.
2. Methods
2.1. Study Area
In this paper, the Maoergai area (from latitude 32°20' to 32°40' north and from longitude 103°00' to 103°30' east, shown as Figure 1), located in the upper Minjiang river, northern Sichuan province, in the southwest of China, was selected as the study area. The upper Minjiang river area has been famous as a “natural barrier” and the “green lake” of Sichuan province for a long time, where the forest area reached 12 thousand km2, almost 50% of the whole 24.5 thousand km2, 600 years ago. However, with the destruction of the forest, it had been reduced to only 7.4 thousand km2, or about 30% of the whole area, by 1950. Meanwhile, the upper Minjiang is transforming from a pristine region to one with an increasing level of human activity, which leads to a degraded ecosystem in the area. The study area is a specific area in the upper Minjiang River with regard to its vegetation, soil, and mountainous characters, thus, the study result can be popularized in Minjiang river basin.
2.2. Data
In this study, we collected the soil type, groundwater and vegetation distribution data of the study area for the year 2000, which were collected within the gold-eye project subsidized by National High Technology Research and Development Program (HTRDP) [16], 48 ground control points (GCPs) distributed averagely in study area, the moisture of representative bare soils in the study area , the moisture of representative vegetations in the study area , all spectrums of representative soil and representative vegetation in the study area, Landsat ETM+ data of 10 July 2002 and ASTER data of 2 November 2003 of the study area for retrieving soil moisture. The remotely sensed data have been registered to UTM WGS-84 coordinates using the GCPs to allow co-registration of the ground data.
2.3. Retrieval and Analysis Processes
The retrieval and analysis processes were divided into 3 parts in this paper: First, pre-process of remotely sensed data, including geometric register, radiometric correction(radiometric calibration, topographic correction and atmospheric correction); Second, retrieval of biophysical parameter for land cover, including vegetation indices, soil brightness, soil wetness, greenness and surface temperature; Third, soil moisture retrieval with Ts/NDVI model and soil moisture analysis with soil type distribution data, vegetation distribution data and groundwater distribution data.
To better understand the soil moisture retrieval and analysis processes, a flow chart is provided in Figure 2.
3. Results
3.1. Soil Moisture Retrieval from Landsat ETM+ Data
Surface temperature (Ts, Kelvin), normalized difference vegetation index (NDVI) and the feature special diagram retrieved from ETM+ data of July 2002 in study area were shown in Figure 3.
To calculate the relative soil moisture, the dry edge linear equation and wet edge linear equation of Ts / NDVI feature space should be calculated first. The dry and wet edge linear equations are calculated as follows:
Dry edge:
Ts-max =-18.356343*NDVI+307.57766 r=0.47030258(1)
Wet edge:
Ts-min =0.68168266*NDVI+288.26377 =0.30658477(2)
With the data of soil moisture and experiential formulas [1,2,4,8–10] in study area as a reference, the relativesoil moisture of any point in ETM+ data’s Ts / NDVI feature space was calculated as Equation 3, where RSM is the relative soil moisture of any point, T is the surface temperature of the point, TD is the surface temperature of dry edge which is corresponding to the NDVI of the point and Tw is the one of wet edge.
 (3)
(3)
Then, with the Equation 3, the relative soil moisture of

Figure 2. Flow chart of the soil moisture retrieval and analysis.

Figure 3. NDVI, surface temperature and feature space diagram retrieved from ETM+ data.
every pixel can be calculated. With the relative data of soil moisture content data and investigation data in study area as a reference, the practical soil moisture retrieved from ETM+ of July 2002 in study area is shown as Figure 4. According to Figure 4, the soil moisture was relatively high in July 2002 in study area; most points have a soil moisture between 18% and 25%, while few points have a soil moisture less than 15%. Contrasting the soil moisture map with the terrain and false colour maps, we can get that the soil moisture have a relatively high relation with the distribution of vegetation and terrain: the point near to water has a higher soil moisture value, vice versa; the point far from water has a relatively low soil moisture value.
3.2. Soil Moisture Retrieval from ASTER Data
The surface temperature (TS, Kelvin), the normalized difference vegetation index (NDVI) and the feature special diagram retrieved from ASTER data of November 2003 in study area were shown as Figure 5.
As the data process of ETM+ data above, the dry edge linear equation and wet edge linear equation in ASTER TS/ NDVI feature space were calculated first, shown as Equations (4) and (5).
Dry edge:
TS-max =-35.698122*NDVI+307.18527 r =0.78242239 (4)
Wet edge:
TS-min =7.9501126*NDVI+271.93125 r =0.64890765 (5)
With the data of soil moisture and experiential Formulas [17] in study area being as a reference, the relative soil moisture of any point in ETM+ data’s TS/ NDVI feature space was calculated as Equation 6. Where RSM is the relative soil moisture of a point, T is the surface temperature of the point, and TD is the surface temperature of
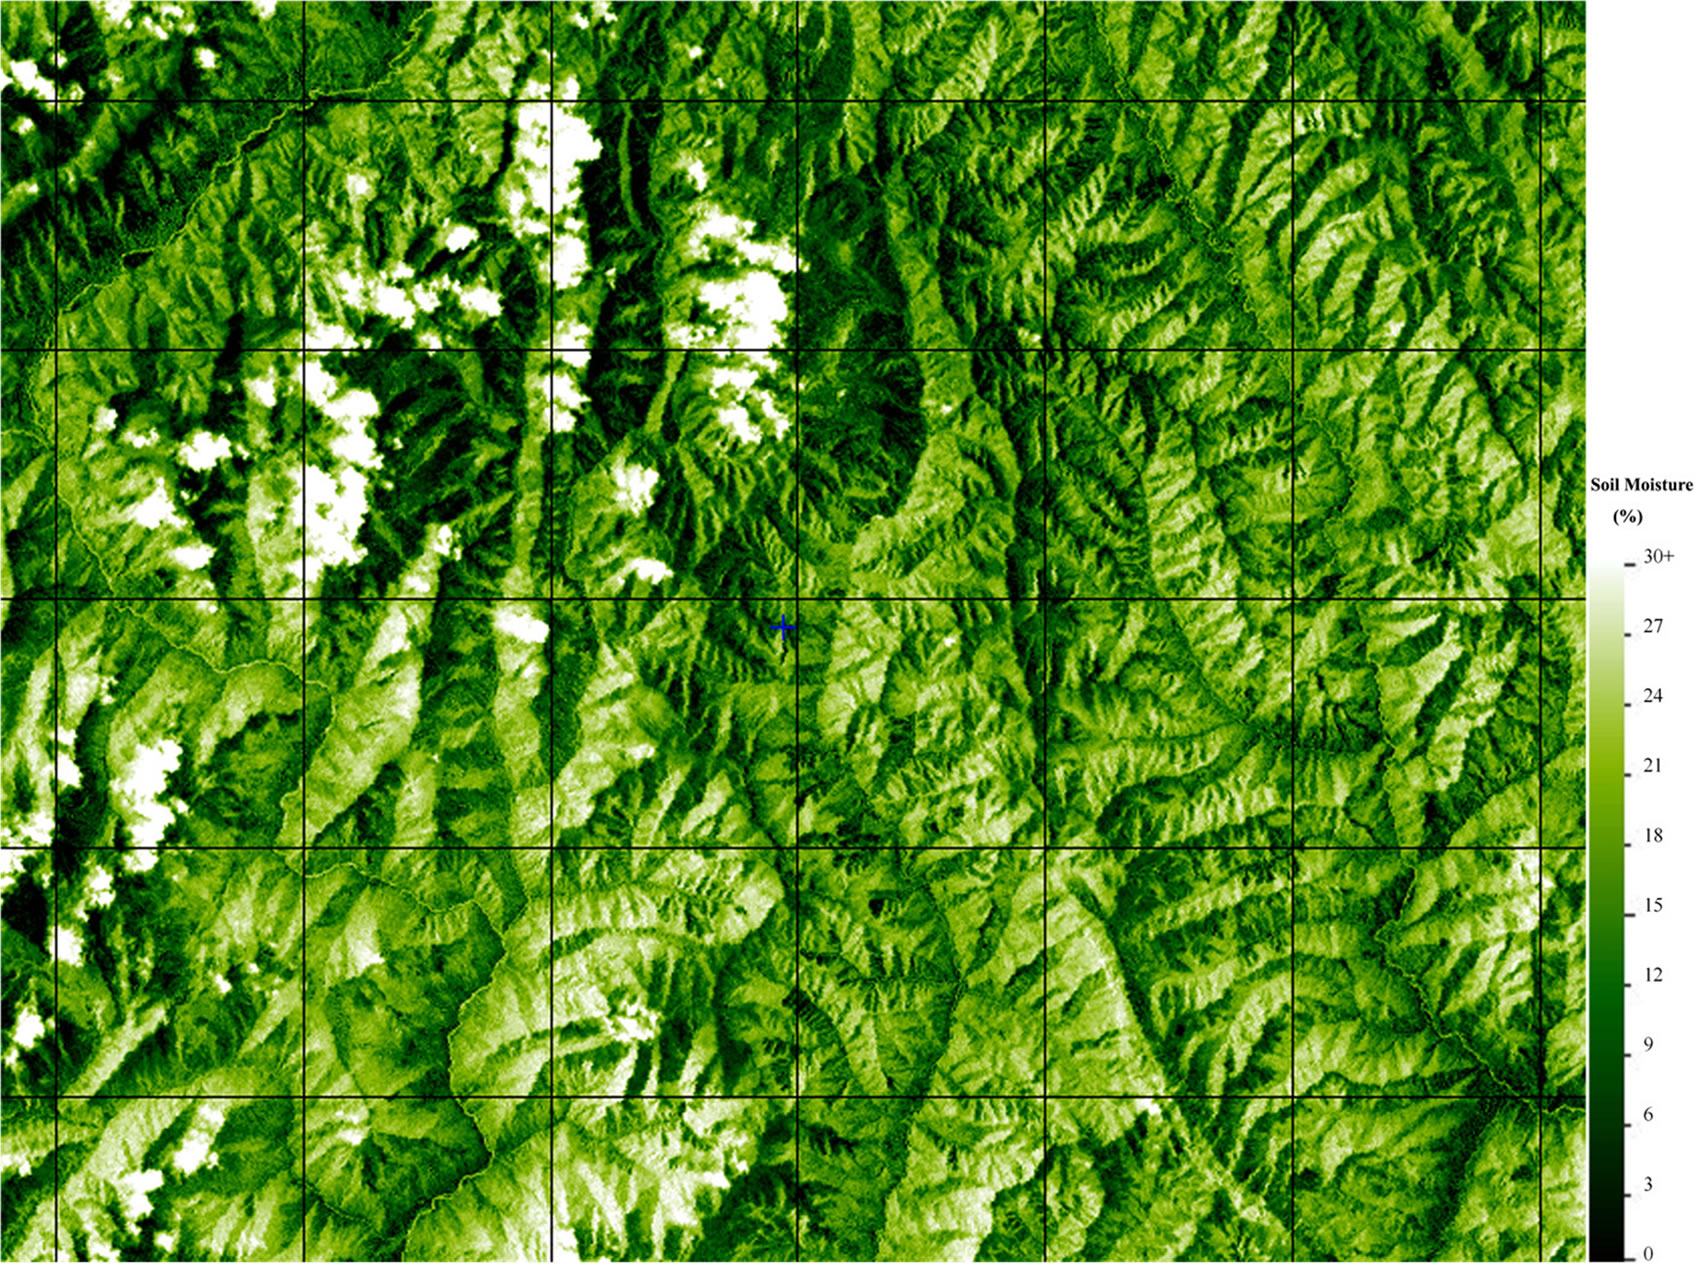
Figure 4. Overlaid map of groundwater distribution map with the soil moisture map retrieved from Remotely Sensed
data. (White lines are the boundaries of groundwater, red words are groundwater codes).

Figure 5. NDVI, surface temperature and feature special diagram retrieved from ASTER data.
dry edge.
 (6)
(6)
Then, with the Equation 6, the relative soil moisture of every pixel can be calculated. With the relative data of soil moisture content data and investigation data in study area being as a reference, the practical soil moisture retrieved from ETM+ of July 2002 in study area was shown as Figure 6. According to Figure 6, the soil moisture was widely distributed in November 2003 in study area, between 5% and 25%, the reason is mostly like that it was the time when autumn was changing into winter with some bare land and some evergreen woods, leading to a various kinds of soil moisture distribution but most between 10% and 20%, which was consistent with practical situation. Some points have soil moisture of 0, the reason is mostly like that the soil moisture of bare rock and hardened soil in this season was very low. Meanwhile, some points have relatively high soil moisture, the
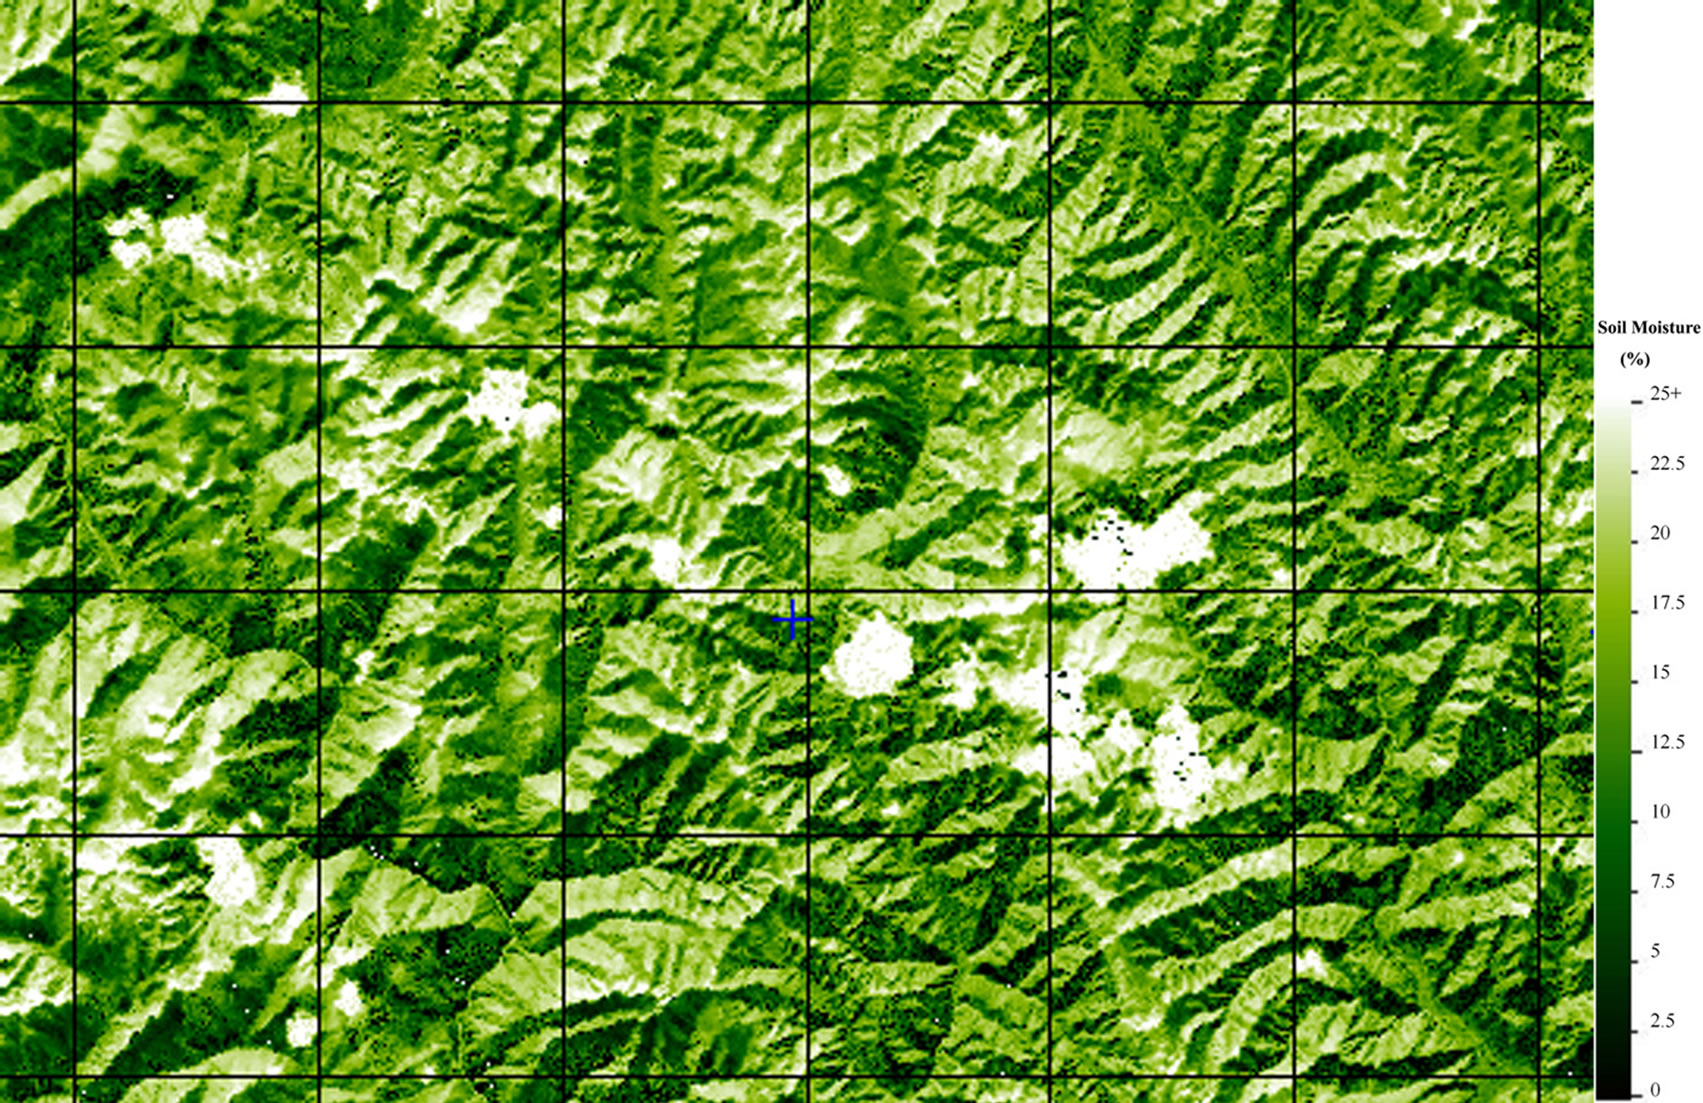
Figure 6. Soil moisture image by ASTER in research area (%).
reason is mostly like that snow and clouds exist in ASTER data.
Contrasting Figure 4 with Figure 6, the soil moisture retrieved from ASTER data of November 2003 in study area has a relatively lower value than that retrieved from ETM+ of July 2002, the reason is that there is less water in winter but more in summer in study area.
4. Discussion
From the results above, we can see that soil moisture was closely related to soil type, vegetation type and water. In order to make clearer the relationship between soil moisture and soil type, vegetation type and water, the distribution map of soil moisture was overlaid on the distribution map of vegetation type, soil type and water system.
Figure 7 is the overlaid map of the soil type distribution map with the soil moisture distributed map retrieved from ETM+ and ASTER. From the contrast of Figure 7(a) and 7(b), we can see that soil moisture distributed map is deeply related to soil type, that is to say, soil moisture is different from one kind soil to another. As a whole, the soil moisture of brown soil (with code of B210) and dark brown soil (with code of B310) is higher, but the soil moisture of terra cinnamon soil’ (with code of C212) is lower, the soil moisture of other soil types are mid. However, the soil moisture of the same soil is different with the place change, which is similar in the two maps. Also, the soil moistures of different soils in different seasons are different.
Figure 8 is the overlaid map of the groundwater distribution map with the soil moisture distributed map retrieved from ETM+ and ASTER. From the contrast of Figure 8(a) and 8(b), we can see that the distribution of groundwater has some effect on soil moisture distribution, but the influence is weaker than the soil types’. General speaking, the influence of groundwater on soil moisture is stronger in summer than it is in winter; the reason is that the evapotranspiration is stronger in summer.