Cytotoxic Effect of Dexamethasone Restricted to Noncycling, Early G1 Phase of Melanoma Cells ()
1. Introduction
Although malignant melanoma has not generally been regarded a hormonally responsive neoplasm, there are some evidences suggesting that melanoma may respond to the hormonal condition of the host. Pregnancy was reported to be associated with unfavorable prognosis in stage II disease [1]. However, adrenalectomy for melanoma metastatic to the adrenal gland provides good palliation of complete regression of distant metastatic melanoma after bilateral adrenalectomy, suggesting a possible role for adrenal hormones in modifying melanoma progression in certain patients [2]. A few reports have been published about the moderate sensitivity of human as well as animal melanoma to the action of glucocorticoid steroid hormones. Bregman et al., [3] found that dexamethsone at a concentration of 1 uM inhibited the colony formation in a human melanoma cell strain (C8146c) by 60%. Moreover, Ramirez et al., [4], showed 85% tumor rejection in mice challenged with B16 melanoma after administration of anti glucocorticoid-induced TNF receptor family related protein. Recently, Banciu et al., [5], reported that a glucocorticoid prednisolone phosphate encapsulated in long-circulating liposomes exerts antitumor activity through the inhibition of tumor angiogenesis. The marked if not complete reversal of the inhibition of cell proliferation by glucocorticoid [6] raised the question as to what the performance of the cells might be in terms of RNA, protein and melanin synthesis during their arrested or retarded proliferation. Therefore the aim of our study was directed to investigate in what phase of the cell cycle the cells would be the most sensitive to the inhibition of proliferation induced by dexamethasone.
2. Materials and Methods
2.1. Cells and Cell Culture
A human melanoma cell line M-5A was received at unknown passage level from liquid nitrogen store National Cancer Institute, Cairo University. Its characteristics have been described [7]. Cells were grown in modified minimum essential Eagle’s medium to which penicillin (100 i.u./ml) and streptomycin (100 ug/ml) had been added. The medium contained 10% newborn calf serum inactivated by heating at 56˚C for 30 min. Cells were cultured at 3˚C in humidified 5% CO2 atmosphere.
2.2. Cell Separation
Cells were separated according to size by velocity sedimentation at unit gravity in a linear density gradient from 2% to 8% BSA on PBS. The chamber as developed by Tulp et al. (1980) [8] (Figure 1) contained flow deflecttors which permitted undisturbed introduction of the cushion liquid and density gradient and the undisturbed layering of the cells. The chamber was sterilized by filling it completely with 2% formaldhyde in PBS for 24 hours. It was washed thoroughly with sterile bidistilled water followed by sterile PBS. After that the chamber was covered with aluminum foil and kept at 4˚C. The gradient mixer and other glassware were dry sterilized at 250˚C overnight. At the time of experiment, the chamber was removed from the cold room and filled completely via inlet B with sterile cushion liquid consisting of 10% Ficoll (average molecular weight 400,000, Pharmacia, Sweden) in PBS. All solutions were introduced into the chamber from their reservoir by the force of gravity. A linear density gradient (400 ml), prepared from two different solutions of BSA (Sigma, fraction V) in PBS (2 and 8%, respectively, sterilized by ultrafilteration) was admitted to the chamber via inlet A within 25 min. by letting cushion liquid flow out via B. After that a disposable syringe was filled with 20 ml of a cell suspension in 0.5% BSA in PBS. The plunger was removed and the syringe was connected to A by a piece of sterile silicon tubing. The cells were let to flow into the chamber within 1 min followed by an overlay of 25 ml PBS until the meniscus of the fluid had reached the cylindrical part of the chamber. The cells were then allowed to sediment at unit gravity for about 90 min at 4˚C. Routinely, 50 × 106 – 60 × 106 cells were thus processed. After sedimentation the content of the separation chamber were collected via A by allowing cushion liquid to flow into chamber via B. The first 150 ml were discarded and subsequently fractions of 10 ml each were collected. Selected fractions were studied for DNA per cell content by flowcytomter.

Figure 1. Schematic presentation of the system for separation of cells according to cell size in linear density gradient at unit gravity.
Moreover, their capacity for cell proliferation was determined using colony forming assay procedure described before [9].
2.3. Determination of the Rate of (3H) Uridine and (14C) Leucine Incorporation
The rate of (3H) uridine and (14C) leucine incorporations were determined as described before (9). (6-3 H) uridine (0.1 Ci.ml, 23.4 Ci/mmole) and L-(14C) leucine (0.1 Ci/ml, 340 mCi/mmole) were obtained from Amersham International, Ltd, England.
2.4. Measurement of Cell Volume
Cell volumes were measured using coulter counter (Model ZF) equipped with a multichannel analyzer (Tracor, TN.1705) and an XY-plotter (Tracor, TA-1148) which counts cells in a series of channels. The cell number was automatically plotted against cell size. Exponentially growing cells were inoculated into 75 cm2 Falcon flasks and 24 hours later, dexamethsone was supplied at a dose of 12.5 uM for one hour.
2.5. Determination of Relative Melanin Content.
Melanin content was measured by the colorimetric method described by Whittaker [10]. Cell pellets containing 5 × 10⁶ cells placed induplicate Beckman microfuge polyethylene tubes were suspended, lysed in 0.5 ml of deionized H2O, and subjected to 2 cycles of freezing and thawing. Perchloric acid was added to a final concentration of 0.5 N, and the suspension was kept on ice for 10 mm and then centrifuged for 5 mm in a Beckman Model B microfuge. The pellets were extracted twice more with 0.5 N HCIO4 followed by 2 extractions with a cold mixture of ethyl alcohol: ethyl ether (3: 1, v/v) and a final extraction with ethyl ether. The pellets were air dried, 1 ml of 0.85 N KOH was added, and the pellets were dissolved by heating to 60˚C for 10 min. After insoluble residue was pelleted the supernatant was cooled to room temperature and the absorbance at 400 nm was measured in a Beckman double-beam spectrophotometer. The relative melanin content is expressed as the absorbance at 400 nm per 5 × 10⁶ cells.
3. Results
3.1. Proliferation Capacity of Separated Cells after Dexamethasone Treatment
The initial fractions obtained from the gravity sedimentation chamber contained exclusively G1-phase cells or at least cells with diploid DNA per cell content as shown by flowcytomter (Figure 1). Subsequent fractions were enriched in S and G2/M cells, respectively. Attempts to obtain fractions containing predoniantly S and /or G2/M

Figure 2. Cell cycle distribution of fractions of M-5A cells obtained by cell separation at unit gravity. A, untreated separated cells; A0, untreated unseparated control; B, Cells treated with 12.5 uM dexamethasone for one hour and then separated; B0, Treated unseparated control.
cells, however, remained unsuccessful. Figure 2 showed The first 5-6 fractions exhibited a very low capacity for colony formation (Table 1). However, this capacity increased sharply in the pure G1 cell fractions with increasing fraction number (149 colonies with cells exclusively with G1 compared to 35 colonies in cells with 50% G1). Moreover, there was 93% inhibition in cell proliferation after dexamethasone treatment in fraction contains 100% G1, while there was only 29% inhibition in fraction contains 50% G1.
3.2. Incorporation of (3H) Uridine and (14C) Leucine by Dexamethsone Treated Cells
Table 2 showed the effect of dexamethsone (12.5 uM) treatment on the incorporation of precursors of RNA and protein into M-5A melanoma cells. There was stimulation of (3H) uridine incorporation in M-5A cells starting from 24 hours after treatment which continued till 96 hours (Table 2). (14C) leucine incorporation was also sig
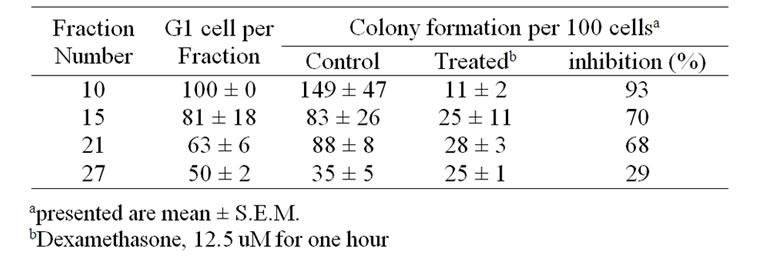
Table 1. Effect of treatment with dexamethasone on the proliferation of melanoma M-5A cells fractionated according to their position in the cell cycle.
nificantly stimulated (52 and 87% increase compared to control, 24 and 48 hours after treatment, respectively).
3.3. Changes in Cell Volume after Treatment with Desxamethasone
It was noticed microscopically that M-5A cells increased in size after dexamethasone treatment. Therefore, the effect of dexamethsone treatment on the cell volume was investigated in more detail in the cells the frequency distribution curve for control and treated cells obtained after 72 hours is depicted in Figure 3.
M-5A cells showed an increased frequency of largedsized cells 72 hours after dexamethsone treatment compared to control cells.
3.4. Melanin Synthesis after Treatment with Dexamethsone.
Table 3 showed the melanin content of M-5A cells, three days after dexamethsone treatment at a dose level of 0.25 to 12.5 uM for 60 min. Dexamethsone treatment showed an increase in the melanin content in M-5A cells by 14 and 153%, respectively. Moreover, there was a concomitant inhibition of cell proliferation from 49 to 76% at dose level of 0.25 to 12.5 uM, respectively.