1. Introduction
Biosphere reserves have a primary function of reconciling conservation and sustainable use of ecosystem services for the subsistence of communities. Different types of ecosystems or species assure different functions and services. In the Sahelian ecosystems of Ferlo, ligneous forage in general and Pterocapus lucens in particular plays an ecological and socio-economic importance. Indeed, herbaceous resources are insufficient to ensure a proper feed balance throughout the annual cycle; trees are the only recourse for farmers to ensure the survival of animals during the lean period. They help to maintain the balance of fragile ecosystems by increasing the structure and recycles soil nutrients [1] [2] . Pterocarpus lucens is one of the two most palatable species to livestock, but also the most pruned by the shepherds in the pastoral zone of Ferlo. It contributes to the production of wood and it is the most used species as timber service to local communities [3] . This species also has a high potential for carbon sequestration. The syntheses of knowledge on the productivity of savannas [4] -[8] have revealed the complexity of the task and the diversity of responses that can be carried out while dealing with the productivity of savannas [9] . Thus, for a better estimation of the production of tree and shrub formations, it is necessary to find methods that take into account the different productions, diversity and dynamics of woody vegetation [10] . Those estimations are necessary to establish a precise balance between the needs and resources, particularly with regard to firewood [4] . The current study carried out in the Biosphere Reserve of Ferlo (Northern Senegal) aimed at quantifying the forage and timber production of Pterocarpus lucens and its carbon sequestration.
2. Material and Methods
2.1. Site Location
The study was undertaken in the rural community of Velingara-Ferlo in the northern Senegal (14˚24'N - 16˚11'N latitude and 13˚07'W - 14˚51'W longitude) (Figure 1). It is situated between the administrative regions of Matam, Louga and Saint-Louis. Three main ethnic groups prevailed (Peuls, Wolofs and Moors) with a more dominance of Peuls. Ferlo is established on sandy dune formations of the continental terminal. The landscape is marked with slopes lower than 3% [11] affecting evolution of the mediums and discriminated three main types of soil: sandy soils, a gradient of clayed-sandy to clayed soils and lateritic soils. The climate is sudano-sahelian characterized by a three-month rainy season with high thermal amplitude. The maximum temperature reached 40.4˚C in May. The annual average temperature is 28.6˚C while the minimal monthly average temperatures are 14.1˚C in January.
Precipitations are concentrated in July, August and September. The Ranerou rain station averaged 474 mm (from 1951 to 2011). Since 1970, more than 25% of the annual rain is lower than the dry inter-annual mean value as these years belong to the driest ones. Chorologically, the biosphere reserve holds both sahelian formations and sudanian savannas. The woody layer is dominated by shrubs with mainly Combretum glutinosum, Pterocarpus lucens, Guiera senegalensis, Grewia bicolor, Acacia Senegal, Balanites aegyptiaca, etc. The herbaceous layer is marked by grass species such as Cenchrus biflorus, Schoenfeldia gracilis, Eragrostis tremula and Dactyloctenium aegyptium.
2.2. Plant Material
The plant material used is Pterocarpus lucens (Photo 1). It is a shrub or small tree up to 12 m exceptionally high, which grows in very dry areas where development depends on the nature and depth of the soil [12] . The leaves are alternate, odd-pinnate and flowering occurs in dry season, just before or at the time of leafing. This is a species that occurs in the Sahel-Sudanian savannas in Sudanese from Senegal to Ethiopia [13] . It’s a major forage species in the pastoral zone of Senegal.
The population structure was established on the exhaustive list of 57 plots of 30 × 30 m (900 m2) basis [14] . On each timber, we measured the circumference of the trunk at 0.30 m above the ground [15] , total height, the
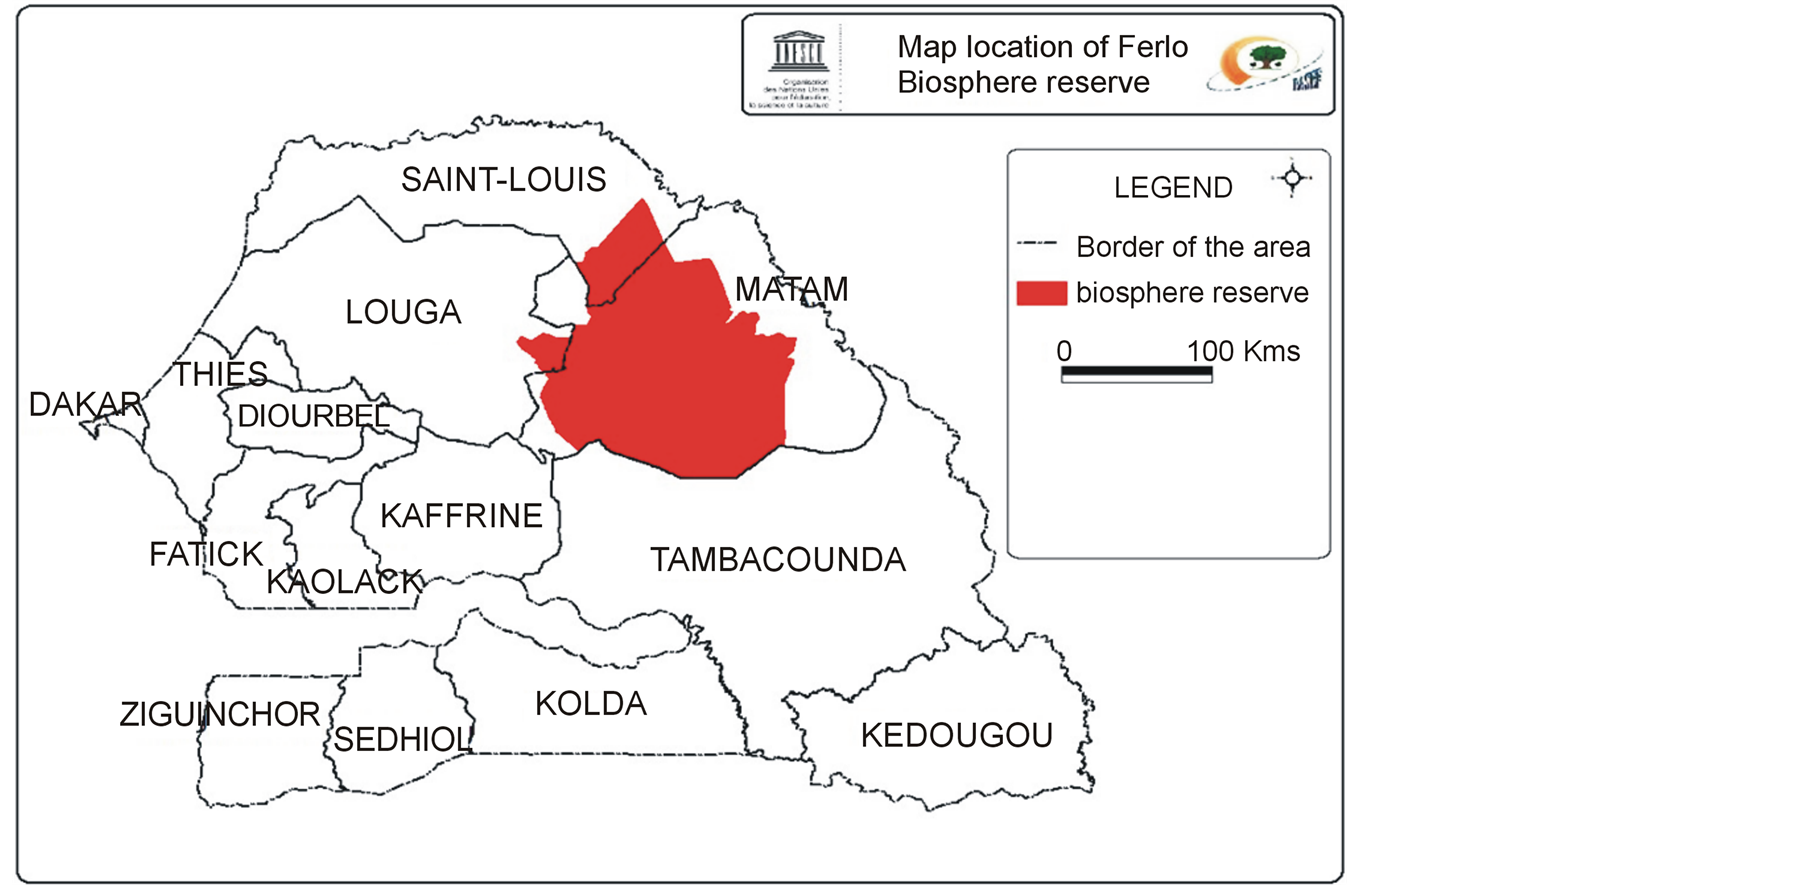
Figure 1. Map of the biosphere reserve of ferlo.
height at the first branch, the diameter (North-South, East-West) of the crown. In order to avoid damages to sampled trees, we chose different types of branches to represent the tree. For each branch, we measured length and circumference. Then we collected all the leaves and cut the wood into discs. All harvested leaves and cut wood discs are put in a bag and weighed (Figure 2) using a spring balance. Data collection was conducted in September 2011. Samples were collected (leaves and discs of wood) on 40 trees and returned to the laboratory to determine the dry matter after oven drying at 85˚C to constant weight. This method allowed establishing regression equations to link leaf phytomass to the basal circumference and length of the corresponding branches [16] at one hand and the amount of wood with the same dimensional parameters at other.
2.3. Statistical Analysis
Pterocarpus lucens trees distribution within population was adjusted to the Weibull function, commonly nowadays used in forestry surveys [17] -[20] .
The Weibull distribution is as follows:
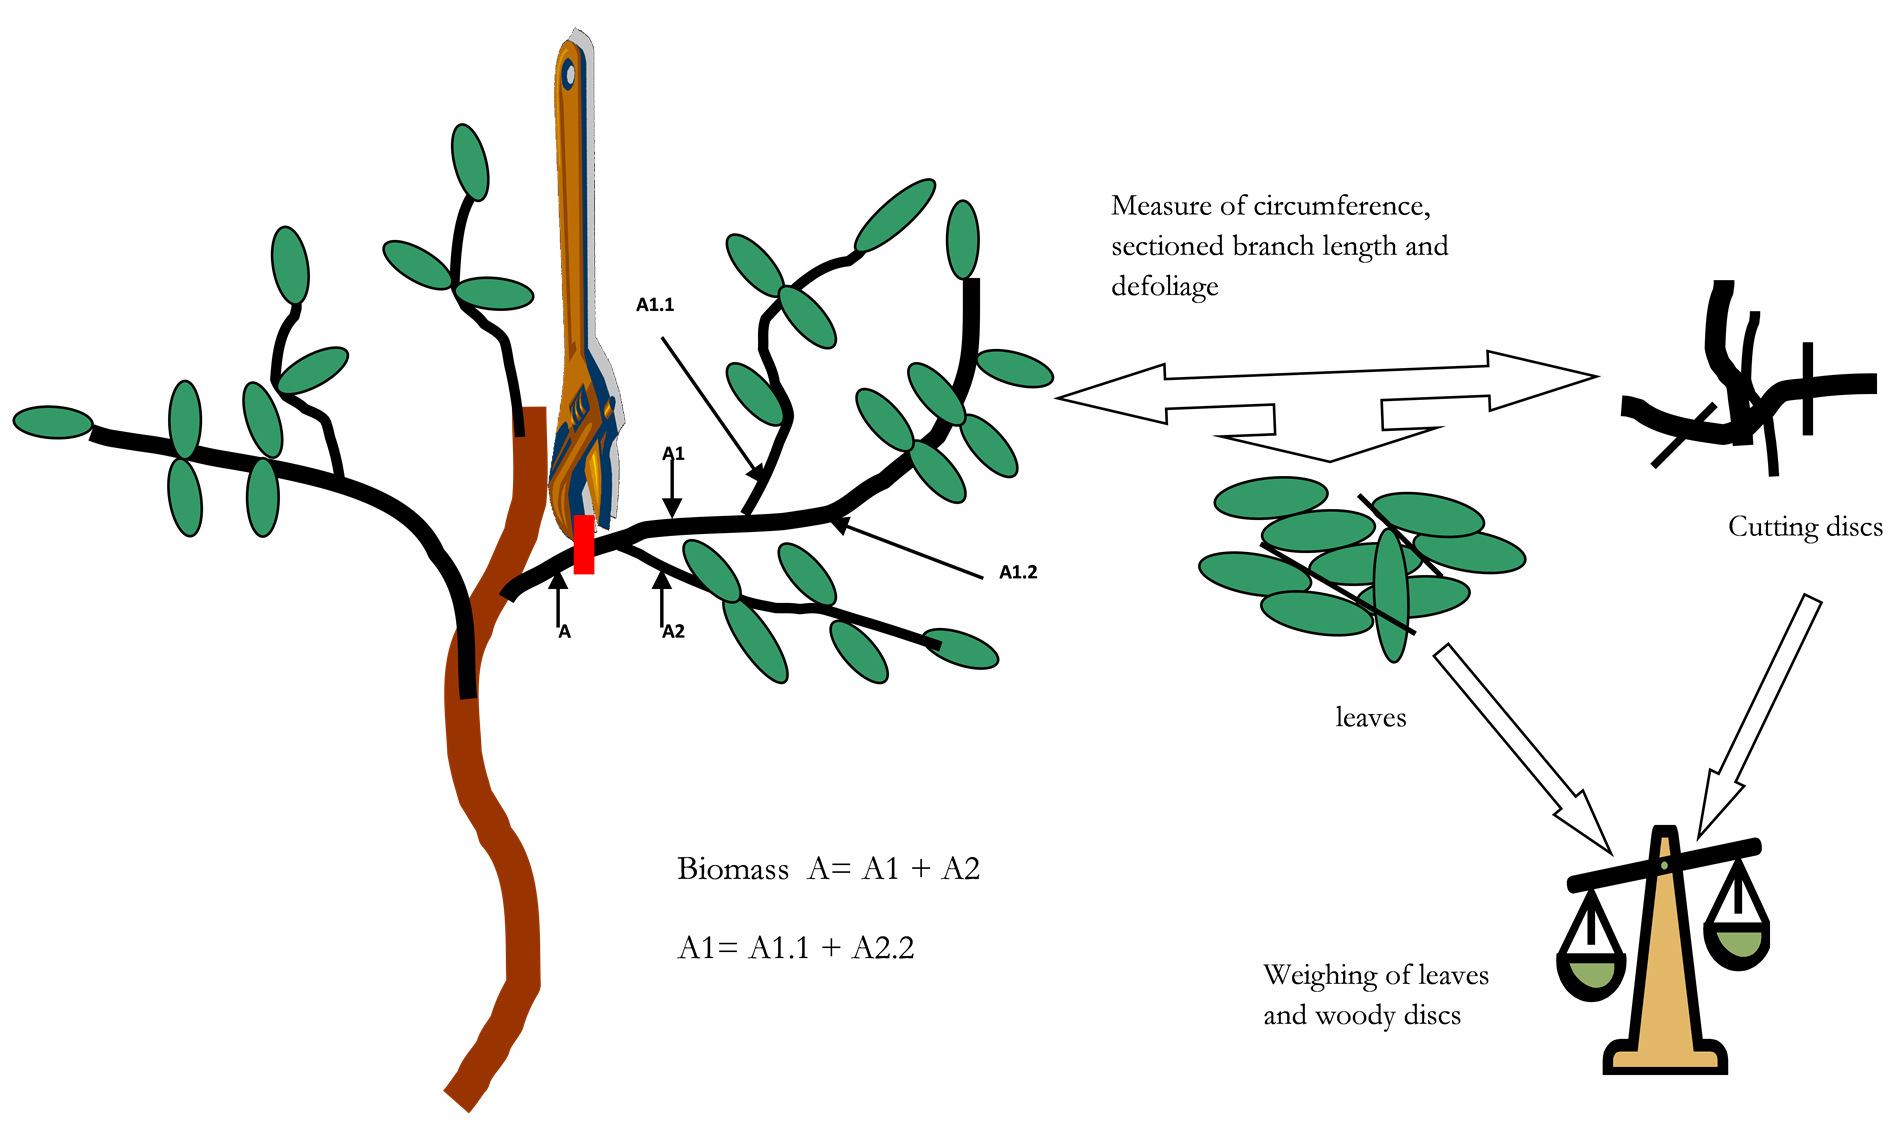
Figure 2. Principles of field leaves and ligneous biomass measurement.
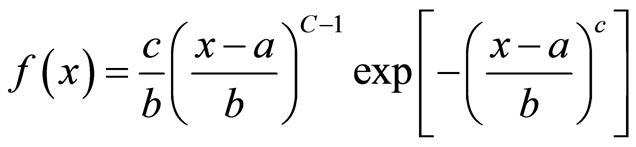
a = position parameter;
b = scale parameter or size parameter;
c = form parameter linked with the observed structure.
Trees circumference or trees height distribution were adjusted to Weibull function with Minitab 16 Software. The log-linear analysis [21] was performed for each case to test the adequacy of the observed structure to the Weibull distribution. The considered model described by [21] is Log Frequency = F + F_Class + F_Adjustment + ɛ.
F = mean frequency of the classes; F_Class = non-randomly gap linked to the differences in frequency between classes; F_Adjustment = non-randomly gap linked to differences between observed and theoretical frequencies; ɛ is the error of the model. The hypothesis of adequacy between both distributions is accepted if the probability value of the test is higher than 0.05.
Regressions on explanatory variables circumference and height were established to estimate the leaf biomass and wood biomass in Pterocarpus lucens. The strength of association between two variables was assessed by the coefficient of determination R2, between 0 and 1.
This leads to allometric relationships of the following form:
• Y = aX + b or log10 Y = a + b log10 X with Y is the leaf biomass (expressed in g of DM), X is the circumference or the height (in cm), a and b are constants.
• Y = aX + bZ + c where Y is the wood dry matter (expressed in kg of DM), X is the circumference, Z is the height (in cm), a, b and c are constants. The principle of calculation of leaf biomass and wood biomass is to determine the distribution of size according to the classes in circumference at the base of the trunk. The regression equation is applied to the minimum and maximum value of each class of circumference. The values obtained for the leaf biomass and wood are weighted by the density of Pterocarpus lucens in each class. The average minimum and maximum values used to estimate forage production and the average amount of wood in kg DM/ha. The amount of above ground sequestered carbon by Pterocarpus lucens is derived from the tree above ground biomass (wood biomass + leaf biomass) by multiplying by the factor 0.45 [22] .
3. Results
3.1. Structure of the Population of Pterocarpus lucens
3.1.1. Circumference Classes’ Distribution of Pterocarpus lucens
The circumference classes’ distribution of Pterocarpus lucens adjusted to Weibull distribution showed bell-shaped form with left distribution (1 < c < 3.6) indicating a predominance of individuals with small circumference in the stand (Figure 3).
The first peak of the distribution of the population of Pterocarpus lucens by class circumference is represented by the class [30 - 40 cm] constituted of individuals with small diameter. The second peak represented by two classes [50 - 60 cm] and [60 - 70 cm] was comprised of individuals with average diameter. The third peak characterized by the class [100 - 110 cm] consisted of individuals with large diameter. The observed number of individuals in small classes [10 - 20 cm], [20 - 30 cm] and [30 - 40 cm] showed a significant level of regeneration. Overall the structure reflected a relative balance of the population of Pterocarpus lucens.
3.1.2. Total Height Classes’ Distribution of Pterocarpus lucens
The height classes’ distribution of Pterocarpus lucens also showed bell-shaped form with left distribution (1 < c < 3.6) indicating a predominance of individuals with small height in the stand (Figure 4). The examination of the distribution of the height classes’ distribution of Pterocarpus lucens population showed a bar bell with a peak class [4 - 5 m]. Individuals which height was between 2 and 7 m were more common as the population consisted of shrubs, the trees were rare. The small class sizes [0 - 1 m] and [1 - 2 m] was due to the pressure on this species due to its palatability and frequency of bushfires. The significant level of regeneration revealed by the distribution of population circumference by class was only apparent, because the presence of low classes [0 - 1 m] and [1 - 2 m] showed that the renewal potential of Pterocarpus lucens was threatened.
3.2. Dry Matter Content of the Leaf and Wood Biomass of Pterocarpus lucens
The dry matter of 10 samples of wood and leaf biomass of Pterocarpus lucens were given in Table 1. The dry matter content of the leaf biomass of Pterocarpus lucens was 56% on average, but varied according to the samples with a minimum of 45% and up to 64%. This variability was related to the diversity of geomorphological units with the resulting changes in soil water availability that is one of the main causes of the heterogeneity of leaves water content. The examination of the table showed that the dry matter content of wood varied little between 55% and 65% depending on the samples. The average dry matter content was 61%, which was quite high,
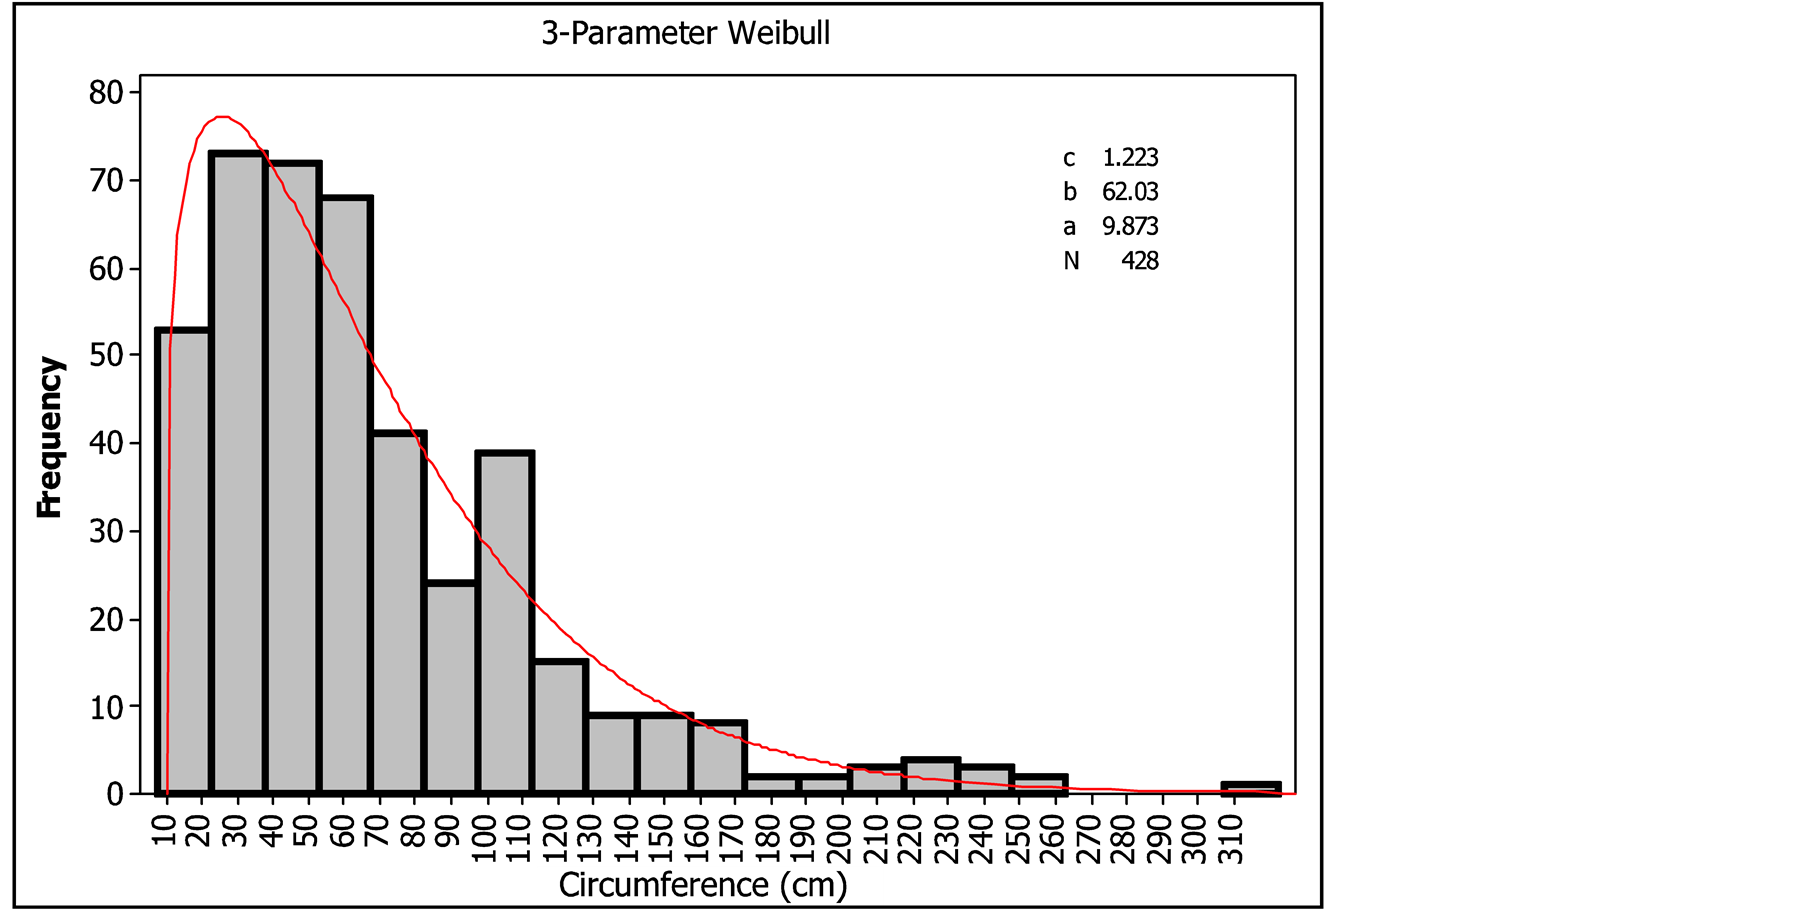
Figure 3. Circumference classes’ distribution of Pterocarpus lucens.
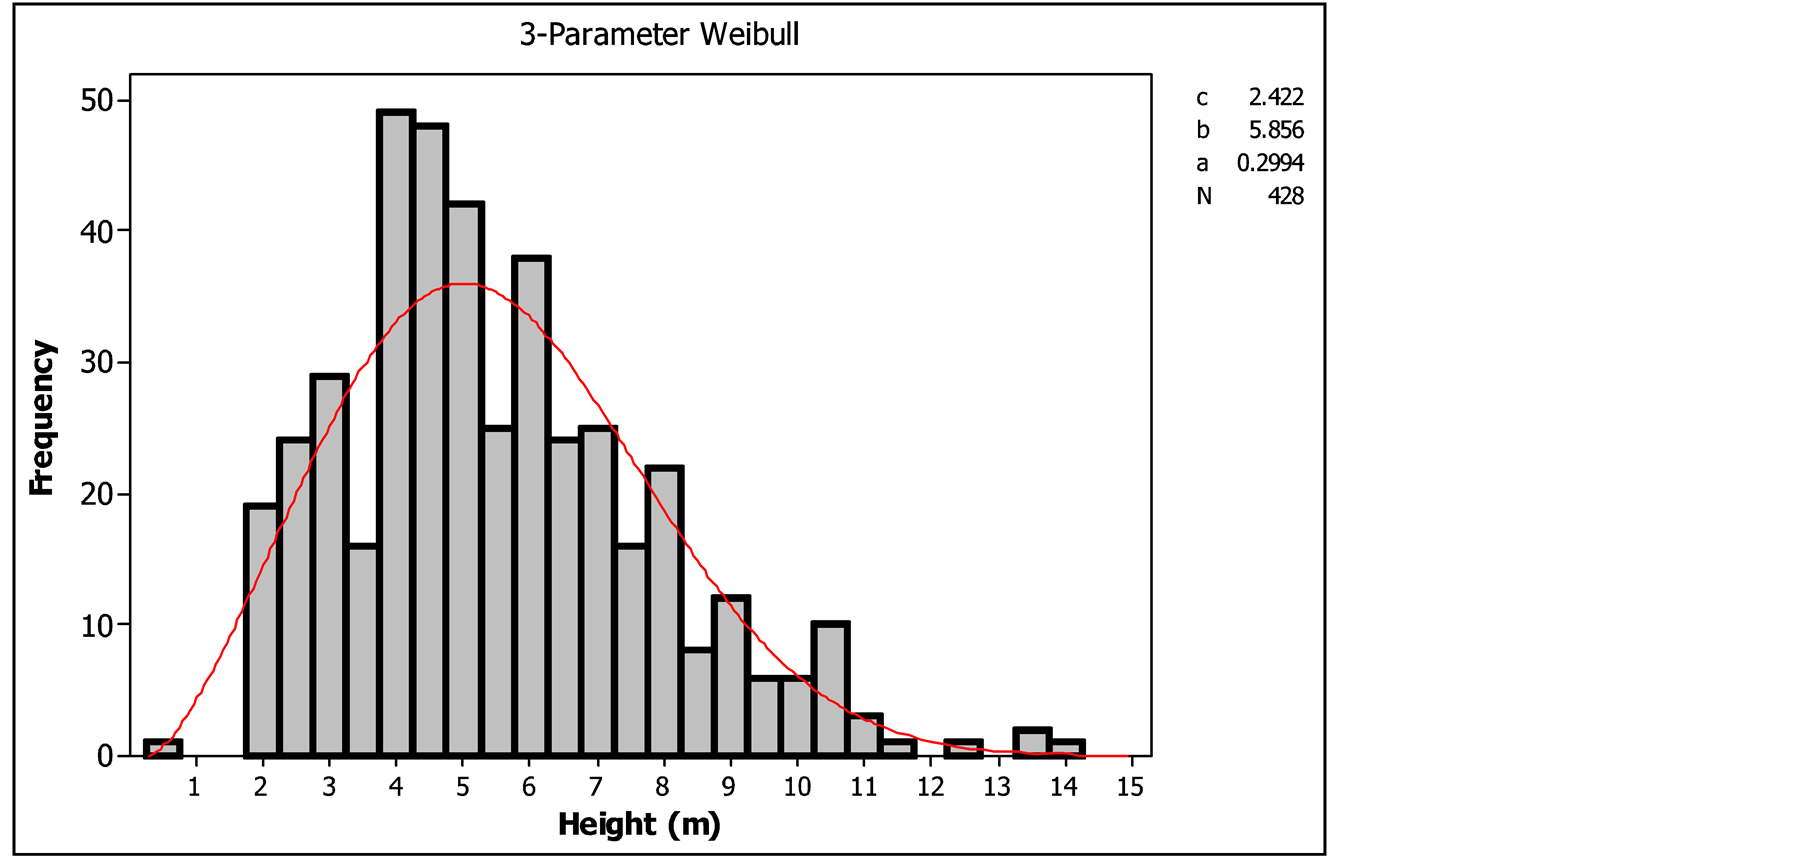
Figure 4. Height classes’ distribution of Pterocarpus lucens.

Table 1. Dry matter content of leaves and wood of Pterocarpus lucens.
that was explained by the fact that Pterocarpus lucens is a characteristic species of battleships in the Ferlo where water availability is lower.
3.3. Modeling of Forage Production
Allometric relationships between leaf biomass and circumference of Pterocarpus lucens were established. The prerequisites regressions were checked. Regression residuals were calculated and verified by the normality test of Ryan-Joiner (p ≥ 0.01). The assumption of independence of the residuals is also true (p ≥ 0.05). Furthermore the variance inflation factor of less than 10 indicated that predictors are not self-correlated. The method of forward selection allowed us to retain the only variable circumference having a regression coefficient highly significant (p = 0.0001). Both the two studied models were shown in Table 2.
The examination of the curve of leaf biomass in function of the circumference (Figures 5 and 6) showed very satisfactory values for the coefficients of determination of the two models (74% and 75%). These high coefficients of determination showed that there was strong association between leaf biomass and basal circumference of trees.
Of all the tested models, the simple linear regression model was the most appropriate (Model 1). This model was used to calculate forage production of Pterocarpus lucens.
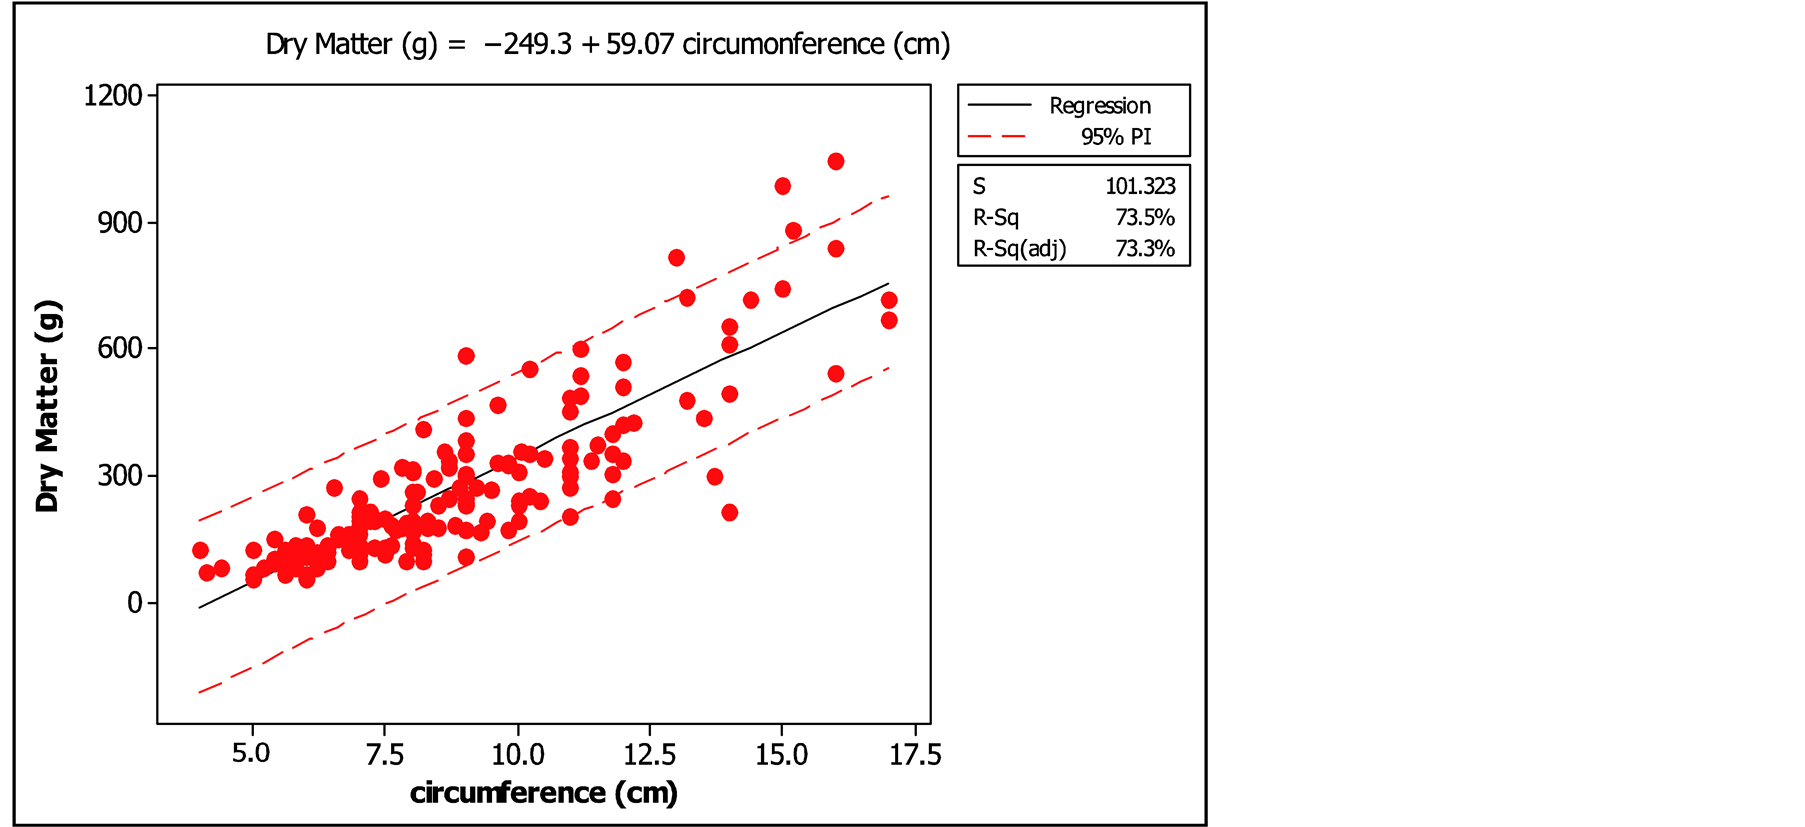
Figure 5. Simple linear regression of biomass in function of circumference.
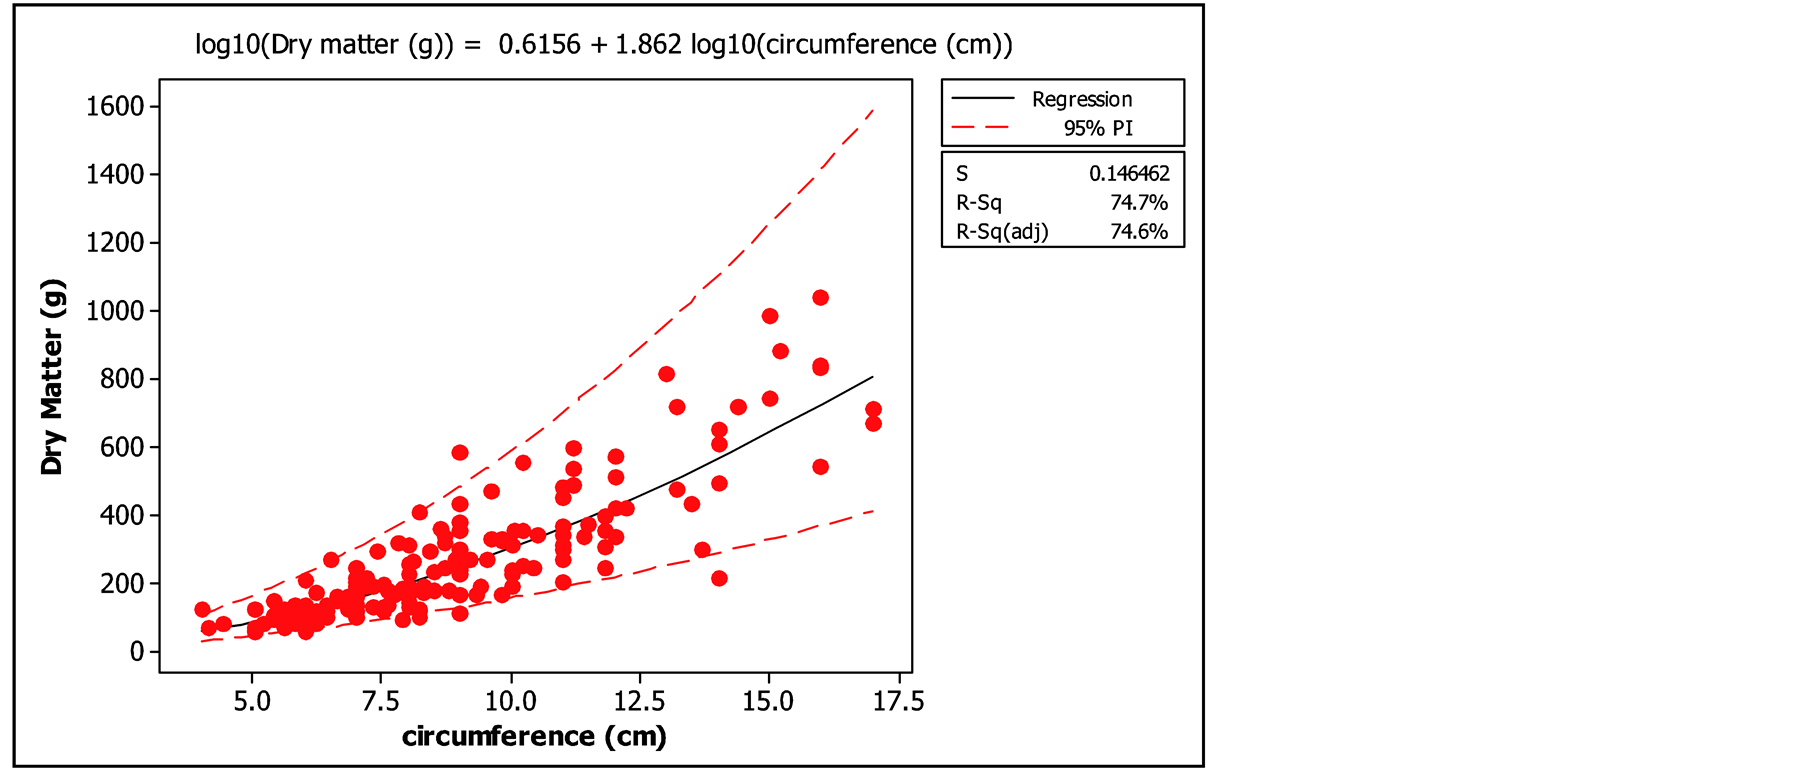
Figure 6. Logarithmic regression of biomass in function of circumference.
Table 2. Prediction models of leaves biomass in function of the circumference.
Pf = Forage production in g of DM; C = Circumference in cm; R2 = coefficient of determination.
3.4. Modeling the Wood Production
The dendrometric characteristics (length and circumference) and branch discs weight were the variables that have enabled us to establish an allometric model to calculate the wood biomass of Pterocarpus lucens (Figure 7). The model of wood dry matter content estimation was globally very highly significant as well as its parameters. The model is as follows:
P (kg DM) = −1.77 + 0.150 C (cm) + 0.506 H (m) R2 = 76% with P = timber production in kg dry matter C = circumference of 0.3 m cm H = height of the tree R2 = coefficient of determination.
The coefficient of determination of the model of 76% was high. It showed that there was a high correlation between the wood production, the circumference and length of the branches.
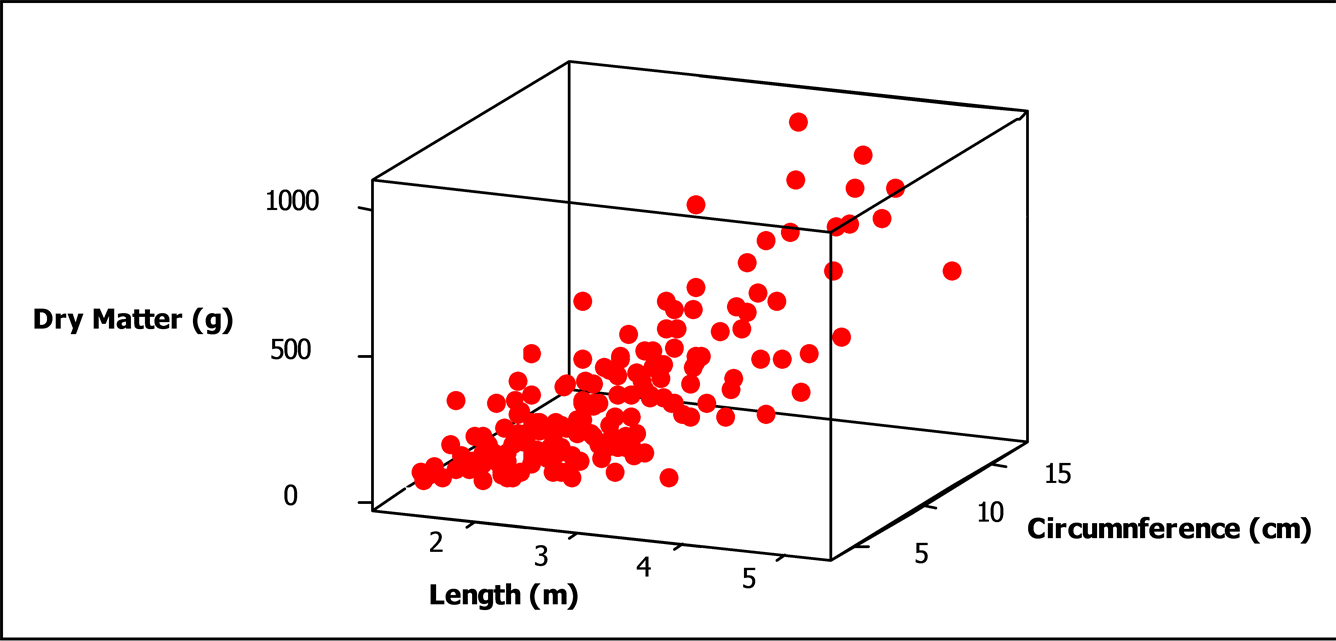
Figure 7. 3D tendency of wood biomass in function of circumference and branches length.
3.5. Estimation of Forage Production
The simple linear regression model was more appropriate to calculate forage production, Pf (g DM) = −249.3 + 59.07 C (cm). This equation was used to calculate the minimum and maximum values of leaf biomass in different circumference classes in kg DM/ha (Table 3).
The average minimum and maximum values of the different classes of circumference allowed calculating the usable forage production (Kg DM/ha) of Pterocarpus lucens.
Σ Minimum values = 144.3 kg DM/ha
Σ Maximum values = 211.4 kg DM/ha Average forage production Pf = (Σ values min + Σ values max)/2 = 178 kg DM/ha Forage production of Pterocarpus lucens is between 144.3 and 211.4 kg DM/ha. The ratio between the average maximum and minimum average is not high (1.5) which can be explained by the presence in the stand of all classes of circumference.
3.6. Estimation of Firewood Production
The regression on the explanatory variables circumference and height has established a model to predict the production of wood in Pterocarpus lucens. This model is as follows: Pb (kg DM) = −1.77 + 0.150 C (cm) + 0.506 H (m)
Based on this model we calculated the minimum and maximum values of the wood production in the different classes of circumference kg DM/ha (Table 4).
3.7. Quantification of Sequestered Carbon
The developed allometric equations were used to calculate the leaf and wood biomass of Pterocarpus lucens. To estimate the amount of above ground sequestered carbon, tree above ground biomass (wood biomass + leaf biomass) was multiplied by the factor 0.45 [22] [23] . The amount of sequestered carbon is: 0.45 × (178 kg + 545 kg)/ha.
Amount of above ground sequestered carbon = 325.35 kg C/ha.
4. Discussion
The aim of this work was to quantify the most important ecosystem services such as forage, wood biomass and the amount of sequestered carbon provided by Pterocarpus lucens in the Biosphere Reserve of Ferlo. Thus, from allometric relationships on variables circumference and height, we estimated the production of forage, timber and the amount of sequestered carbon in Pterocarpus lucens. The assessment of forage production is complex. The difficulty to access plant biomass as well as its spatial and temporal variability is probably partly responsible for the late development of assessment methods for forage phytomass evaluation [24] . Thus, due to the destructive and fastidious direct measurements of plant biomass, the research of allometric relationships between
Table 3. Forage production estimation according to circumference classes.
Table 4. Estimation of wood production according to circumference and height classes.
leaf biomass and various physical parameters (height and girth) easily measurable emerged as an interesting method at any point of view. Indeed, the allometric relationships have been studied in multiple works on different species as well in Sahelian ecosystems [25] -[31] as in temperate ecosystems [32] -[35] . The modeling of forage production in this study revealed that among the two physical parameters studied, the circumference has a better correlation with biomass. These results support the work of Cissé [27] and [30] . Also the circumference at the base is easier to measure in the field data. The proposed model was used to calculate forage production of Pterocarpus lucens is estimated at 178 kg/ha. This value is four times greater than that found by Ngom et al., [30] in other ecosystems in the Ferlo which is explained by a higher density (43 individuals/ha) but also by an improved calculation method which takes into account the density of class circumference and not the overall density. The importance of this forage production confirms the dominant position occupied by woody forage in livestock feed in the Sahel. Wood biomass was also calculated from an allometric relationship that takes into account both the circumference and the tree height. Timber production of Pterocarpus lucens is estimated in the Biosphere Reserve of Ferlo at 545 kg DM/ha. These results are interesting in practice in a context of increasing rural demand for forest products (firewood, timber service). Today, the challenge of sustainable management of the Ferlo sylvo-pastoral ecosystems in general and the Biosphere Reserve in particular is to balance production with the needs of populations. For this, it is imperative to know the potential production of these ecosystems. According to Ngom [3] , Pterocarpus lucens is exploited in Ferlo. Besides its importance as firewood, it is the most used species as wood construction and one of the two most palatable species to livestock, but also the most pruned by the shepherds [36] . The challenge for management is to reconcile the maintenance of the potential of this forage species with increasing grazing pressure [37] . Tree above ground biomass was used to calculate the amount of above ground sequestered carbon in Pterocarpus lucens in the Biosphere Reserve of Ferlo. In fact, this species is capable of storing 325.35 kg C/ha. The measurement of carbon in tropical lands has become important in studies of global climate change because carbon lost by tropical systems contributes significantly to atmospheric changes and in particular the increase of CO2 [38] . Indeed, the main way to reduce net carbon emissions is to increase the amount of sequestered carbon by terrestrial ecosystems [39] . The presence of high densities of trees in the Biosphere Reserve of Ferlo effectively contributes to the production of organic carbon and humus promotes maximum production if the appropriate management techniques are applied leading to a maximum biomass production [40] .
Thus, to evaluate the potential forage, timber production and the amount of sequestered carbon in the Sahelian species, the use of regression equations can reduce the human and financial costs of such an operation. However, any extrapolation to a larger scale remains very uncertain. Indeed, most of the factors that affect the productivity of vegetation vary from one study to another. Also, interspecific differences, the conditions of the water supply, the potential of the soil and climate are especially never identical from one station to another [34] . It is also established that the allometric equations vary depending on the age of the plant phenology and grazing pressure [27] [41] [42] . The transfer of the proposed models to other regions must be done carefully. Many parameters must be taken into account in establishing the production models such as the state of the tree and the soil type [43] . A great accuracy is generally not attainable with allometric equations.
However, the prediction formulas are a contribution to the thorny problem of reliable assessment of the production of wood, leaf biomass and the amount of sequestered carbon by a forage species in the Sahel. Indeed, the capacity to model and to predict the evolution of sylvo-pastoral resources is an important issue for biosphere reserves in the Sahel.
NOTES