An experimental study of hydrolytic behavior of thulium in basic and near-neutral solutions ()
1. INTRODUCTION
Recently, the studies of rare earth elements (REE) complexing have been considerably intensified due to evaluating the fate of the REE compounds in the environment [1-3]. Producing and accumulating of significant quantities of REE during nuclear fission in uranium and Plutonium reactors are a potential source of their formation. The lanthanides complexes are among the most important compounds in natural waters regarding predominant anions [4]. According to the data of its abundance in the Earth’s crust thulium appears to be the rarest among rare earth elements after promethium [5]. However, due to a potential risk of uptake by human bodies, animals and plants, further research in the chemistry of thulium complexes affecting the process of metabolism is needed. It has already been proven [6] that REE complexes could affect the ionic channels functioning and potentially lead to interrupting of the impulse transmission among the nerve cells.
According to the review of the published literature, thulium appears to be the least researched element amongst lanthanides due to an exclusively complex technology of its production and very high prices. The published experimental data on thulium hydrolytic behavior at 25˚C are very limited, and being obtained under different experimental conditions, these are often incomparable with each other [7-10]. For example, in [7] the value of the stability constant of the  monohydroxocomplex, assayed by potentio metric titration in the Tm2O3 solutions at the ionic strength of 0.3, is reported as 5.78 log.unit The corresponding stability constant of the isotope 170Tm, assessed by chelating organic ligands extraction together with radio-chemical labelling, is 9.6 log.unit and differs by nearly 4 log.unit [8]. The submitted data demonstrate a dispersion typical for Tm hydroxoforms stability in aqueous solutions. Hydroxocomplexes of higher order usually are evaluated at considerable ionic strengths have very often, either not been identified, or the researchers anticipate presence of different complexes in similar experimental conditions. This could be considered as one of the major explanation for a great variability of the published data.
We studied hydrolythic equilibria in Tm3+ solutions with a possible participation of higher order hydroxoforms besides of . To minimize the experimental errors caused by extrapolation to the zero ionic strength we studied hydrolytic reactions at minimal ionic strengths.
2. MATERIALS AND METHODS
Spectrophotometric pH measurement of the solutions containing variable TmCl3 concentrations and constant concentrations of the acid-alkaline indicators and KOH were carried out. An increase in Tm concentration resulted in a decrease of the absorption of the deprotonized form of the indicator due to an increase in the protons quantity as per following reaction:
 (1)
(1)
The pH values were calculated from the measuring absorption densities of the indicator using tabulated values of the ionization constants [9]. The obtained values of ligand number n were used to calculate thermodynamic values of the formation constants of hydroxocomplexes. In the solutions containing m-cresol purple the measured pH values were between 6 and 8 and in 2-naphtol-containing solutions these were between 9 and 10.
3. CALCULATIONS
Reactions of hydroxocomplexes formation in solutions of trivalent metal ions
 (2)
(2)
are characterized by stepwise оKn and total оβn stability constants expressed at zero ionic strength by the equations:
 (3)
(3)
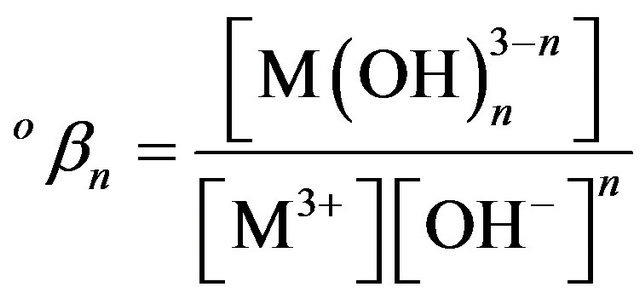 (4)
(4)
Both indicators are weak organic acids (HA) that react with a strong inorganic base KOH:
 (5)
(5)
where HA and A− are the protonated and deprotonated forms of the indicator, respectively.
If the equilibrium constant KBHA for reaction (5)
 (6)
(6)
is known, the equilibrium concentrations [HA], [А−] and consequently [OH−] and pH of the solution under study can be evaluated from the spectra.
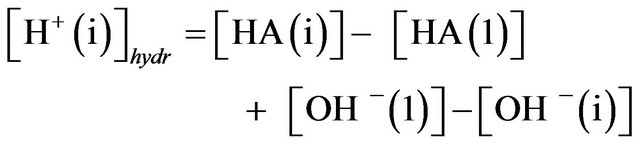
The reaction between potassium hydroxide and the indicator (being a weak acid) neutralizes its HA part into KA salt (5). Then the solution denoted as number 1, containing the acid and KOH without Tm, has buffering properties. Therefore, adding the increasing of protons concentration would be equivalent to titration of alkaliscent solutions by a strong acid. The protons would react with А− increasing the concentration of the weak acid HA. If the buffering capacity of the Tm-containing solutions is insufficient, the remainder of protons would neutralize OH−-ions in the solution (i). The equation for protons created in the hydrolytic reactions can be written as:
 (7)
(7)
If hydrolysis is treated as splitting off a proton from a water molecule in the hydrate shell of the rare earth ion, the number of produced protons would be equal to the number of hydroxide ions bound into complexes:
 (8)
(8)
and therefore the ligand number  can be calculated from Equation (9), where CTm is the analytical concentration of Tm. The index i is omitted for simplicity in the Equations (8) and (9).
The calculation algorithm was based on the stepwise approach and consisted of the following stages:
1) The activity coefficients were initially assumed to be equal to 1.
2) HA, A− and consequently OH− equilibrium concentrations were calculated using optical densities.
3) n values were calculated using Equation (8).
4)  values were expressed from (9) and calculated as the linear lest square method parameters.
5) Concentration of hydroxocomplexes and activity coefficients were calculated using the values obtained. Activity coefficients were evaluated by the Debye-Hü ckel equation in the second approximation.
6) The program was returned to Step 2, until all the calculated values became constant according to the preset accuracy.
The complex forms ,
,  and
and  , interlinked by the constants
  and
and , were assumed to be present in solutions containing mcresol purple. They were calculated by the regressive equations:
 (9)
(9)
where  and
and  are the activity coefficients for uniand trivalent ions.
 complexes were suggested in 2-naphthol-containing solutions within the measured pH
 (10)
(10)
interval. The stability constants  were evaluated as per following equation:
 (11)
(11)
4. EXPERIMENT
The absorption spectra of pH-indicators solutions containing “analytical grade” TmCl3 (sourced from the Novosibirsk plant of chemical reagents) have been measured. The solutions for spectroscopy were prepared from 0.01 M TmCl3 aqueous stock solution with pH 5.84. The Tm concentration was controlled spectroscopically with an arsenazo [11]. Concentration of KOH (analytical grade ALDRICH) was monitored by titration with HCl. The indicators (“Indicator grade” ACROSS ORGANICS) were monitored by comparing of their extinctions with the corresponding values obtained from the reagent purified by vacuum sublimation and multiple crystallization [12]. Twice-distilled water boiled for longer than 2 hours was used.
The spectra of solutions were measured in closed quartz cells with 5 cm optical length using UV VIS spectrophotometer Specord M40. The experimental error was evaluated using the law of errors propagation. Its value depended on the accuracy of solution preparation and photometric measurement and did not exceed 1.2% at 25˚C. The accuracy of experimental evaluation of the stability constants was calculated as standard deviations of the linear regression parameters.
5. RESULTS AND DISCUSSION
5.1. Measurements in Solutions of m-Cresol Purple
The sulfonaphthalein indicator m-cresol purple (mCP) was used by Clayton and Byrne for surface and deep-water spectrophotometric pH measurement of sea water [13]. According to the results it exists in three forms— H2I, HI− and I2−. In the visible range within the interval of the measured pH values mCP’s spectrum is represented by distinct intensive bands corresponding to its protonated (HI−, ) and deprotonated (
 ,
,  ,
, ) forms. According to our preliminary measurements, the extinction values of HI− were ranging from 0 to 408 within the 15,400 to 17,300 cm−1 interval. That allowed to disregard HI− absorption in our measuring of absorption of the I2− band. This indicator was also used by the authors of [9] when studying a comparative hydrolythic behavior of REE.
The chemical equilibrium between two forms of mCP: I2− + H+ HI− is described by stepwise formation constant:
 (12)
(12)
The value of pKa ionization at 25˚C and an ionic strength 0.7 is equal to 8.146 according to [13]. We recalculated the values of pKa for the zero ionic strength.
Figure 1 shows as an example the spectra of mCP vs pH in KOH and TmCl3 solutions. They are characterized by distinct isobestic point at 20,500 cm-1. The initial analytical concentrations of KOH and mCP in this experiment were constant and equal to 2.6 × 10⁻⁴ and 3.9 × 10⁻⁵, respectively. The concentration of TmCl3 in series of 10 solutions varied from 0.0 to 5.0 × 10⁻⁵ М. The pH values were estimated as negative logarithm of hydrogen ions activity and were calculated by comparing of I2− absorption in solutions under study (i) with the absorption in solution (0) with KOH concentration of 0.01 M, were all the indicator is in the I2− form.
The published data confirms that mCP forms complexes with Fe (III) [14]. As for complex formation with Tm in our experiment: in this case the absorption of I2− had to be decreased with increasing of metal concentration without any isobestic point. Should the Tm hydroxocomplexes be also formed, the isobestic point would be displaced vertically down. The pattern of spectra in Figure 1 demonstrates that under conditions of our experiment the only change in pH occurs due to the change of indicator forms but not of its concentration.

Figure 1. Effect of TmCl3 concentration (M) on spectra mcresol purple in KOH solutions; (0) 0.0; (1) 0.0; (2) 1.0 × 10⁻⁵; (3) 1.5 × 10⁻⁵; (4) 2.0 × 10⁻⁵; (5) 2.5 × 10⁻⁵; (6) 3.0 × 10⁻⁵; (7) 3.5 × 10⁻⁵; (8) 4.0 × 10⁻⁵. Concentration of KOH in solution (0) is 0.01 M.
Table 1 shows the values of log and log
 averaged for 9 wave numbers within the studied 15,800 - 17,300 cm−1 interval, and their standard deviations. Table 2 compares our experimental values of log
 with the published data. The experimental conditions differ considerably both from ours and among themselves. These are due to the different reagent concentration, measured pH values and the proposed forms of hydroxocomplexes present in the solutions within the studied pH range. This could explain the observed data disagreement.
Unfortunately, we could not find in literature the experimental data on the values of  for Tm. However these are available for erbium [15], where hydrolysis of Er by measuring of solubility of its freshly precipitated hydroxides was studied. The logarithmic values of stability constants for erbium solutions with concentrations up to 0.1 M in the 1 M NaClO4 medium (under conditions excluding the presence of CO2) are as follows:
  = 7.7,
  = 13.5,
  = 18.9, logoβ4 = 19.2. Taking into account the difference of experimental conditions one can consider that the value
  = 15.09 for thulium which we have obtained at the zero ionic strength satisfactorily agrees with the results of [15].
5.2. Measurements in Solutions of 2-Naphthol
The ionization constant of 2-naphthol Ka is determined by the equation:
 (13)
(13)
where NapOH and NapO‾ are the protonated and deprotonated forms of 2-naphthol, respectively. The values of рКа were defined spectrophotometrically up to 400˚C in [16] and then used by the authors [17] for measuring equilibrium constants in solutions of sulfuric acid and ammonia, as well as boric acid [18] at elevated temperatures and pressure. According to [17], the value of p at 25˚C is 9.63. Figure 2 presents the absorption spectra of 2-naphthol in solutions КОН and TmCl3 which depend upon pH. The absorption band in the interval 26,000 - 30,000 cm−1 belongs to NapO−. Table 3 presents data for the averaged values of logoK3 and their standard deviations. The measurements were carried out in the range from 27,200 to 28,800 cmˉ1 in nine points of the spectra. The initial analytical concentration KOH and 2-naphthol were constant and equal to 3.0 × 10ˉ4 and 1.0 × 10ˉ4 М respectively. The TmCl3 concentration varied from 0.0 M to 4.5 × 10ˉ5 М in the series of 10 solutions. The β3 values are published by Fatin-Rouge and Bünzliin [19]. The authors had determined the hydrolysis constant for a series of rare earths elements by potentiometeric titration of 0.002 M solution
  at a constant ionic strength supported by the adding 0.1 М NaCl. However, only complex forms Tm3+ and
  were suggested within pH range of 8.5 - 11. The measured value of *β3-21.14 could be considered as agreeing with our results (19.35) if the difference in the experimental conditions is accounted for.
6. CONCLUSIONS
The number of bound hydroxide ions as well as thermodynamic values of the stability constants of the first three
Table 1. Experimental data for calculations of logоKn and their standard deviations (sd) in solutions of m-cresol purple measured at ν = 16,400 cm−1.
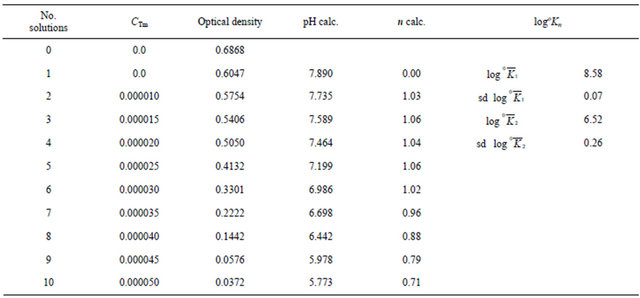
Table 2. Comparison of the first hydrolysis constant of thulium at 25˚C from literature data and those obtained in this work.

Table 3. Experimental data for calculations of logоKn and their standard deviations (sd) in solutions of 2-naphthol measured at ν = 27,600 cm−1.

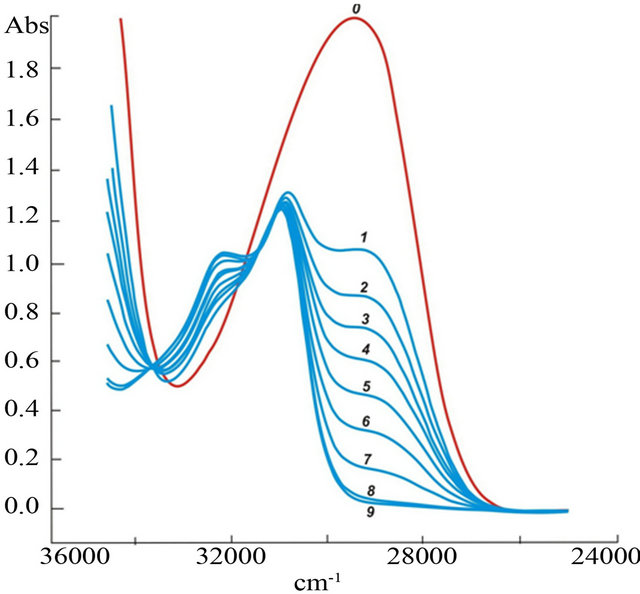
Figure 2. Effect of TmCl3 concentration (M) on spectra 2-naphthol in KOH solutions: (0) 0.0; (1) 0.0; (2) 5 × 10⁻⁶; (3) 1.0 × 10⁻⁵; (4) 1.5 × 10⁻⁵; (5) 2.0 × 10⁻⁵; (6) 2.5 × 10⁻⁵; (7) 3.0 × 10⁻⁵; (8) 3.5 × 10⁻⁵; (9) 4.0 × 10⁻⁵.
Tm (III) hydroxo complexes have been evaluated by the indicator spectrophotometric method in the absence of polymer forms, side reactions and hydroxides precipitate at 25˚C at minimal ionic strength. Although the research was initially intended to form a basis for estimating stability of hydroxide, carbonic and mixed hydroxocarbonate forms of REE at elevated temperatures, the employed methodology at near-room temperatures has proved to be advantageous over the direct potentiometeric measurements Our methodology utilizes tabulated values of ionization constants and extinction coefficients of pH indicators that removes the need for electrode calibration during each measurement. The employed spectroscopic technique allows carry out direct observations of the hydrolythic behavior of elements in solutions.
The work was supported by the Russian Branch for Basic Research, project No. 11-05-00662-а.