1. Introduction
Kuznets [1] postulated a relationship between national economic development and income inequality based upon “5 per cent empirical information and 95 percent speculation”. Noting a trend towards income equality in three developed nations (the United States, England, and Germany), Kuznets [1] hypothesized that national economic development was associated initially with increasing economic inequality that was followed by decreasing economic inequality. This relationship describes the Kuznets curve, which is characterized by its distinctive inverted U shape. Kuznets [1] suggested that this curve was produced by the combined effects of urbanization and industrialization and resulted from the movement of the labor force from lower paying rural agricultural jobs to higher paying urban industrial jobs.
Kuznets [1], in presenting his theoretical model, acknowledged that, “In view of the importance of industrialization and urbanization in the process of economic growth, their implications for trends in the income distribution should be explored—even though we have neither the necessary data nor a reasonably complete theoretical model”. In his model, Kuznets [1] created a theoretical economy with two sectors, A and B. Sector A was agriculture. Sector B was non-agriculture. The assigned per capita income in A was 50 units. The assigned per capita income in B was either 100 units or 200 units. He further assumed two income distributions in each sector of this theoretical economy, E or U. In E, the lowest decile of the economy accounted for 5.5 percent of the total sector income and the highest decile of the economy accounted for 14.5 percent of the total sector income. There was a one percent difference between each decile in the economy (that is, each decile accounted for 5.5, 6.5, 7.5, 8.5, 9.5, 10.5, 11.5, 12.5, 13.5, and 14.5 percent of the total sector income increasing from the bottom to the top decile). In U, the lowest decile of the economy accounted for 1.0 percent of the total sector income and the highest decile of the economy accounted for 19.0 percent of the total sector income. There was a two percent difference between each decile in the economy (that is, each decile accounted for 1.0, 3.0, 5.0, 7.0, 9.0, 11.0, 13.0, 15.0, 17.0, and 19.0 percent of the total sector income increasing from the bottom to the top decile). Next, Kuznets allowed the portion of individuals in sector A to decline over time in 0.1 increments from 0.8 to 0.2. Kuznets then used the difference in the total income between the highest and the lowest quintile of his combined sectors A and B total population as his measure of income inequality over time as the population shifted from sector A to sector B. The parameters and assumptions that Kuznets [1] built into his theoretical model ensured that income inequality will initially increase as the population shifts from a population dominated by workers in sector A with a low per capita income and a set income distribution to a population dominated by workers in sector B with a higher per capita income and a set income distribution. In between the extremes of an all sector A or all sector B population, the income distribution range must be wider because it contains significant portions of individuals in both sectors A and B who have wide and different ranges of income.
Over the past half century, Kuznets curves have been both found and not found to exist within certain nations and regions [2-6]. This inconsistency in demonstrating the existence of Kuznets curves has caused many to question its meaning and to debate its significance [2-6]. Firebaugh [7] noted that “about seventy percent of the world’s total income inequality is between-nation income inequality as opposed to within-nation income inequality”. Significant disparity in income inequality, both within-nation and between-nation, was associated with the industrial revolution [8]. With continued globalization, narrowing of income disparities, or income convergence, both within-nation and between-nation, has been noted [8,9]. In this study, we sought to determine whether a global Kuznets curve exists looking at population-weighted between-nation/region per capita income.
2. Data & Methods
National and regional population and gross domestic product (GDP) estimates (in dollars adjusted to the year 2000) from 1969 through 2007 were obtained from the Economic Research Service of the United States Department of Agriculture (www.ers.usda.gov). This data set represented the longest period of time and included the best estimates of the total world economy and population that we could find. The data set was consolidated into 36 consistent nations and regions over this time period (Canada, United States, Mexico, Caribbean and Central America, Argentina, Brazil, Other South America, European Union 15, European Union New 10, Other Western Europe, Other Central Europe, Russia, Ukraine, Other Former Soviet Union, China, Hong Kong, Japan, South Korea, Taiwan, Other East Asia, Southeast Asia, Bangladesh, India, Pakistan, Other South Asia, Australia, New Zealand, Other Oceania, Iran, Iraq, Saudi Arabia, Turkey, Other Middle East, North Africa, Republic of South Africa, and Other Subsahara) such that the sum of their individual population and GDP estimates were equal to the total world population and GDP estimates. Annual per capita GDP (in 2000 dollars) was calculated for each of these 36 nations and regions and the world for the years 1969 through 2007.
3. Results
The mean world per capita GDP (Mean pcGDP) (in 2000 dollars) for the years 1969 through 2007 is shown in Table 1. The logarithm (base 10) of the annual mean world per capita GDP [LOG (Mean pcGDP)] is also shown in Table 1. The standard deviation of the population-weighted per capita GDP (SD pcGDP) of the 36 nations and regions analyzed in this study for the years 1969 through 2007 is also shown in Table 1. The coefficient of variation, defined as the standard deviation divided by the mean, is a commonly used measure of inequality. The population-weighted percent coefficient of variation (Percent CV) of per capita GDP for these 36 nations and regions was calculated and is shown in Table 1.
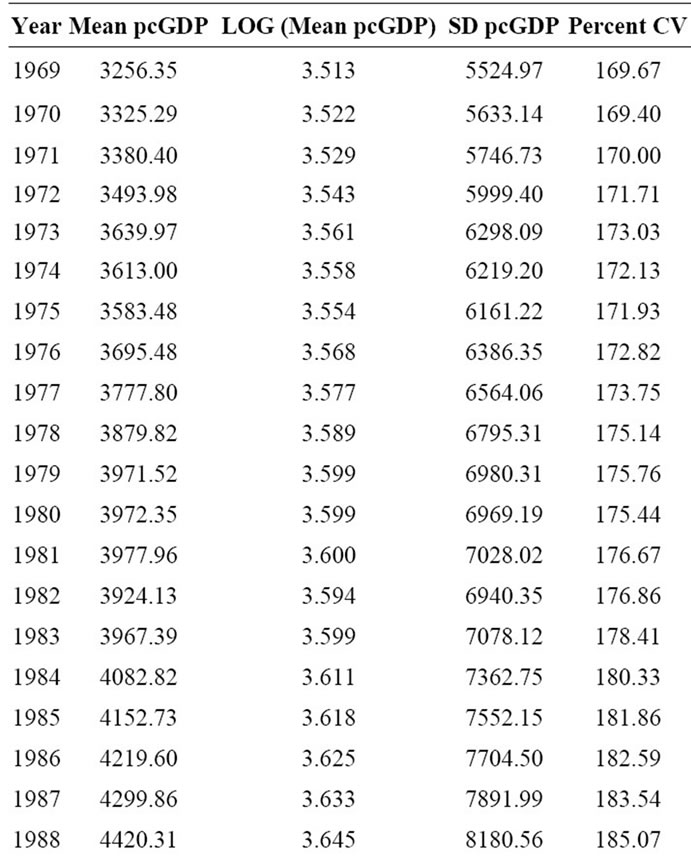

Table 1. Mean and logarithm (Log) of per capita (pc) GDP, standard deviation (SD) of pcGDP, and population-weighted percent coefficient of variation (CV) for the 36 nations/ regions comprising the global economy for 1969 through 2007.
Figure 1 shows the population-weighted percent coefficient of variation of per capita GDP plotted against year. This plot illustrates a distinctive inverted U shaped curve consistent with Kuznets’ hypothesis. Figure 2 shows the plot of the standard deviation of the population-weighted per capita GDP (in 2000 dollars) for the 36 nations and regions analyzed in this study for the years 1969 through 2007. As seen, this standard deviation increases in a very nearly linear fashion over time. Linear regression analysis of the data displayed in Figure 2 yielded the following equation: