Combined Methods of Remote Sensing and Fieldwork in Geological and Mineral Exploration in the Mballe Locality, Adamawa Region of Cameroon ()
1. Introduction
Natural resources encompass all the substances in nature that is useful to man. They are broadly divided into three categories which include, renewable, non-renewable and permanent resources [1]. No matter which type of the resources, human life is inextricably linked to them. They are not created by man but what nature provides for human existence. Man therefore develops various strategies to discover what nature has in stock for him and also possibilities of improving the abundance of the resources in order to draw as much as possible while being cautious of their exhaustion. To this effect therefore, Remote sensing and fieldwork techniques were put together to explore the geological features and minerals (sub-surface resources) in the Mballe locality of the Adamawa Region. This falls within the context of contributing to the identification of sub-surface resources for exploitation that can boost general exports in Cameroon.
According to the 2018 Annual Report of the Cameroon’s Ministry of Economy, Planning and Regional Development, between 2001 and 2019, total exports generated in average about 530 Billion FCFA (900 million Dollars). From this figure, a record high was attained in 2011 (3589.80 FCFA) while a record low was attained in April 2018 (108.32 Billion FCFA). These exports by 2017 generated the total amount of 2500 Billion FCFA (about 4.27 Billion Dollars) while total amount spent on importations stood at 3500 Billion FCFA (about 5.88 Billion Dollars) making a negative trade balance of close to 1000 Billion FCFA (1.61 Billion Dollars) [2]. On the other hand, the National Institute of Statistics (NIS) in its 2016 report stated that the top export commodity is crude petroleum which accounts about 40% of Cameroon’s total exports. By the first quarter of 2019, these exports decreased by 11.9% as compared to that of 2016. The 2019 exports generated 1.88 Billion FCFA making a drop of 4% from 2016. This drop is generally attributed to the socio-political upheavals that the country is going through, especially the Boko Haram insurgence in the Far North and the Anglophone crisis which pushed the government to declare these zones economically dead [3].
To boost the exports, more emphasis is now geared towards other minerals such as gold, cobalt, iron, bauxite, etc. To that effect, besides the Ministry of Mines and Industrial Development, Small Scale Mining Support and Promotion Framework Unit with its French acronym CAPAM was put in place by the Cameroon government in 2003 whose principal mission is to coordinate gold mining activities both from enterprises and local peasants. It is reported that CAPAM recovers about 40 kg of gold annually from exploiters which significantly boosts the Gross Domestic Product (GDP) of the country. More to that, much of Cameroon’s sub-surface wealth is still to be explored. At the beginning of 2010, the Strategic Document for Growth and Employment (SDGE) redefined its economic priorities by valorising sub-surface exploration that could boost its move to attaining an emerging nation by 2035 [4]. Among these strategies, there is the policy of intensive mineral exploration through modern techniques which aimed at stepping up the quantity of minerals exploited in Cameroon. The reason for this is to increase significantly exports that could mitigate the negative gap in trade balance currently witnessed [5].
Seismic surveying has for long dominated techniques of mineral exploration introduced in Cameroon during the German colonial period. Most new discoveries of oil and gas at that time were made possible by seismic imaging of the earth’s sub-surface under the command of the German administration. This accounted for more than 90% of the expenditure in all geophysical surveys. The technique is that seismic waves are initiated by a small explosion or a vibratory source at the surface in a shallow or in water above marine areas. Energy in a typically sub-audio frequency range (10 - 100 Hz) radiates from the source and is reflected off changes in lithology from one stratum to the next and is detectable at depths of many kilometers. By deploying a suitable array of seismic sources, and receiving reflected energy at stations known as geophones, an image of the sub-surface can be built up in 3D. This involves processing a large amount of data to correct for multiple reflections and the geometry of the source receiver configuration. Today more sophisticated techniques exist amongst which we have Remote sensing coupled with field verification which constituted the technique used for this study [6].
The Mballe locality is found in Adamawa Region within the central part of the Pan-African chain, also known as the Adamawa-Yadé domain. This area is constituted of less diversified rock pedestals, granite and gneiss that are crisscrossed by basaltic and phonolitic formations [7]. The Mballe area lies between two great faults; the Adamawa fault and the Betare Oya fault. Previous studies carried out on the zone reveal insufficient data on the geology and mineral occurrences. Besides, most of the geological maps covering the zone are either at small scales (1/200,000 or more) with generalized information or have been realized with manual methods generally considered to be less effective. The objective of this study is to use modern methods of Remote sensing coupled with field verification to realize large scale maps, if possible section by section of not more than 36 km2. In so doing, image processing was coupled with intensive filed work where rock outcrops could be located and characterized with the GPS, soil types identified and characterized, contact zones and fault lines mapped. This method, considered to be more effective, used satellite images acquired through sensors that are of various resolutions. It used Landsat OLI/TIRS image of scene p184r055_8t05052015_33nn. Though with a resolution of 30 m, it is specialized into different bands where a colour composition of the bands could reveal interesting sub-surface features. With the use of Remote sensing softwares such as ENVI, the Mballe locality could be sub-setted from the scene and treated to identify and locate various minerals found in the zone.
2. Materials and Methods
2.1. The Study Area
The locality of Mballe is situated about midway between the towns of Garoua Boulaï (Djerem Division of the East Region) and Meiganga (Mbere of the Adamawa Region) in of Cameroon. It stretches along National Road No.1 of about 45 km northwards from Garoua Boulaï. The area under study covers a surface area of 36 km2 and is drained by River Mba and its tributaries. Figure 1 shows the location of the area both on the map of Cameroon and on the scene of the satellite image.
Considered to be of the sudano-Guinean climate characterised by two seasons (rainy and dry seasons), the Mballe area is generally contrasted and characterised by a succession of hills. Elevated plateaus and plainst are covered by shrubs and grassland. On a monotonous interfluves cut across by drained and undrained valleys, one notices various forms of hydrographic network. Altitudes above sea level oscillate between 860 m and 995 m with a general south-north inclinasion.
Geologically, the Mballe area is situated within the Cameroon Vulcanic Line in which the whole of the Adamawa Region is embodied. The Adamawa plateau had been affected by polyphasee deformation where each deformation is characterised by specific structures. These deformations are responsible for the putting in place of plain and linear structures found on most of the rock pedestals of the area. Most of the rocks are intensively fractured following two tectonic directions N30˚E and N70˚E which correspond to the major Panafrican structure of North Cameroon [8]. Ngounouno et al. (1998) [9] present the rock pedestal of the Adamawa plateau as mostly constituted of granito-gneissic formation that is intercut by granitoïdes of age ranging between 652 and 612 BC. After the African orogenesis, the rock pedestal was touched by tertiary magma of the Cameroon Vulcanic Line. This alcaline magmatism can be interpreted in the Adamawa plateau by the presence of felsic domes and basaltic flows. With such a geological setting, one can deduce that the area is rich in minerals where a detailed cartography to produce large scale maps can reveal interesting wealth of sub-surface resources.
2.2. Methods and Techniques
Nowadays, thanks to the scientific evolution of spatial technologies, Cartography has become an indispensable tool in better orientating man to phenomena in space. Thus, any science that has to do with space finds interest in this spatial technology. This technology can now effectively be used in determining mineral location in space. The method used here depended on data collection, selection and categorization, data treatment and data interpretation.
2.2.1. Data Collection
This constituted the assembling of the required equipment and fieldwork. The equipment used for this study were as follows; a GPS used in taking geographic coordinates on interested spots; compass used for easy orientation in the field and measure the orientation of rock outcrops as well as the direction of certain deformations; digital camera to take filed photographs, hammer to break rocks
![]()
Figure 1. Location of the Mballe locality in Cameroon and in the scene of the Landsat image. (a) Republic of Cameroon; (b) Landsat image scene p184r056_7dt20000205_z33_.tif; (c) Itinery followed in the field during data collection.
in order to obtain samples to further analysis; bold marker to make a nomenclature of the rock samples, bag to put samples inside; sellotape used in fixing on the rock sample and writing on it; small basin used in putting the crushed rocks from where ferromagnesian minerals can be collected. Finally were spatial data that included Landsat OLI/TIRS image of scene p184r055_8t05052015_33nn; SRTM image of the zone, topographic map sheet of Meiganga at 1/200,000 scale and the geological map of Adamawa region at 1/1,000,000 scale. Softwares used included ENVI for the treatment of Landsat image, BaseCamp for the extraction of geographic coordinates from the GPS and ArcGIS for cartography.
The first phase of the fieldwork stretched from April to June 2019 where geographic coordinates were collected, photographs taken, rock and extracted and analysed and landscape pattern observed. The activities that constituted the fieldwork were identifying emerged geological features and registering the with a GPS, doing an in-situ macroscopic description i.e. doing lithological, structural, mineralogical and metallurgical description and lastly identifying structures that contain minerals and locate them geographically. Out of 39 rock outcrops located with the GPS, only 8 samples constituted different rock types, thus, they were collected. Figure 1(c) illustrates the itinery taken during the fieldwork [10].
The choice of Landsat 8 satellite image is that, being the recent result of the Landsat programme, this multispectral radiometer has spectral bands that stretch from the visible to mid-infrared. Compared to Landsat 7 of the ETM+ instrument, two supplementary bands add to Landsat 8 which is mostly destined to atmospheric correction (blue band at 440 m) and cloud detection (1380 m). Added to this Landsat 8 has a band of Quality Assessment (QA) where each pixel contains a decimal value. If this value is transformed to a binary number of 16 bits, one is able to detect some details on the surface, sub-surface and the atmosphere of the earth [11] [12].
2.2.2. Data Treatment
Form the source of the Landsat image, it was already geo-referenced. To this effect therefore the first operation on it was colour composition or band combination which was then followed by sub-setting to obtain just the section covering the study area. It should be noted that each Landsat image corresponds to a specific spectral band in which the image is acquired. The variety of Landsat bands provides many choices to realize band combination. The information obtained from the bands sometimes repeat themselves. To avoid this repetition and choose the most acceptable RGB, a statistical study of the metadata was conducted. The correlation coefficient and Standard Deviation were calculated to determine the Optimum Index Factor (OIF). From this, it was observed that the combination that had a high OIF is susceptible to provide maximum lithological information since it uses data with less redundancies. Thus the equation used is as follows:
where =
= Sum of Standard Deviation of the combination of 3 bands;
= Sum of absolute values of the correlation coefficient [13].
Many authors have worked on this band combination exercise in order to better observe the lithology and interpret surface and sub-surface occurrences. Amongst these are Han and Nelson, (2015) [13] and Mwaniki et al., (2015) [12]. According to these authors, for example, the first band ratio 4/2 is for the determination of iron which is absorbed in bands 2 and 5 while a high reflectance is in bands 4 and 5. Thus on the image, the following ratios were applied; 4/2 for iron oxide, 4 + 6/5 for iron oxide; 6/7 for rock; 7/5 for clay minerals and 6/5 for iron minerals.
In accordance with the technique of Ali and Pour, (2014) [14]; the colour composition of 4/2, 6/7, 5 was realized in order to highlight the lithology, weathered rocks and vegetation. The Kaufman ratio proposes 7/5, 5/4, 6/7 for the same observation (Figure 2 and Figure 3). The indices to certain phenomena were also calculated that highlighted certain elements on the image. Such calculations were done with the following formulas:
–
–
–
–
–
The calculation of some indices, for example, that of rightness is to discriminate certain information already calculated in order to have good results.
![]()
Figure 2. Different colour compositions to highlight certain phenomena on the image (752, 654, 543).
The analysis of the principal components was realized on 6 spectral bands. This consisted of filter applications whose main objective was to cause the appearance of lineaments (hydographic network, linear geological objects and linear geographic objects) with man-made linear objects (roads) not taken into consideration. These linear structures sometimes serve as reservoirs for liquid substances (water, petrol and gas). In this wise, we used the SRTM data, Landsat and shapefile of hydrographic network. These filters used on the Landsat image consisted of convolution which enables the modification of a digital value in function of its relation with the neighbouring pixels. Furthermore, directional, high pass, directional and sobel filters were also applied in order to ameliorate the visibility of lineaments [15].
3. Results
3.1. Field Results and Interpretation
The Mballe locality located within the Cameroon Volcanic Line (CVL) is sparsely drained by fast flowing little rivers on which the local population use as sources of potable water all constituting the tributaries of River Mba (Table 1). This area
![]()
Table 1. Little river sources identified in the Mballe locality.
Source: Fieldwork, 2019.
is characterized by a relatively cold climate of equal periods of dry and rainy seasons and it is noted for its wealth of resources. These resources can well be detected today thanks to Remote sensing techniques where satellite images are used and treated in various ways. This treatment precedes some fieldwork where data was collected, other phenomena located and in-situ observation made for further description and analysis.
The rocks that dominate the Mballe area are the metamorphic and plutonic rocks. In the first place, metamorphic rocks are composed of quartzite, schist and amphibole gneiss. The quartzite is mostly whitish in colour and project in relatively small surfaces. Schist on its turn is of the schistose structure found in Toungoun village and projecting in blocks and slabs along the Mba River in dark white. Lastly, gneiss is characterized by the presence of dark grey patina whose constituent minerals are quartz, feldspath, pyrite and biotite. Within the metamorphic rocks could be seen foliations that are marked by the alternation of quartzo-feldspathic and dark ferromagnesian beds.
Secondly, plutonic rocks of the Mballe area are composed of granite, syenite and granodiorite. The granite (of fine grain texture) results from plutonic rocks that constitute the alternation of clear and dark river beds. It is constituted of many minerals but with a high percentage of biotite (black mica). It is located along the Tounguele River. Some of the rock outcrops cover extensive surfaces while others cove relatively small surfaces as illustrated in Plate 1. Other important geological formations in the locality include; granodiorite, syenite, that all project to the surface in various forms (Plate 2) [16].
As concerns superficial formations, there are laterites of extensive occurrence. Being of red and brown colour, this rock resulted from weathering under sub-tropical climate. This is what mainly constitutes the building material in the locality. Fractures had affected all the types of rocks in this locality. The main fractured direction is N45˚E, a secondary direction of N105˚E and minor directions
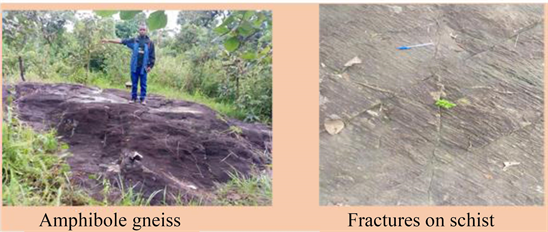
Plate 1. Rock outcrops in the Mballe locality.
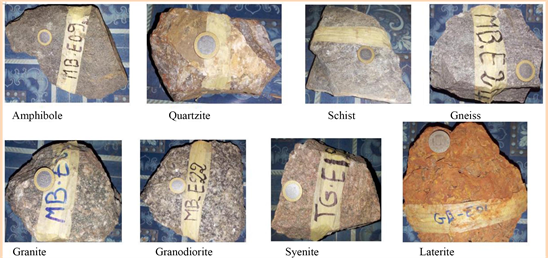
Plate 2. Rock samples found in the Mballe locality.
N90˚E and N165˚E [15], Table 2 illustrates the directions of fractures measured in the field [16].
Clay and gold (Plate 3) constitute the main minerals found in the area. The clay here generally results from the processes of surface erosion. Clay is a natural rocky material at the base of silicates resulting also from the weathering of silicates such as feldspath. It is of greenish colour and composed of two layers of tetrahedral and another of octahedron. Its gross formula is Al2Si2O5(OH)4 which shows that it is only composed of aluminum, silica, oxygen and hydroxide. It is mostly located on gold exploitation sites such as along rivers Tounguele and Mbissogo. To identify gold occurrence sites in the study area, many parameters were taken into consideration amongst which included; slope, relief, confluence and river meander. This tendency observed in the field enabled the direct simulation on the satellite images as is shown in Figure 9 [17].
3.2. Results from Satellite Image Treatment
With the different applications carried out on the satellite image and with field verification, Figure 4 shows the occurrences of laterite, clay and gold minerals in the Mballe area [18]. With the application of the various filters in satellite image treatment, fracture directions, lineaments and their directions as well as the geological map of the locality could be produced (Figures 5-8) [19] [20].
![]()
Plate 3. Artisanal gold exploitation and clay sample.
![]()
Figure 4. Different minerals detected in the Mballe area.
![]()
![]()
Table 2. Fractures measured in the field.
Source: Fieldwork, 2019.
![]()
Figure 7. Geological map of the Mballe locality.
4. Results Analysis
Field validation is an important part in any research work that has to do with natural resources. Apart from observation, measurements and registration of spots with the GPS, samples are collected for further analysis in the laboratory. With the 8 rock samples collected in the field within the framework of this study, analysis were done in the laboratory of the Department of Mining Geology in the School of Mining Engineering of the University of Ngaoundere. These lab analysis led to the determination of their type and value to man. For example, if quartz is crushed and processed, valuable minerals or other metals could be
![]()
Figure 8. Lineaments of the Mballe area.
obtained for the fabrication of objects such as bracelets, watches, locks etc. In the same vein of schist and gneiss, granulates of various sizes can constitute building materials, road construction materials and other decorations. Given that the area has many projections of schist and gneiss, RAZEL, a road construction company in Cameroon took advantage of them to produce the gravel needed to tar the Bertoua-Ngaoundere stretch of road in the East and Adamawa Regions of Cameroon. The dominance of laterite (rich in iron and aluminium) is considered to have developed under prolonged weathering of the underlying rock of the relatively hot and wet climatic condition. Laterite is widely used in the area and beyond for the construction of houses.
To determine the occurrence of gold, river confluences and river meanders (mainly depositional areas) acted as guides. Such areas are equally where clay concentrate, thus a simultaneous exploitation in cases of uses. As Figure 9 illustrates, generating a slope map from the satellite image treated and comparing it with the results of the fieldwork testified to this fact.
![]()
Figure 9. Favourable gold sites in the Mballe locality.
According to Peter Hall and J. S. Marron (1987) [21], the selection of the Kernel Order in a Kernel Density Estimator is considered from two points of view. Firstly, theoretical properties are investigated and secondly cross validation is proposed as a practical method of choice. In this wise, we focused on the latter and grey colour in degrading order was attributed in order to determine the possible sites of gold. Where the grey colour is darkest it shows possible sites of gold, where it is relatively dark refers to diminished concentration of gold and where it is light grey, there is no gold. This technique can be simulated in other potential mineral areas to obtain similar results. But it should be noted that possible gold sites did not only obey to this pre-determined technique. GPS points were taken on some exploitation sites like at the Toungoun river valley and later projected on the satellite image. The pixel on which the GPS point projected created the basis through which spectral behaviour (DN Values) was done. This pixel values range from 0 - 255 either of Red, Green or Blue (RGB). Using Maximum Likelihood of the ENVI software, the results, as shown by Figure 4 above were obtained. From these results, one notices that in areas where laterite and clay concentrate (south of the study area), there is likely the presence of gold. This gold is artisanally exploited by the local peasants [22].
5. Discussion
During the German and the later the British and French colonial periods in Cameroon, Cartography was done manually that involved a lot of fieldwork mainly for observation and samples collection for further analysis. This technology evolved over time to aerial photography and photo-interpretation. According to Nghonda J. P. et al., (2009) [23], most of the maps at that time resulting from the interpretation of aerial photographs were at small scales, that is, both topographic and geological maps (1/200,000). Experts took all the pains to develop mechanisms through which sub-soil resources could be detected from aerial photographs. P. H. Blanchet (1957) [24] proposed a classification which ranges from photo-fractures linked to their lengths of faults, micro-fractures with less than 4 km, macro fractures above 4 km and can attain 76 km. Blanchet produced the first maps of fault density which even revealed that some faults cannot be interpreted from the aerial photograph.
Laurence H. Lattman and Richard R. Parizek (1964) [25] after a review of other works came out with other revelators of faults interpreted from aerial photographs. These revelators were direct and indirect revelators. With the former, this is what the observer interprets directly from the aerial photographs, determining the types of rocks, hydrological networks and surrounding surface resources that could be useful to man. With the latter, the observer could deduce with certainty the presence of certain resources if particular resources could be interpreted on the aerial photographs. For example, if along a fault line, there is a strip of vegetation, the observer will first try to understand the type of specie, height and nearness to water bodies. From this knowledge, he/she understands that this type of specie is linked to the presence of this or that mineral beneath the surface. Thus, the presence of plants is directly linked to geology in general and to relief in particular.
These techniques are today considered cumbersome and involved a lot of time, financial resources and energy, thus have become outmoded. Remote sensing provides for targeted fieldwork, defined periods for verification of phenomena and less costly. Rock and mineral samples could be collected at pre-determined sites, transported to the laboratory for interpretation and analysis. Coupled to field observation, remote could automatically generate lineaments thereby providing an in-depth knowledge of the landscape for proper analysis. For example, many studies show that lineaments generated from satellite images are sometimes assimilated to mechanical discontinuities that marked the Precambrian substratum (Jourda, 2006) [26] (Youan, 2008) [11]. The application of directional and non-directional filters on the landscape image enabled us to highlight lineaments of many directions. From the analysis of the principal components, first order lineaments were automatically extracted. In filtering, other lineaments were extracted following chosen directions. The two results were then superposed to obtain the final lineament map.
It should be noted that filters ameliorate the perception of lineaments as it highlights a probable shadow effect showing that the image receives low-angled light [19]. Enhancements vary according to needs. Only lineaments whose dimensions are superior to convolution window could be detected [19]. Since the investigation area is large, the window 5 × 5 (Figure 10) were used to detect lineaments of at least 75 m. It was then understood that such lineaments are better identified when perpendicular filters to their directions are applied. To that effect we could eliminate lineaments that only appeared in one direction at the detriment of those that appeared in most directions during the image treatment.
6. Conclusions
According to Sabins, E. F. (1996) [27] Remote Sensing is the science of acquiring, processing and interpreting images that record the interaction between electromagnetic energy and matter. This science involves the processes of sensing and registering electromagnetic energy that is either emitted or reflected. Electromagnetic radiation corresponds to the different radiations emitted by a source which can be the sun, continental surface, oceanic surface, the atmosphere or the sensor itself in the form of electromagnetic waves. But considering this definition, many scientists have often become sceptical if this science is applied in the detection of phenomena at distance without any field verification. Thus considered as a multidisciplinary science, it was perfectly applied in this study for geological and mineral exploration in the Mballe locality in the Adamawa region of Cameroon. After processing Landsat 8 satellite images, field verification thus facilitated the realisation of thematic maps of laterite, clay, gold, geology and lineaments. The application of filters coupled with specific Kernel size led to the highlight of particular phenomenon desired. But for the prospection of gold sites, a single approach did not provide satisfactory results; two approaches in this case were used. For the first approach, its indices could be noticed
![]()
Figure 10. Different matrices in filters applied to detect structures on the image.
where there were concentrations of laterite and clay. The second approach relied on fieldwork. Thus, such deposits could be detected at river confluences and at river meanders. In generating a map of hydrographic network and slopes, such locations were efficiently mapped out.
Located in the Lom drainage basin and characterised by a dendritic type of hydrographic network, the Mballe area witnesses a permanent flow of rivers throughout the year. The study of rectilinear portions of the little rivers in comparison with rock fractures shows that some of the rivers flow along the fractured lines. From these guides and other major field observation, a geological map was able to be realised with an acceptable level of accuracy.
Acknowledgements
We want to thank the lab technician in the School of Geology and Mining Engineering for taking his patience to do the rock analysis. His services were indispensable for the success of this work. We are also thankful to the Director of the school for the motivation that he provided for the realisation of this work.