1. Consumer Household Spending on Travel 2013-2019
According to the U.S. Travel and Tourism Satellite Accounts produced annually by the U.S. Department of Commerce Bureau of Economic Analysis (2013-2019), total spending on travel and tourism by all U.S. households has risen steadily between 2013 and 2019 as follows.
This is broken down into the domestic and international travel spending as follows:
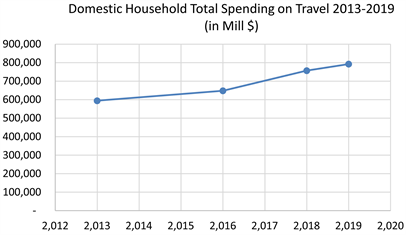
Source: Bureau of Economic Analysis, U.S. Department of Commerce (2013-2019) , U.S. Travel and Tourism Satellite Accounts.
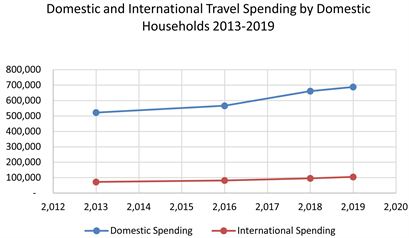
Source: Bureau of Economic Analysis, U.S. Department of Commerce (2013-2019) , U.S. Travel and Tourism Satellite Accounts.
Domestic households grew as follows from 2013-2019:
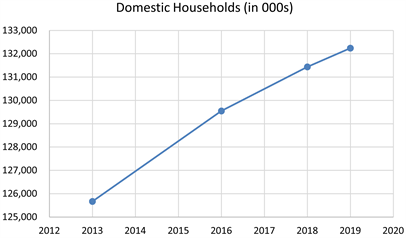
Source: Bureau of Labor Statistics, U.S. Department of Labor (2013-2019) Consumer Expenditure Surveys.
As a result, per household average spending on travel has risen between 2013 and 2019 as follows:
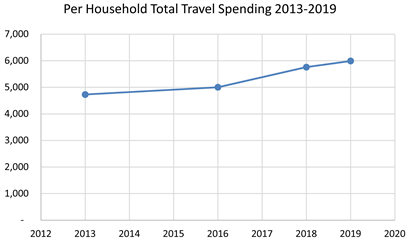
Sources: Bureau of Economic Analysis, U.S. Department of Commerce (2013-2019) U.S. Travel and Tourism Satellite Accounts; Bureau of Labor Statistics U.S. Department of Labor (2013-2019) Consumer Expenditure Surveys.
2. Relationship between Household Spending on Travel vs. Household Pre-Tax Income 2013-2019
The steady rise in per household spending on total travel from 2013 through 2019 has been accompanied by a similar steady rise in per household pre-tax income as follows:
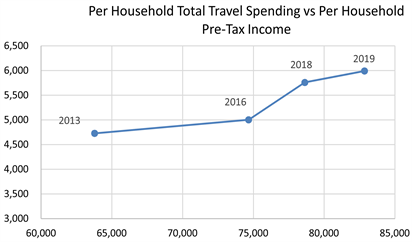
Sources: Bureau of Economic Analysis, U.S. Department of Commerce (2013-2019) U.S. Travel and Tourism Satellite Accounts; Bureau of Labor Statistics U.S. Department of Labor (2013-2019) Consumer Expenditure Surveys.
This demonstrates that Per Household Travel Spending in the period 2013-2019 was reasonably correlated with Per Household Pre-Tax Income with a correlation coefficient of 92.3%.
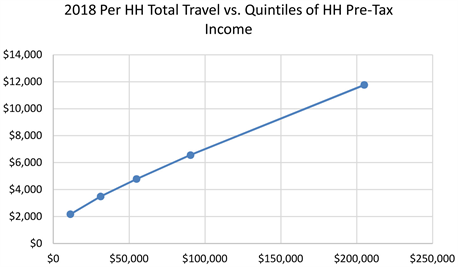
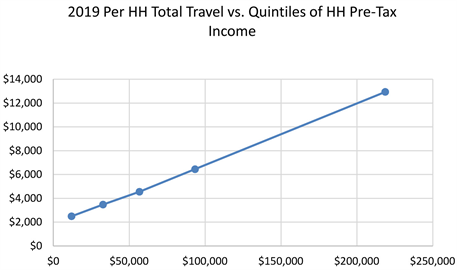
We can also examine the impact of different pre-tax household incomes on per household total travel spending in each of the calendar years 2013, 2016, 2018 and 2019.
3. Methodological Problems in Examining Impact of Pre-Tax Household Income on per Household Total Travel Spending in Each of the Calendar Years 213, 2016, 2018 and 2019
In order to do this analysis in each of several calendar years, we will have to deal with two methodological problems:
· The spending categories and sub-categories of the annual Consumer Household Survey do not exactly match the annual Travel and Tourism Satellite Accounts
· The annual Consumer Household Survey analyzes its data by pre-tax household income quintiles, but the annual Travel and Tourism Satellite Accounts does not.
· The following assumptions were made by the author to deal with each of these problems:
· The Travel and Tourism Satellite Accounts were assigned to the categories and sub-categories of the Consumer Household Survey as follows.

Sources: Bureau of Economic Analysis, U.S. Department of Commerce (2013-2019) U.S. Travel and Tourism Satellite Accounts.
Given the following data from the 2013 Consumer Expenditure Survey for per household spending:
Sources: Bureau of Labor Statistics, U.S. Department of Labor, Consumer Expenditure Surveys, 2013.
And the following data from the 2013 Travel and Tourism Satellite Accounts or other lodging while on travel:
Sources: Bureau of Economic Analysis, U.S. Department of Commerce, U.S. Travel and Tourism Satellite Accounts, 2013.
The other lodging spending while on travel for the households in the lowest quintile of pre-tax household income was estimated as
= ($140/$649) × $623 or $134 (from the above two tables).
The complete computations for estimating the 2013 per household total travel spending for the households in each of the quintiles of pre-tax income is contained in Appendix 1. Methodoly section of this paper.
The same computations were done for the additional years 2016, 2018 and 2019.
4. Relationship between per Household Total Travel Spending and Per Household Pre-Tax Income in the Years 2013, 2016, 2018 and 2019
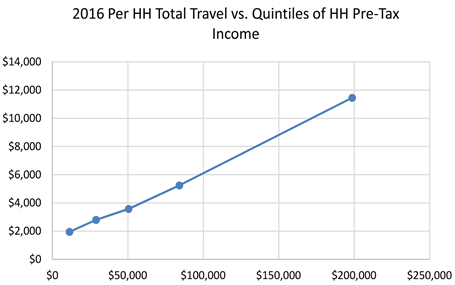
We see similar patterns of increasing per household total travel spending for pre = tax income quintiles in the years 2016, 2018 and 2019 as follows:
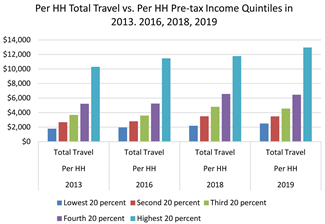
Sources: Bureau of Economic Analysis, U.S. Department of Commerce (2013-2019) U.S. Travel and Tourism Satellite Accounts; Bureau of Labor Statistics, U.S. Department of Labor (2013-2019) Consumer Expenditure Surveys.
The highest pre-tax income quintile dominated the total travel market with over 40% market share throughout the period 2013-2016 as follows:
Sources: Bureau of Economic Analysis, U.S. Department of Commerce (2013-2019) U.S. Travel and Tourism Satellite Accounts. Bureau of Labor Statistics, U.S. Department of Labor (2013-2019) Consumer Expenditure Surveys.
The number of consumer households in each pre-tax income quintile grew gradually between 2013 and 2019 as follows:

Sources: Bureau of Labor Statistics, U.S. Department of Labor (2013-2019) Consumer Expenditure Surveys.
5. Conclusions about Impact of Pre-Tax Income on Consumer Household Total Spending on Travel
Consumer household pre-tax income has a significant impact on consumer spending on total spending on travel as follows:
· This is seen in 2013, 2016, 2018 and 2019 by examining the behavior of the households of various pre-tax income levels.
· This is seen over time between 2013 and 2019 in the growth of average spending per household vs. the average pre-tax income per household.
6. Analysis about the Relationship between per Household Total Travel Spending and Age of Reference Person during 2013 and 2019
Past research by the author for various hotel management companies found that the age of the head of household (now called age of reference person) also had an impact on the travel spending by that household. Let us examine that government spending data for 2013 to 2019.
7. Relationship between per Household Total Travel Spending and Age of Reference Person in the Years 2016, 2018 and 2019
We see similar patterns of increasing per household total travel spending peaking for the age of reference person of 45 - 54 years of age in the years 2016, 2018 and 2019 as follows:

Sources: Bureau of Economic Analysis, U.S. Department of Commerce (2013-2019) U.S. Travel and Tourism Satellite Accounts, Bureau of Labor Statistics, U.S. Department of Labor (2013-2019) Consumer Expenditure Surveys.
Households with reference persons 45 - 54 years of age had the highest market share of the travel market in 2013-2018, with households with reference persons 55 - 64 years of age having the highest market share in 2019.
Sources: Bureau of Economic Analysis, U.S. Department of Commerce (2013-2019) U.S. Travel and Tourism Satellite Accounts, Bureau of Labor Statistics, U.S. Department of Labor (2013-2019) Consumer Expenditure Surveys.
The number of households with reference persons in each bracket changed during 2013-2019 as follows:
Sources: Bureau of Labor Statistics, U.S. Department of Labor, Consumer Expenditure Surveys, 2013-2019.
With only the 65 years & older showing significant growth.
8. How Much of per Household Travel in Households with Different Ages of Reference Persons Is Explained by Income
Let us try to estimate how much of per household travel in households with different ages of reference persons is explained by income:
1) The following were the per-household travel data for households in different pre-tax income quintiles:
Sources: Bureau of Economic Analysis, U.S. Department of Commerce, U.S. Travel and Tourism Satellite Accounts, 2013, Bureau of Labor Statistics, U.S. Department of Labor, Consumer Expenditure Surveys, 2013.
Sources: Bureau of Economic Analysis, U.S. Department of Commerce, U.S. Travel and Tourism Satellite Accounts, 2016, Bureau of Labor Statistics, U.S. Department of Labor, Consumer Expenditure Surveys, 2016.
Sources: Bureau of Economic Analysis, U.S. Department of Commerce, U.S. Travel and Tourism Satellite Accounts, 2018, Bureau of Labor Statistics, U.S. Department of Labor, Consumer Expenditure Surveys, 2018.
Sources: Bureau of Economic Analysis, U.S. Department of Commerce, U.S. Travel and Tourism Satellite Accounts, 2019, Bureau of Labor Statistics, U.S. Department of Labor, Consumer Expenditure Surveys, 2019.
2) Using the above graphs, estimate the per HH travel based on the average HH pre-tax income of each age of reference person category:
Sources: Bureau of Economic Analysis, U.S. Department of Commerce (2013-2019) U.S. Travel and Tourism Satellite Accounts, Bureau of Labor Statistics, U.S. Department of Labor (2013-2019) Consumer Expenditure Surveys.
3) The ratio of the actual per household travel expenses to the estimated income-based per household travel for the various ages of reference persons represents a mixture of the following factors:
a) Number of adults in those households, particularly those aged 18 - 64;
b) Number of children under age 18 in those household;
c) The desire to travel in those households based on two attitudinal characteristics:
i) Willingness or desire to try new things and;
ii) Willingness or desire to spend money;
Sources: Bureau of Economic Analysis, U.S. Department of Commerce (2013-2019) U.S. Travel and Tourism Satellite Accounts, Bureau of Labor Statistics, U.S. Department of Labor (2013-2019) Consumer Expenditure Surveys.
4) The following is information about the composition of the households in 2013, 2016, 2018 and 2019:
Source: Bureau of Labor Statistics, U.S. Department of Labor (2013-2019) Consumer Expenditure Surveys.
Observations about the above table are as follows:
· The presence of younger children is likely to dampen travel spending of the households with reference persons 25 - 34 and 35 - 44 years of age.
· The presence of more adults 18 - 64 years of age would stimulate the travel spending of households with reference persons 45 - 54 and 55 - 64 years of age.
5) Finally, the author’s past research in travel behavior starting in 1979 indicated that two attitudinal characteristics had an impact on the household travel behavior:
a) Willingness or desire to try new things and;
b) Willingness or desire to spend money.
9. Past Research into Impact on Travel Behavior of Household Attitudinal Characteristics
The author did a very large market research study of 2200 households to support a strategic planning review for Holiday Inns, Inc. At that time, we found several apparently anomalous results:
· Younger households, whatever their household income, were spending more on their travel than their income would indicate.
· Older households, whatever their household income, were spending less on their travel than their income would indicate.
As a result, the author consulted with Paul Hase, Director of Market Research for Johnson & Johnson, who had just completed a large Consumer Life Style Study, asking about 100 questions of the respondents. The author found that about 20 questions measured each of two important attitudinal characteristics:
· Willingness or desire to try new things and;
· Willingness or desire to spend money.
And accordingly re-analyzed the data using cluster analysis with the following results.
![]()
Source: Temple, Barker & Sloane analysis of hotel market samples, 1979-1990.
Source: Temple, Barker & Sloane analysis of hotel market samples, 1979-1990.
The following kinds of questions were used to determine a household’s “Desire to Try New Things”:
· We are always the first on our block to try new things.
· We prefer to vacation in less “civilized” destinations.
The following kinds of questions were used to determine a household’s “Willingness to Spend Money”:
· We prefer to travel first-class whenever we can.
· We usually stay at luxury hotels.
Client confidentiality prevents the author from providing a more complete list of questions.
10. Changes over Time in Household Desire to Try New Things and Willingness to Spend
Similar lifestyle attitudinal studies were done by the author between 1980 and 2004 measuring consumer behavior in travel and other discretionary purchasing areas: jewelry, consumer home electronics, automobiles with success. However, lifestyle attitudes did change over time as follows:
· Household selection of travel brands and destinations depended on these lifestyle attitudes as well as the sheer volume of travel spending.
· There was a significant increase in the desire to try new things and willingness to spend.
o Older households with reference persons over 45.
o Households with children still living at home, particularly older children.
· This is confirmed by the analysis of spending on travel in the 2013-2019 period as being primarily driven by household income and secondarily by stage of household maturity.
· There was a continued growth in household spending on “experience” vs. acquisition of physical assets, benefitting the travel and tourism sector.
11. Need for Continued Research in the Drivers of Household Spending on Travel
However, we need to recognize that lifestyle attitudes are not static. It is important that we continue to measure these changes in our consumer/household research. This will lead to more intelligent:
· Capacity planning;
· Brand management/market segmentation;
· Product design and positioning;
· Service quality management;
Appendix 1. Methodology: Relationship between per Household Total Travel Spending and per Household Pre-Tax Income
Analysis of Relationship between Per Household Total Travel Spending and per Household Pre-Tax Income in the Year 2013
The Consumer Expenditure Survey published annually by the Bureau of Labor Statistics of the Department of Commerce. It is based on diary and interview samples of 12,000 households.
One of the ways the resultant data is analyzed is by household pre-tax income quintiles. In 2013, the following top-line results were determined by pre-tax income quintiles:
Sources: Bureau of Labor Statistics, U.S. Department of Labor, Consumer Expenditure Surveys, 2013.
The expenditures per household were broken down into:
· 14 spending categories (such as food, shelter, transportation);
· 63 spending sub-categories (such as food away from home, rented dwellings, vehicle purchases).
The categories and subcategories of household spending directly involved in the purchase of travel in 2013 by pre-tax income quintiles were the following:
Sources: Bureau of Labor Statistics, U.S. Department of Labor, Consumer Expenditure Surveys, 2013.
The travel spending by all consumer households in 2013 were broken down into the following spending components in the Bureau of Economic Analysis Travel and Tourism Satellite Accounts as follows:
Sources: Bureau of Economic Analysis, U.S. Department of Commerce, U.S. Travel and Tourism Satellite Accounts, 2013.
These components can be assigned to the consumer household categories and sub-categories as follows:
Sources: Bureau of Economic Analysis, U.S. Department of Commerce, U.S. Travel and Tourism Satellite Accounts, 2013, Bureau of Labor Statistics, U.S. Department of Labor, Consumer Expenditure Surveys, 2013, Author’s analysis.
These travel expenditures are then allocated to the pre-tax income quintiles in proportion to the category/subcategory per household spending patterns (For example, the lowest quintile of travel spending for other lodging is calculated as ($140/$649) × $623 = $134.) yielding the following table for 2013 per household total travel spending by income quintile:
Sources: Bureau of Economic Analysis, U.S. Department of Commerce, U.S. Travel and Tourism Satellite Accounts, 2013, Bureau of Labor Statistics, U.S. Department of Labor, Consumer Expenditure Surveys, 2013, Author’s analysis.
And the following total household spending on travel by income quintile in 2013:
Sources: Bureau of Economic Analysis, U.S. Department of Commerce, U.S. Travel and Tourism Satellite Accounts, 2013, Bureau of Labor Statistics, U.S. Department of Labor, Consumer Expenditure Surveys, 2013, Author’s analysis.
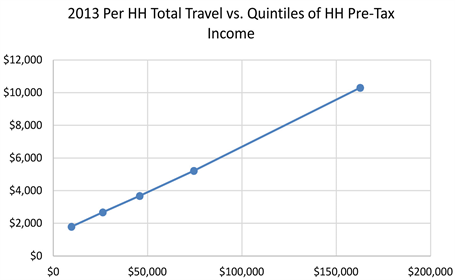
Per household total travel spending in 2013 by quintiles of pre-tax income may be summarized as follows:
![]()
Sources: Bureau of Economic Analysis, U.S. Department of Commerce, U.S. Travel and Tourism Satellite Accounts, 2013, Bureau of Labor Statistics, U.S. Department of Labor, Consumer Expenditure Surveys, 2013, Author’s analysis.
Total travel spending by consumer households in 2013 by quintiles of pre-tax income may be summarized as follows:
Sources: Bureau of Economic Analysis, U.S. Department of Commerce, U.S. Travel and Tourism Satellite Accounts, 2013, Bureau of Labor Statistics, U.S. Department of Labor, Consumer Expenditure Surveys, 2013, Author’s analysis.
This demonstrates a clear income effect on consumer household spending on total travel in 2013.
Appendix 2. Methodology: Relationship between per Household Total Travel Spending and per Household Age of Reference Person
Relationship between per Household Total Travel Spending and Age of Householder during 2013
In 2013, the following top-line results were determined by age of reference person:
Sources: Bureau of Labor Statistics, U.S. Department of Labor, Consumer Expenditure Surveys, 2013.
The categories and subcategories of household spending directly involved in the purchase of travel in 2013 by age of reference person were the following:
Sources: Bureau of Labor Statistics, U.S. Department of Labor, Consumer Expenditure Surveys, 2013.
The travel spending by all consumer households in 2013 were broken down into the following spending components:
These components can be assigned to the consumer household categories and sub-categories as follows:
Sources: Bureau of Economic Analysis, U.S. Department of Commerce, U.S. Travel and Tourism Satellite Accounts, 2013, Bureau of Labor Statistics, U.S. Department of Labor, Consumer Expenditure Surveys, 2013.
These travel expenditures are then allocated to the age of reference person category in proportion to the category/subcategory per household spending patterns (For example, the under 25 age of reference person of travel spending for other lodging is calculated as ($213/$649) × $78,298.) yielding the following table for 2013 total travel spending by age of reference person:
And the following per household spending on travel by age of respondent in 2013:
Sources: Bureau of Economic Analysis, U.S. Department of Commerce, U.S. Travel and Tourism Satellite Accounts, 2013, Bureau of Labor Statistics, U.S. Department of Labor, Consumer Expenditure Surveys, 2013, Author’s analysis.
Total travel spending by consumer households in 2013 by quintiles of age of reference person may be summarized as follows:
Sources: Bureau of Economic Analysis, U.S. Department of Commerce, U.S. Travel and Tourism Satellite Accounts, 2013, Bureau of Labor Statistics, U.S. Department of Labor, Consumer Expenditure Surveys, 2013.
And per household total travel spending in 2013 by age of reference person may be summarized as follows:
![]()
Sources: Bureau of Economic Analysis, U.S. Department of Commerce, U.S. Travel and Tourism Satellite Accounts, 2013, Bureau of Labor Statistics, U.S. Department of Labor, Consumer Expenditure Surveys, 2013.
This demonstrates a clear effect per household spending on total travel in 2013 of the age of the reference person with the peaking of the spending occurring for households whose age of reference person is 45 - 54 years. There is a similar effect in the years 2016, 2018 and 2019.