Experimental Abrasion Study of the Evolution of Gold Morphological Criteria in Different Sediments as a Function of Time ()
1. Introduction
The dynamics of gold in surface materials in tropical regions have been the subject of numerous studies: [1] and [2] , in the Gabonese forest; [3] [4] and [5] in the savannahs and steppes of Burkina Faso, [6] in eastern Senegal. In weathering profiles, gold particles often show evidence of having undergone dissolution. This can be seen in the blunting of surfaces, the appearance of dissolution pits, and an increasing loss of silver content from the edges to the core of the particles [7] . Gold is therefore likely to record in its surface states and the evolution of its shapes, part of the history of the physico-chemical processes of the supergene materials in which it has evolved. However, certain aspects, such as the impact of transport on the morphoscopy of gold particles in the particular hydrodynamic and geomorphological context of the Sudano-Sahelian regions, merit further investigation. It is in this specific case that the present work has focused.
To this end, we have carried out experimental abrasion of gold particles to study the evolution of contour states (regular, irregular), surface states (blunt, rough), shape (elongation) and size (dimension).
The aim is to identify and quantify the impact of transport and weathering on gold particles, in an attempt to understand their morphological and chemical evolution during the deposition of colluvial and alluvial materials in tropical environments with contrasting seasons.
The aforementioned criteria are studied using Aphelion image processing software, based on scanning electron microscope photos of the particles before and after the experiment.
This idea arose from the need to quantify the morphological study rather than relying solely on descriptive criteria. We thus followed the evolution of morphological criteria for gold in different sediments as a function of time.
This study should make it possible to refine a prospecting tool that has been used successfully in the Andes [8] and to adapt it to the regional morphoclimatic context where it is little or not used. The results obtained will provide elements for improving prospecting and metallogenic knowledge of birimian gold showings.
2. Materials and Methods
2.1. Site Presentation
The study was carried out at Tenkoto in eastern Senegal, 40 km northeast of Kédougou (Figure 1).
Tenkoto is located on the West African craton, in the Kédougou-Kéniéba buttonhole, which comprises the Mako, Dialé and Daléma geological series.
It lies in the Sudano-Guinean climatic zone, where rainfall varies between 700 and 1000 mm. The climate is characterized by a five-month rainy season (June to October) and a seven-month dry season (November to May).
The hydrographic network is loose and anastomosing at the level of the basic rocks, and not very sinuous at the level of the acid rocks.
2.2. Study Methods
To study the variation in morphological criteria, five experiments were carried out in three phases each. Each phase consisted of a mixture of twenty (20) gold particles, 150 g sediment and 100 ml distilled water (200 ml for experiment 5). Experiments are carried out under natural conditions identical to those in the field.
![]()
Figure 1. Location map of the study area.
The abrasion apparatus consists of a machine with a horizontal axis to which two series of trays are symmetrically attached on either side. Six flasks containing the material to be tested are attached to these trays. The trays, parallel to and integral with the rod, are set in rotary motion around the latter by an electric motor (Figure 2).
The flasks containing the abrasive material and gold particles are cylindrical, 8 cm in diameter and 11 cm high.
The material used is a fine alluvium from the bed of the Tenkoto marigot for experiment 1, a natural coarse sediment from the base of the alluvium of the Tenkoto marigot for experiment 2, a reconstituted coarse sediment for experiment 3, a reconstituted fine sediment for experiment 4 and finally the same natural coarse sediment from experiment 2 with a low solid load for experiment 5. The grain sizes of the sediments used in the experiment are shown in Table 1 below.
At the end of each experimental phase, the particles are collected by automatic beating using a “gold wheel” (Figure 3), then sorted and counted using a binocular magnifying glass.
The particles were then examined and photographed using a Scanning Electron Microscope (SEM). Images taken before and after experimentation were processed and interpreted using Aphelion image processing software.
Four criteria were used to study the evolution of particle morphology: roughness, bluntness, size and elongation. Units of measurement are left in pixels for convenience.
- Regularity is determined by the ratio of surface area to perimeter. For a square, regularity equals (a2/4a) = (a/4), and for a circle it equals (πR2/2πR) = (R/2).
![]()
Table 1. Grain size of sediments used for experimentation.
- Elongation is determined by the formula: E = (L − l)/(L + l) with L = major axis and l = minor axis; E = 0 for a circle and tends towards 1 for a long, narrow ellipse.
- The size T = (L + l)/2 is the average of the major axis (L) and minor axis (l);
- The nature of the surface is determined by the ratio of the total edge length Lc in pixels to the particle area S in pixels: R = Lc/S, with R = 0 for smooth surfaces and tends towards 1 for rougher surfaces. This corresponds to an estimate of the surface area occupied by edges relative to the total surface area.
The criteria for contour, surface finish, shape and size are determined before and after the 5 experiments carried out. This made it possible to monitor the rates of change of these criteria over time. These rates are calculated according to the formula T = (Ef − Ei) × 100/Ei, where Ei = initial state and Ef = final state.
Stirring times of 48, 96 and 120 hours were chosen, as changes are not very significant at the 24-hour time interval, and the evolution of the weight of the particles tested was constant from 120 hours onwards [9] .
3. Results and Discussion
3.1. Experiment 1
The first experiment produced the results shown in Figure 4 below.
The results show an increase in size of +12% compared with primary particles within the first 48 hours. At 96 hours, the rate is +14%. Beyond this point, the increase is reduced to +8% (Figure 4).
SEM analysis of the particles shows that the increase in size is due to flattening (Photo 1). After 96 hours, there is a significant folding of the edges, which reduces the increase to 120 hours (Photo 2).
Edge folding begins as early as 48 hours on some particles. This explains the high degree of edge regularity, which rises to +26% and then 30% after 96 hours, before remaining virtually constant (Figure 4).
The flattening of particles results in a blunting of their surfaces, reaching a rate of +26% at 48 hours. After 96 hours, the trend seems to stabilize at +31% (Figure 4).
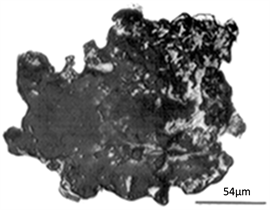
Photo 1. Flattened and blunted old particle after 96 hours of agitation.
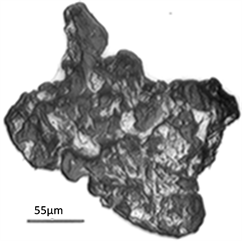
Photo 2. Gold particles with folded and rounded edges after 120 hours of agitation.
For elongation, the general trend is a decrease of −34% at 96 hours and −4% at 120 hours (Figure 4).
3.2. Experiment 2
The second experiment gave the results shown in Figure 5 below.
Particle size increases by +4% at 48 hours, then gradually decreases to -17% at 120 hours (Figure 5).
This change in size can be explained by particle flattening (Photo 3), which occurs simultaneously with fragmentation and edge folding. Indeed, after the experiment, six (6) particle fragments were found in addition to the initial 20 particles.
At 96 and 120 hours, fragmentation and edge folding dominate over flattening (Photo 4), which explains the reversal of the trend. The number of fragments found is fifteen (15) at 120 hours.
Contour regularity peaks at 48 hours, increasing to +79%, then decreases sharply to +24% at 96 hours and rises slightly to +37% at 120 hours (Figure 5). The start of fragmentation and the folding of particle edges at 48 hours explain
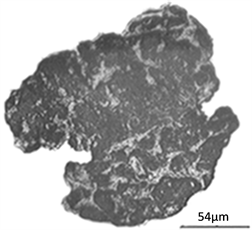
Photo 3. Flattened gold particle after 48 hours of agitation.

Photo 4. Gold particle with regular contours following intense edge folding after 120 hours of agitation.
the peak in regularity at the same time. But as fragmentation intensifies from 96 hours onwards, new irregular contours appear (Photo 5), leading to a sharp drop in regularity. At 120 hours, these new contours begin to round out.
The onset of flattening at 48 hours produces a surface blunting rate of +39%. This rate decreases slightly to +31% at 96 hours, then remains constant. This decrease coincides with intense fragmentation, giving the particles low surface blunting.
Particle elongation decreases by −12% at 48 hours, then remains virtually invariant at 96 and 120 hours.
The results show an increase and then a decrease in particle size due to flattening, folding and fragmentation. Fragmentation slows down the evolution of contours and surfaces, as new sharp edges appear.
3.3. Experiment 3
The third experiment produced the results shown in Figure 6 below.
![]() Photo 5. Gold particle, with new irregular contours following fragmentation after 48 hours agitation.
Photo 5. Gold particle, with new irregular contours following fragmentation after 48 hours agitation.![]()
Figure 6. Rate of change of criteria.
Particle size decreases progressively until 96 hours, when the rate is −6%. Beyond this point, the rate drops to −12% (Figure 6).
This decrease is due to particle fragmentation at the start of the experiment. Indeed, 2 fragments were found at 48 hours, 9 fragments at 96 hours and 13 fragments at 120 hours.
This fragmentation and the folding of the edges are at the origin of the regularity of the contours, which progressively evolves until 96 hours, when it reaches +40%. All particles have a very rounded contour (Photo 6). At 120 hours, the rate drops slightly to +36% (Figure 6).
The particle surfaces are very blunt, and the blunting rate rises to +56%. It then seems to reach a plateau of +60% at 120 hours. Almost all asperities are smoothed.
Elongation trends fluctuate, with an elongation of 5% at 48 hours. This elongation trend reverses at 96 hours, when kernels become less elongated at −11%. At 120 hours, there is no noticeable change (Figure 6).
The particles decrease in size, while the regularity of their contours and the bluntness of their surfaces are clearly visible. This is due to fragmentation and edge folding.
3.4. Experiment 4
The results of Experiment 4 show little change in particle size, with a slight decrease of −5% at 48 hours (Figure 7). This can be explained by the absence of particle fragmentation and by the fact that the edges of the particles remain almost intact (Photo 7).
This weak evolution of the primary state of the particles also explains the weak evolution of the contours. The latter is characterized by the regularity of the contours from 48 hours onwards, with a rate of +13% which reverses and decreases to −9% at 120 hours (Figure 7). This also explains the slow change in surface condition, which peaks at a hard-to-explain rate of +41% at 48 hours. From this point onwards, the rate decreases considerably, reaching −6% at 120 hours (Figure 7).
Elongation varies little, dropping to −9% at 96 hours. Apart from a blunting tendency, particles evolve little overall.
![]() Photo 6. Gold particle with rounded contours and folded edges after 96 h of agitation.
Photo 6. Gold particle with rounded contours and folded edges after 96 h of agitation.![]()
Figure 7. Criteria evolution rate.
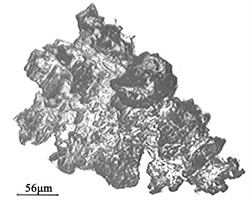
Photo 7. Sligthly evolved gold particle after 120 hours of agitation.
3.5. Experiment 5
The fifth experiment produced the results shown in Figure 8 below.
Particle size decreases progressively until 96 hours, when the rate is −26%. After that, the rate drops to −17% (Figure 8).
This sharp reduction in size can be explained by the folding of the edges (Photo 8), which takes place at the same time as strong particle fragmentation. In addition to the 20 particles tested, 18 fragments were recovered at 48 hours and 22 fragments at 120 hours.
This edge folding is also responsible for the high degree of contour regularity, which rises progressively to +39% at 96 hours. It then drops to +36% at 120 hours (Figure 8). With significant edge folding and fragmentation, the blunting rate is initially low. It then shows a small plateau of +19% between 48 and 96 hours. Particle surfaces are heavily pitted, giving them a rough appearance (Photo 9).
Elongation increases from 48 h, reaching +17% at 120 h.
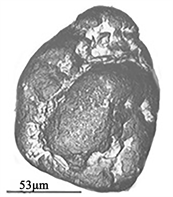
Photo 8. Gold particle with folded and rounded adges afetr 48 hours of agitation.
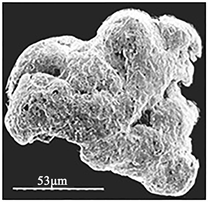
Photo 9. Gold particle with pitted surface.
Particles show strong fragmentation and edge folding, reducing size, contour regularity and elongation.
3.6. Discussion of Size Variations
In experiment 1, where there is a slight proportion of coarse material (8.5% > 1 mm), size increases considerably, reaching a rate of +14% before decreasing (Figure 9). In experiment 4 (fine material < 1 mm), the change in size is not very significant. A higher proportion of coarse material (80% > 1 mm for experiment 2) increases size, but only by +4%, with a gradual decrease reaching −17%. If the material is entirely coarse (>1 mm), the size decreases and can reach −16% (Figure 9).
The evolution of particle size is therefore a function of the granulometry of the material. Fine sediments alone have little influence on particle size evolution, as they are neither fragmented nor folded. Coarse sediments alone, on the other hand, produce fragmentation and edge folding. The greater the fine fraction, the more the particles flatten before fragmenting.
As sediment is diluted, particles are systematically fragmented and folded. The highest reduction rates are reached here (−26%), as water amplifies the effect of the coarse fraction.
3.7. Discussion of Variations in Contour States
In all experiments, particle contours are more regular, with the exception of Experiment 4 (Figure 10), where regularity fluctuates. Some particles change little, while others retain their primary state. With a low proportion of coarse particles (experiment 1), evolution is progressive and produced by edge folding. When the proportion of coarse particles is high (experiment 2), the highest levels of regularity are reached (+79%), although the evolution is not regular. There is both flattening and folding of the grains. On the other hand, with greater dilution (experiment 5), particles are more frequently fragmented and the new contours are less regular. This implies a drop in regularity rates. We also note that a similar phenomenon occurs when the mixture is made up only of coarser elements with a lower amplitude.
3.8. Discussion of Surface Variations
It is only in experiments 1 and 3 that roughness evolves regularly. With the exception of experiment 4, all other experiments show particles with blunted surfaces. The highest rates of blunting are observed in the experiment with entirely coarse sediments (experiment 3), with +60%. Asperities (edges) are flattened by shocks, which are weaker the higher the proportion of fine sediment (Figure 11).
Dilution (experiment 5) slows particle blunting, which explains why its curve evolved more slowly than that of experiment 2. Dilution also causes the particles to sting and appear rough.
3.9. Discussion of Elongation Variations
Elongation is regular in experiment 5, where it shows the highest rate (+17%). In the other four experiments, elongation is random and has no correlation with sediment grain size. For example, in experiments 3 and 4, with only coarse and fine sediments respectively, the curves evolve concomitantly (Figure 12).
![]()
Figure 9. Gold particle size evolution rates.
![]()
Figure 10. Rate of change of gold particle regularities.
![]()
Figure 11. Rate of change of gold particle blunts.
![]()
Figure 12. Elongation rates of gold particles.
4. Conclusions
Experimental abrasion of gold particles shows that particle size is a function of material grain size. Fine sediments alone have little influence on particle size evolution. On the other hand, coarse sediments alone lead to systematic fragmentation and edge folding. We also note that dilution amplifies the effect of the coarse fraction.
When the proportion of coarse sediments is high, high levels of regularity, flattening and grain folding are achieved. The highest bluntness rates are also obtained.
Experimentation shows that most of the particles studied show signs of mechanical transport, with folding, flattening and streak marks: they are therefore of secondary types.
Our results show that the main driving force behind morphological changes is the impact forces produced when the gold moves with the material. Impact forces are controlled by three factors: the amount of fine sediment, coarse sediment and water (if the speed of movement is taken as constant, as in our case).
In the future, it would be useful to extend the agitation time to see how the particles behave beyond 120 hours. We also need to study the influence of velocity by shaking particles for the same distance but at different speeds. Finally, we need to compare the particles used for the experiment with natural particles from the field.