The Greek and the Norwegian Shipping Industries: Why Are These Two at the Top of the 13 Global Shipping Nations for So Long? ()
1. Introduction
Greece is known to maritime historians for its shipping activities in the Mediterranean up to 375 BC, and its active “commercial” towns of Corinth1 and Athens2. Greeks became capable maritime traders, having a kind of a “market” economy at that time, after their competitors—the “Phoenicians” sea merchants—declined.
As Athens expanded, more grain had to be imported—and this was one of the earliest bulk trades—according to Herodotus (c. 620 BC). By 575 BC, the Eastern Mediterranean became a very active trading area with 2 main cities: Athens & Rhodes (Stopford, 2009: p. 9) . Greeks traded wine, oil, and pottery, in exchange for the “Carthaginian” and “Etruscan” metals, the products of Egypt and the East.
Grain and fish products were imported from the Black Sea in Greece. By 500 BC, Greece founded more than 100 colonies, fact which favored the Hellenic trade, and a number of shipping, cultural, and religious penetrations in the people living along the coasts of Mediterranean Sea and up to Gibraltar.
During the Rome’s time, the trade in the Mediterranean centered round the Italian coasts. In about 650 AD, the administration of the “Eastern Roman Empire” felt strongly the growing Hellenic presence, as well influence, especially in matters of language, public administration and nationality, so that to emerge the “Byzantine” Empire run by the Greeks.
Greece had the great misfortune to be occupied by Türkiye from 1453 to 1829, following the fall of the “Byzantine Empire”. Fortunately, the Turks had no connection with the sea, commerce and shipping, and thus allowed Greeks to serve their seaborne trade, even under their flag, as well as under the flag of Russia! Know-how, experience and efficiency make the enemy to co-operate with the enemy.
Norway appeared in 2000 BC, and is mostly known for its Kingdom it has established, the “Vikings” (800 - 1050 AD), which were sailors, farmers, warriors and merchants! Moreover, Norway emerged as a serious shipping power in 1870. Greece, however, was a more ancient civilization than the Norwegian one, and Greeks organized the Hellenic people, so that to be able to carry out a 10-yearly war as one nation using naval ships, against Troy, in 2000 BC!
Research concerning the comparative development of the 2 protagonist shipping powers, like Greece and Norway, we could not find. Also, the similarities—at first sight—are challenging and many mentioned them in their research dealing separately with each of these 2 countries. This paper revealed also the factors that made these 2 nations different, especially in the way of increasing their shipping power. Greece under all flags multiplied its 1988 fleet 4.44 times vis-à-vis Norway.
2. Aim and Structure of the Paper
The aim of the paper is to analyze the common/uncommon properties of two shipping powers—protagonists in the international maritime affairs for centuries: “Greece and Norway”. They played, and play, a protagonist role, for at least 120 years in serving Seaborne Trade. We wondered, however, all along, why was, and is, this so…? If we assume that this was a random event, how these 2 countries stay for 12 decades at least, on the very top 13 shipping nations? What common properties had/have these two geographically distinct nations: one in the North and the other in the South of Europe? Revealing the essential maritime properties we may help other nations to become also like them, i.e. protagonists…, we believe, as far as this is possible!
The paper is organized in 8 parts after literature review: Part I dealt with the first 122 years of the entire international shipping industry (since 1900); Part II dealt with the new brand of ship-owners which emerged after the “Bretton Woods” agreement; Part III dealt with Norway as a top shipping power since 1900; Part IV dealt with what it means to be a “tramp” ship-owner in the shipping industry; Part V dealt with the issue: “one task is to become a great shipping power, internationally, and another is to stay also there”; Part VI dealt with the Greek-owned shipping, since 1856; Part VII dealt with the question: “Can a shipping industry be more competitive by flying the flags of convenience?”; Part VIII dealt with the factors, which contribute to obtain a higher share in the world fleet, apart from flying the flags of convenience. Finally, we concluded.
3. Literature Review
Stokes (1997) gave an extensive account of the conditions3 in which Norwegian shipping found itself during the 1973-1977 period, starting with the October 1973 Arab-Israeli war, the subsequent oil embargo and the raising of the oil price from round $2.4 (1973 beginning) per barrel (Arabian light crude) to $~11 in Jan 1974. Tankers were then 215 m dwt and 197 m dwt on… order, with a great emphasis on the VLCCs and ULCCs, serving mainly the Gulf transport. Given the frequency with which Norwegian ship-owners ordered new-ships and their low ratio of liquid to fixed assets, they were bound to be the first to feel the full blast of the changed markets and to have a number of victims: Reksten, Waage and another 5, including Havtor, Fearnley & Eger.
Jenssen and Randoy (2006) investigated the issue of how innovation contributed to company performance in Norwegian shipping by surveying 46 units. Past research suggested that innovation slowed-down also among shipbuilders and shipping companies. The head-on competition in both regional and national market was at a moderate level. Foreign seamen became dominant (1995). In 2004 (01/10), the Norwegian fleet made-up with about 28% of oil tankers in GT and 24% in bulk ships plus 11% in other dry cargo. The Gas tankers held 8%; chemical tankers 13% (total 41 m GT).
Lorange (2009) argued that the “European nations”—including Norway—used to be dominant owners of shipping fleets, but the emerged low-cost flags of convenience gradually took-over the larger shares of ownership. He further argued that Oslo was a prime global shipping cluster, and analyzed the benefits for a shipping company to be there. The Norwegian ship-owners are largely absent when one comes to “container shipping”, given their all along focus to tramp shipping. They, however, focused heavily on “Ro-Ro” ships later on!
Stopford (2009: p. 674) argued that Norway in 2005 had 67% of its (44 m GT) tonnage flagged-out, including NIS. Greece also had 67%. In 1987, the Norwegian Government was concerned about the trend towards flagging-out and set-up the NIS to give Norwegian owners most of the benefits they would receive under an international flag!
Moreover, Norway in end 1980-1990 invented a system to mobilize the savings of the Norwegian people towards shipping by establishing the so called K/S “limited partnerships” towards buying a single ship. This system, in 1987-1989, raised $3b and covered 1/2 of the shipping industry, where the banks put the 80% as a loan! There were tax advantages, 25% annual depreciation and the management was subcontracted. 20% paid in cash and 20% in 2 years.
The above system resembles the leasing one practice applied by the Chinese finance organizations nowadays. By early 1990-2000 the K/S system acquired a mixed reputation after a series of losses… and revived in 2000-2010. The tax benefits reduced in early 1990-2000. Many disasters have been occurred when the owners of money (the banks) tried to become the owners and managers of ships (ship-owners), according to our experience!
Heidbrink (2012) provided a historical perspective of the business of shipping arguing that shipping has been affected by 4 factors and mechanisms: 1) the geopolitics; 2) the maritime technology; 3) the specialization in ship types; and 4) the heavy competition from other means of transport like air.
Heaver (2012) argued that the current state of maritime economics is far removed from its historic roots because the maritime industries became more complex and sophisticated, supported by commercial and consulting businesses that bear little resemblance to their forebears.
Summarizing, we may commend only on the recent trends in China to buy a plethora of 2nd hand ships, and to order new-buildings, by devoting several $ billions, and appointing ship managers to run them. Such systems in order to be successful have to apply the “perfect timing strategy”, and the managers running them to be honest and capable in providing profit to the banks along with their management. Our long experience from shipping endeavors has taught us that the one not knowing deeply the mechanics of running a vessel gets-out as a loser from any partnership with those they know… the secrets of the profession.
4. Methodology
Our research had 2 targets: 1) to reveal the factors that have worked so that a shipping country to be first established, and 2) to show how this power can be kept and increase over the centuries, leading to one of the top worldwide positions!
Part I: The first 110 years of the international shipping industry (since 1914).
The global sea transport in 1914, just before the start of the Great War, carried-out by 24 top international shipping countries (Figure 1). As shown, Greece held the 10th position with 1.46 m (569 steam ships) (adding 0.64 m since 1914). Norway had a better position, (the 5th), than Greece, with ~4.1 m GRT (& 1981 steamers). Worth noting is that Norway had a stronger beginning than Greece! The world fleet then, owned ~45 m GRT (1914) and ~69 m in 1931 (1.5 times higher).
4.1. The Role Played by the Tradition in the Shipping Endeavors
From the above 24 maritime nations, mentioned above, we will choose 13, which we will call them as traditional. These 13 countries have gradually reached the top 13 positions of the international shipping fleet!
“Tradition” is a strong property for a shipping nation to be in the shipping businesses. Greece and Norway had a ship-owning tradition. Tradition means that one generation of ship-owners is followed by another, and by another, and the one “teaches” the “business of shipping” to the other, passing on also the
![]() Source: Data from “Naftika Chronica”, a Greek maritime journal, 1931.
Source: Data from “Naftika Chronica”, a Greek maritime journal, 1931.
Figure 1. The top 24 fleets plus others in 1914 and in 1931 by flag.
required fleet etc. to their sons (originally)/and to their daughters (later)4! Tradition allows Merchant marines to exist for generations relaying knowhow, fleet, reputation etc., from the one generation to the other.
Large ship-owning families, and marriages among ship-owners, boosted the whole achievement… of producing ship-owners (Goulielmos, 2017) . There were two trends: 1) splitting-out a family cluster to individual entrepreneurs/companies (where brothers, sisters, sons and daughters etc. set-off) and 2) one uniting and reinforcing the existing fleets when the priest called the ship-owners of different sex, “Man and Wife”!
The Greek characteristic of when there are 2 Greeks, there are 10 different opinions, led to a quite number of new companies! The intra-ship-owners marriages however, led to fewer companies, but stronger ones, which, in turn, created a number of other companies, like e.g. the “Angelicoussis Anna’s group”. Characteristic example is also the 3 Martinos brothers—Dinos, Thanasis and Andreas, who have created 3 separate companies—“Thenamaris”, “Eastern” and “Minerva” starting from a joint one in the 1950s.
Certain of the Greek ship-owners are patriots and fly their country’s flag in their vessels. Others are not, but most they become such, after their death (Onassis, Niarchos, and many others) by establishing a number of benevolent foundations. And still others make donations to their country during their life time5…
4.2. The 1902-2005 Picture of the Traditional Fleets
We selected 3 separate dates: 1902, 1950 and 2005 to present the progress of the global fleets of the 13 traditional shipping nations (Figure 2). As shown, the 13 shipping countries were on top, globally, since 1902 and till 2005 (for over 100 years). Greece owned 5% and Norway 0.55% (2005). Greece’s expansion, in particular, was very fast, and impressive, and surpassed Norway by 2005. The above 13 countries had/have also a number of historical shipping companies.
4.3. The Global Shipping Main Areas, 1902-2006
The global main areas related to shipping, since 1902, were: W Europe, Asia, Liberia, Panama and USA (Figure 3).
As shown, the W Europe lost its former, and increasing, shipping power in
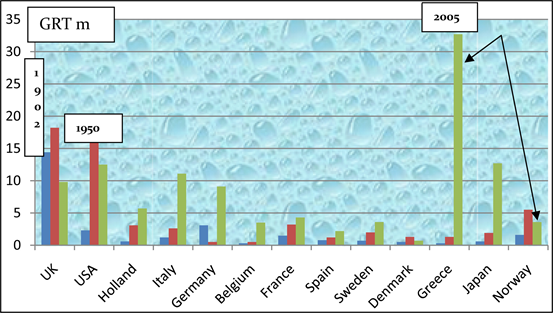
Source: Data from Stopford (2009: p. 43) ; the US reservefleet of 11 m (1950), Denmark’s parallel register of ~7 m (2005), Liberia’s ~55 m (2005) & Panama’s ~136 m, and others of ~583 m (2005) are excluded; the world’s totals were: ~32 m (1950); (1902) ~85 m & (2005) ~652 m GRT (rise 7.7 times since 1950).
Figure 2. The world merchant fleet made-up by 13 top & traditional shipping countries, 1902; 1950; 2005.
1978 (-1987). This considered being the result mainly of the growing power of the open registries (Panama and Liberia, gradually after 1945, owning a fleet of 16 m GRT then).
4.4. The Emergence of the Flags of Convenience in 1940s
At that time, all flags were distinguished in those of which their ship-owners, flying them were their nationals, and those that they were not. Thus, eight nations only qualified—a few decades ago—to have a genuine link, as named, between their flag and their ownership: USA, UK, Norway, Japan, Italy, the Netherlands, France and West Germany.
Worth noting is that Liberia and Panama owned nothing in 1902. Later became known as “flags of convenience”. This means that the ship-owners of Liberia and Panama registered their ships there for various convenient reasons, which were offered by these countries, like low or zero taxation, freedom to choose crew nationality, and others.
In 1950, 71% of the international fleet registered in Europe and USA. By 2005 this fell to 11%! This, we believe, is the result of the “globalization” of shipping, started when Panama and Liberia hosted the fleets of other countries by majority (89%). The international maritime community and the banks accepted the fact, which was for the world ships to be able to choose freely the flag they wanted and the nationality of crew etc. they wished.
The flags of convenience can be equal members of the international maritime community, provided that the ships registered in them follow the safety standards of the nations of their owners. Given also that international community allowed globalization in the shore industries, why not to allow it also to shipping? This, however, has to be done by caring for crew safety. A good example, which follows our argument, is the Norwegian parallel registry (NIS), established in 1987.
To have ships under flags of convenience does not mean that a ship-owner can avoid a great part of his/her total cost. There are few things that a nation can influence, as most6 of the shipping costs are international. This subject is proposed for further research.
In Europe, the “dual” registries before the end of the 1981-1987 depression, were rare. Given, however, this long and deep depression, many European countries established them to reduce their costs of operation, like Norway, Denmark, Portugal, Spain, France, Netherlands, Germany, and the UK before them7 and others.
Countries like Greece8 did not feel the need to establish a dual registry as they were satisfied mainly by the services provided first by Liberia, Panama, then by Malta, Cyprus and others. As a result, after 1986, the flag ceased to be the main big strategic factor providing a competitive advantage to ones and not to others! The human element9 remained, and upgraded, no doubt, however, as the crucial factor in shipping, attracting also the agony of the Greek ship-owners for their proper and adequate supply! Global ship-owners shout-out regularly also on the lack of officers! Thus competition among shipping nations concentrated to their human element, where Greeks and Norwegians had a historical advantage...
4.5. Shipping Has Been Pursued by Almost All International Countries
Almost all10 countries worldwide attempted by now a rapid growth of their fleets, including par excellence Japan (from 1.9 m GRT in 1952 to 18.5 m in 1997, almost a 10 times rise), S Korea and China.
Part II: The new brand of ship-owners we should have after the “Bretton Woods” agreement.
After the “Bretton Woods11” agreement a brand of new ship-owners had to emerge, some of them called “independents12”, like Onassis and Niarchos. These ship-owners knew that they had to identify13 immediately their (new) charterers (customers). This structural change was like the one which happened soon after the time14 when separation of the ownership of cargo from the ownership of the vessel occurred. Another subject for further research.
The Greeks and the Norwegians identified their charterers15, among the multinational oil companies, the steel mills, and the aluminum producers (Stopford, 2009) ! The secret of course was that even if these charterers had their own fleets16, the independents… were more efficient! The flags of convenience helped them to be so!
The big charterers, mentioned above—aware of the mechanics of capitalistic system—knew that the freight rate, which they had to pay, it could be “made” lower! And this was possible, if the demand for ship space was reduced (according to the famous “law of demand”) (Graph 1).

Source: Author.
Graph 1. Demand & supply for carrying crude oil.
The oil companies when they saw that the freight rate begun to rise, towards say F1, invited the independents to offer them a time charter of 7 - 10, or so, years, under the understanding to build the tanker required (meaning to build the ships, which destined to satisfy part of their estimated spot demand!). Ship-owners submitted this time charter to a bank, and obtained also the finance needed to build the vessel…
The result was for the oil companies to withdraw part of their forthcoming demand from the spot market, D1 → D2, and to increase supply of ship space in the short term, and after their time-charter expired, S1 → S2. The freight rate paid by so doing by oil companies was certainly lower than it could be without this policy!
Our experience as economists taught us that every one knowing the mechanics of the capitalistic system tries to exploit it to his/her benefit!
The independents, doing as above, obtained a tanker financed by 70% - 80% by the banks, at a time charter indeed not allowing17 too wide margins of profit, but given: 1) their more efficient management and crew… 2) the cost of the flags of convenience, as well 3) economies of scale, they would extract a profit after all, so that to repay the bank within say 7 years or so, and then have a ship which has paid all her loans to make some real profit, certainly for another 8 years or so!
One thing, the independents—and all others-, did not take into account: that the economies of scale are indeed a profitable and simple target, provided that analogous cargo-loads exist! In 1973, and thereafter (1975; 1979), such cargo-loads did not exist!
1) The economies of scale changed the magnitude of risk in shipping businesses
The post 2nd WW shipping markets placed certain new claims. Ships started to embody serious amounts of funds, due to their increasing size. The funds were mainly derived from the banks, and a need emerged to understand risk and how to manage it. The standard deviation used was an inadequate/dangerous tool, but there was no other then (Goulielmos & Psifia, 2006) .
Greek ship-owners, uneducated, empirical, entrepreneurs, sent their children, in UK mainly, to learn finance. Of course, they did not need that, because their experience was such to apply a rather simple method of win-win… till this day. Finance, however, was an uncharted18 territory for Greek ship-owners, requiring attention as most of the banks did not understand shipping at all, where fewer exist even till this day!
As mentioned by Stopford (2009) , the post 2nd WW ship-owners had to become more entrepreneurial in running their private businesses and more efficient. The Greeks and the Norwegians accomplished that to a certain high degree: the first in the bulk carriers and the second in the tankers19.
2) Shipping is an industry where reputation means safety
The first thoughts of the modern post 2nd WW ship-owners were: “why not to flag-out so that to survive?” Unfortunately, they did not pay the required attention to the fact that vessels need proper maintenance and as time passes-by their quality deteriorates and may become “old” and “corroded” and “structurally weak”…
Ship-owners did not understand at the beginning that shipping—while most of it if not all is private—its misfortunes are worldwide announced by the Press and other mass media (TV)! Governments, classification societies, international safety bodies and special legislations (SOLAS, Marpol, SCTW, ISM code), could not so far eliminate (= zero accidents) the marine accidents, especially those of crew deaths, unfortunately.
One has to underline, at last, that shipping is not a case of reactive policies-like those applied till 2000—and till hitherto—but of proactive ones! Of course, nowadays, shipping is preoccupied not with safety, but with the proper new fuel to prevent the further deterioration of the climate… Climate is nowadays placed before human life! The Energy crisis is also placed before peace.
a) Greed was more powerful than common sense
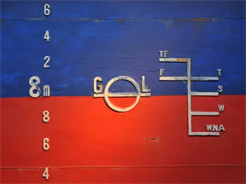
The “Plimsoll marks and the load lines” (Picture 1) due to Samuel Plimsoll (1824-1898), legislated by the UK merchant shipping act in 1876, and applied by Lloyd’s Register, is an early example of placing a break to human greediness.
The relevant parliamentary decision put an end to what was called “illegal loading”, which caused a number of cargo losses and marine accidents. It is remarkable as to what human greed can achieve, even where the British “common sense” prevailed! Greed is above common sense! Greed caused also the 2009-18 financial disaster.
Source: Author’s archives.
Picture 1. Lines for legal loading according to water density.
As shown, a ship can be “legally loaded” up to the above lines given water’s density. The tropical fresh water allows more loading, unlike the water in the winter in North Atlantic (WNA). Before that a lot of cargo and a number of seamen lost by high waves… We come now to our main theme.
Part III: Norway as a top shipping power (1900-2021)
Here is the question: “How Norway managed to become a leader, since 1900, in an international industry, where ship-owning is a highly competitive business, and where a number of technological as well institutional changes took place?”.
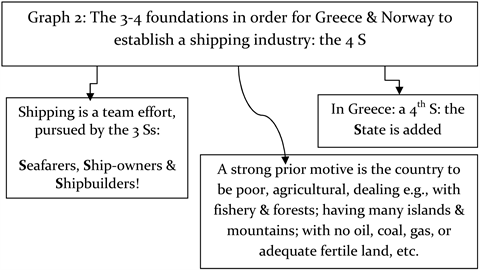
The Norwegian Tenold (2019) argued that his country’s seafarers, shipping companies and shipbuilders increased the standards of living of the Norwegian people (p. 2)! Thus for a country, like Norway, to become a “ship-owners’ nation” had to have 3 powerful factors (Graph 2), something argued widely also for Greece, where the State is added as a 4th factor.
As shown, a national shipping industry starts as a team effort20 made-up by those who: 1) know how to build ships, meaning the shipbuilders21; 2) know how to drive ships across the sea in carrying cargoes, meaning the Captains and the Sailors, meaning further a nautical tradition, and 3) know how to set-up and manage a shipping company, by experience, meaning to have, first of all and above all, ship-owners22!
Schools for the business administration of shipping at the beginning of shipping, and for many decades thereafter, were unavailable23. Onassis e.g. had no formal education on shipping business administration in 1922. The above team work is not
Source: Author.
Graph 2. The 3-4 foundations in order for Greece & Norway to establish a shipping industry: the 4 S.
as easy as it sounds. We believe that political people in governments, who destined to decide things for country’s Merchant Marine, and people in certain banks, etc., needed at least 2 years to understand international shipping!
Moreover, Norway24 used to be a country, the production of which based on wood, fish and shipping (1/3 to 1/2 of its revenue from exports was due to shipping). Such countries, like Norway, have, indeed, only 2 - 3 ways out: Commerce, Shipping (& Immigration)!
There are, however, and other important factors (Graph 3).
As shown, necessary was, and also helpful, for a nation to become one of having ship-owners, to possess one or more borders with the sea—something many times mentioned as Geography. In Greece, we put more emphasis not so much to have long coasts, which we have, and proper harbors, etc., but to have islands (Chios, Andros e.g. and others). This last feature is of exclusive importance, as we saw that even mountainous areas, like Mani, in Peloponnesus—in a big island—have created great ship-owners like the “Martinos Brothers” and others!
1) How to become international?
For a country to become, however, an international maritime power, the entire above mentioned factors are necessary conditions, but not sufficient ones, especially as Norway admitted, all along, and in all tones, to be a small country (like Greece)!
Adam Smith (1776) (1723-1790) stated25 (Chapter 3) that the division of labor—the engine of economic growth for him—implies the need to exchange (= to trade), but this is… limited by the extent of the market! This means that by
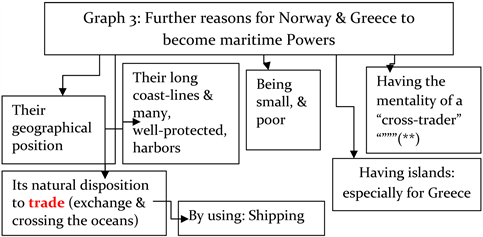
Source: Author; Tenold (2019) ; Norway used to carry the 10% of all world sea cargoes in 1900.
Graph 3. Further reasons for Norway & Greece to become maritime powers.
serving exclusively national trade, (i.e. the imports and exports of the country), a nation cannot become a great shipping power, as it is limited by its own size, and more so, if this is a small26 nation!
Maritime economists apropos used the term27: “cross trader”! This meant those ship-owning-nations, which served the sea trade of other nations. A “big shipping power” is international provided it is serving the world seaborne trade, where there the market naturally has its full extent! This is why the “cross-traders” want the whole market of all goods and raw materials to be open, and freely accessible28 by their ships! The Russian attack against Ukraine in Feb. 2022 modified this principle by increasing the sea distances…
Looking again, however, in Figure 2, we see that all 13 top shipping countries mentioned there, had, all right, sea coasts29, but certain of them are not at all small30! USA, UK, Japan, Germany and France were/are, indeed, large economies! What then?
2) Further reasons for the small Norway & Greece to become great nations by having ship-owners.
We ask: “If one has all the necessary conditions to be a ship-owner, but his/her capital (savings) is not sufficient, and bank finance does not exist, what has one to do?” The answer: “to buy 1 of the cheapest, 2nd hand, old, vessels, with his/her own and other people’s savings”! Both Greece and Norway used this strategy! In other words both countries emerged as 2nd hand owners of smaller and older ships… till the day they grew-up. Capable sailors navigated, and maintained, such ships to the benefit of their shipping companies31! Here the nautical tradition counted most!
Part IV: What does it mean to be a “tramp ship-owner” in shipping industry?
Norwegian ship-owners32, and the Greek ones, dealt indeed from the start with the tramp33 trades34, in which they could enter, avoiding the liner cartels which existed, and established, by the British since 1875 (Marx Jr., 1953) . These tramp trades served all cargoes left by the liners due to either their bulkiness or their low value. Norwegians—as written—would offer to “transport anything, anytime and anywhere” (Tenold, 2019: p. 5) . This happened also with the Greek ship-owners.
As shown (Figure 4), Greeks were 2nd in the world tramps, behind UK, in 1937-1938, one year before the start of the 2nd WW.
As shown, 11 powerful shipping nations dealt with tramp shipping in 1937-1938, where the global tramp shipping was ~10 m GRT, of which Greece owned ~1.6 m and ~16% and Norway 7%.
Dunn (1979) —an Englishman—attempted a brief historical account of tramp shipping on the occasion of the passage of about 100 years—since 1883—when Greeks dealt with the “tramps”! In 1964, the international tramp fleet was 36 m dwt where 30% owned by Greeks and ~12% by Norway (O’Loughlin, 1967) .
Can the preference of tramps by Greeks and Norwegians be justified (Graph 4)?
In both Norway and Greece the own capital was low, where also international banks were absent (till 1960s in Greece). In Greece e.g. it is well documented the so called system of συμπλοιοκτησία, meaning the common ownership of the
![]() Source: Data from the Greek ship-owners association, its 1946 report of the Board of directors.
Source: Data from the Greek ship-owners association, its 1946 report of the Board of directors.
Figure 4. The 11 countries-owners of tramp ships, 1937-1938.
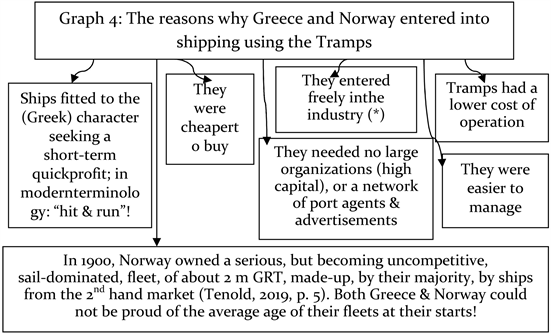
Source: Author. (*) They did not belong to the sea transport cartels called “conferences”. E.g. the so called “closed” ones allowed no entry.
Graph 4. The reasons why Greece and Norway entered into shipping using the tramps.
captain and the crew of the vessel, where her value was split in say 100 shares where one’s savings were deposited.
In addition, the tramp shipping had/has the disadvantage/advantage to depend on demand and supply, and thus its freight rates were more volatile, and the risk taken was much higher. So, Greeks and Norwegians were more risk-taking than their British colleagues, who had a mixed fleet.
Let us see this point with relation to the German shipping where data is available (Figure 5).
![]() Source: Data from ISL.
Source: Data from ISL.
Figure 5. Germany’s shipping revenue performance, 1970-2020 (selected years).
As shown, German shipping, during the last 50 years35, derived its revenue by 49% from its “liners”36, and by 51% from its “tramp” shipping, of about $207b37 in total! Τhe impact of the 1981-87 depression is shown. Also part of the exceptional boom in 2003-2007 is also shown (tramps earned then ~$8b per year on average) and part of the Global financial crisis of 2009-18 is shown too; and part of the COVID-19 pandemic, in 2019-2020, is also shown!
The years 2014-2022 were even better than the previous ones, with $13b average revenue p.a.! So, nations, like Greece and Norway, which owned tramps, out of necessity, could derive a better, but more risky, and more volatile, income, than the liner-nations38, with a possible exception: June 2021! The volatility factor, proved by the German figures above, resulted to higher revenue, provided owners knew how to manage it (Goulielmos, 2022) .
Part V: The national poverty has 2 - 3 ways out: commerce & shipping (& immigration).
If the Agriculture, cattle-raising, fishing, domestic trades etc., do not allow one to feed his family, then, external trade—plus immigration—are the unique serious alternatives. To be more accurate, the poor nations dealt par excellence first with commerce, originally within their boundaries, and then outside them, by applying the economic principle: “carry the products—left over after local consumption—where they might be needed”, adding transport utility!
This above endeavor, suggested also by Adam Smith, which depended on the transportation means and the road etc. infrastructure, but it was simple and needed no prior education! Having no, or small, capital, a merchant bought the merchandise from a factory in bulk, reduced it down in individual portions, doubled its price, and then tried to sell it to the individual consumers/buyers, bringing it outside their houses, using various transportation means.
Using the above way, merchants’ capital increased round after round. The first nation which taught commerce was Israel, we believe. Shipping emerged when the merchandise had to be sold abroad—crossing the sea. The first nation which taught sea transport was par excellence Greece, we reckon.
The above was an era when merchants were also ship-owners. The modern era was when ship-owners became only owners of the ships, and the merchants became only owners of the cargoes! Of course, cases for a dual role—meaning that of merchant-and that of ship-owner-at the same person—are still found nowadays among States and big charterers.
One additional point must be also mentioned that the exports of one country are always important, giving a nation, at least, the means to import other goods, like Norway and Greece (plus to obtain foreign exchange). Norway imported foodstuff, raw materials and manufactured goods. Greece exported agricultural products and imported oil, machinery and manufactured products.
According to the data provided by ISL, the % of the exports of Norway served by its own flag, in 2020, was ~13%. This confirms our argument that the very big ship-owners do not serve their own country’s trade exclusively!
Part VI: One task is to become a great shipping power internationally & another is to stay also there.
As mentioned in the methodology, we have to distinguish two cases: 1) how to become an important shipping country by creating ship-owners and 2) how to stay there for a long time or forever!
Let us first see what Norway has accomplished.
As shown (Figure 6), the 2 World Wars, as well the 1929-1935 economic depression left their bad impact on the Norwegian Merchant Marine.
Worth noting is, however, that the war-losses of the Norwegian fleet were less serious than those of the Greek-owned shipping, given also that Norway owned 2.5 times more tons (5 m GRT by 1940) than Greece (1.9 m).
Moreover, Norway accelerated its growth as a shipping power from 4m GT in 1944 to 19 m in 1968 (a ~5 times rise). In addition, its share in world fleet rose from ~6% to ~10%. This last indicator shows that the (international) competitiveness of the Norwegian fleet did not follow its expansion (1944-1968). As shown, the Norway’s shipping competitiveness fell after 1968, 8 years before the decline in its fleet, in 1976, and thereafter. The above means that the amount of tons owned by Norway depended also on other factors than having a competitive advantage! In 1957 Greece surpassed Norway in tonnage terms (10 m GRT
![]() Source: Modified from that in Tenold (2019) ; excluding the parallel registry of NIS.
Source: Modified from that in Tenold (2019) ; excluding the parallel registry of NIS.
Figure 6. Norway’s merchant marine, 1900-2000.
against 10.54 m).
Decisive was the behavior of the 2 fleets in the 1981-1987 depression, and during the 1975-1980 one, where Greece showed a greater resistance. This is the time, we believe, when Norway lost the game due to its persistence in… tankers!
The Norwegian fleet lost further its worldwide competitiveness, during the next 19 years, between 1968 and 1987, from 10% to 1.5%, though its fleet rose—till 1976—to 27.5 m GRT. As shown the serious decadence39 in Norwegian fleet, for 12 continuous years, occurred in 1976-1987!
The differentiation between the tanker fleets of Greece and Norway, we will attribute it to pure luck! Greeks were luckier than the Norwegians, during the 1975 and 1979 depression, because they owned fewer tankers than bulk carriers! Although we do not want to establish recipes in shipping, equality in ownership between tankers and bulk carriers seemed to be a wise decision after all. This means, for a nation, to own tankers as much as bulk carriers (in dwt terms).
Greece in 2008 owned 84 m dwt bulk carriers (52%) and 77 m dwt tankers. Norway owned 24 m dwt tankers (76%) and 7.5m bulk carriers. In 2021, in the Europe of 25, (controlling ~842 m dwt or 41% of the world total), Greece split the tonnage it controlled in 43% (dwt) in tankers and 49% in bulk carriers (out of a total of 410 m dwt), while Norway controlled 31% of the bulk carriers and 51% of the tankers (out of a total of ~78 m dwt)! Thus, Norway always persisted in owning a strong % of crude oil tankers. So, a crisis in tankers would, no doubt, destroy its fleet, as it did.
The above mentioned depressions in 1981-87, have also reduced the “dry cargo index of Stopford”, below its level in 1947 = 100 (Figure 7).
As shown, this period was bad for shipping—except for 1980 (number 5; = 200 units). To have a yardstick of comparison, in 2008, the index arrived at 670 units—an all times high.
1) The way Norway lost its competitiveness in shipping endeavors
The competitiveness—as we defined it—was as follows in 1978 among the 12 fleets, including Greece and Norway (Figure 8).
As shown, Greece and Norway took the 2nd and the 4th top positions! The world fleet owned 406m GRT then. In Table 1, we extended our investigation to 2021. As far as the age of fleet is concerned, Greece owned ships of over 20 years
![]() Source: Data from Stopford (2009) ; 1930 = 98; 1933 = 90 = 1934; 1935 = 93.
Source: Data from Stopford (2009) ; 1930 = 98; 1933 = 90 = 1934; 1935 = 93.
Figure 7. The 1976-1988 “Stopford’s maritime economics Freight Index”.
![]() Source: Data from “Naftika Chronica”, 1979.
Source: Data from “Naftika Chronica”, 1979.
Figure 8. The tonnage owned by 12 leading shipping powers and their share in world shipping, 1978.
![]()
Table 1. The % shares in global fleets, in 1978, 2008 & 2021 of Greece & Norway, as an indicator of their international competitiveness.
Source: Data for 1978 from “Naftika Chronica”; from ISL for 2008 & 2021.
of age in 1 out of 5 (GRT), while Norway was very near it with 19%. Thus it is true that both Merchant Marines of Greece and Norway based their initial expansion on older ships.
As shown, Greece almost doubled its global competitiveness from 8.4% in 1978 to 16.4% in 2008. Also, it reached 20% in 2021 (01/01). Norway reduced its competitiveness from 6.4% in 1978 to 4.2% in 2008 and 3.93% in 2021!
Figure 9 and Figure 10 next show that between 2002 and 2008, the tons in the national flag of Norway diminished, from about 28 m dwt to 13 m, while the foreign flags in NIS increased to 36 m dwt in 2002, and fell to 32 m in 2008. Moreover, between 2013 and 2021, the national flag stabilized round the 20 m dwt, while the parallel registry owned ~60 m dwt (a total of 80 m in 2021).
We come now to see what the Greek-owned shipping accomplished since 1856.
Part VII: The Greek-owned shipping (since 1856).
Greece, in 1862, owned only one steamer of 148 GRT. In 1898, Greece owned 1334 ships of 292,061 GRT. Of them, 64% used sails. These, by 1902, fell to 1222,
![]() Source: ISL, 2008 and 2021 yearbooks, modified.
Source: ISL, 2008 and 2021 yearbooks, modified.
Figure 9. The fleet controlled by Norway, 2002-2008.
![]() Source: ISL, 2008 and 2021 yearbooks, modified.
Source: ISL, 2008 and 2021 yearbooks, modified.
Figure 10. The fleet controlled by Norway, 2013-2021.
but they were higher in tons: 313,219 GRT. Of them, 52% used steam40. The transition of the Greek-owned shipping from sails to steam was not without repercussions—the Greeks being, in general, poor ship-owners—and without having bank finance!
Worth noting is that the steam technology raised the cost of a ship 13 times, as we have estimated elsewhere, vis-à-vis its comparable ship using sails, and required also a new kind of engineers! These engineers came only from UK. Unlike Norway, Greece spent 20 years to adopt steam technology!
The overall diagrammatic picture of the Greek-flagged shipping, between 1856 and 1945, was as follows (Figure 11).
As shown, the tonnage of the “Greek Steam Shipping” in 1918, and in 1945, after the end of the 2 global wars, was substantially reduced due to war losses.
![]() Sources: Author; data from Greek Ship-owners Union (1940-1944); Bank of Greece (various years); “Naftika Chronica” journal, 2000; Hellenic Chamber of Shipping, 1988; etc.
Sources: Author; data from Greek Ship-owners Union (1940-1944); Bank of Greece (various years); “Naftika Chronica” journal, 2000; Hellenic Chamber of Shipping, 1988; etc.
Figure 11. The Greek-flagged shipping, 1856-1945 (90 years).
The growth of the Greek shipping was impressive, however, between 1919 and 1939, given also the 1929-1933 Great depression.
At the end of the Great War, in 1918, Greece owned only about 14% of its 1915 fleet (Figure 12)!
The impact of the 1929-1933 global depression is apparent (numbers 13 - 16). The reader must also understand that shipping is like the mythical “Phoenix” bird! It dies during a global crisis, like that in 1929-1933, and after a Great world war, like that in 1914-18, and then… it comes-out alive of its ashes!
The Greek-flagged ships appeared in various ship registries, even before 1856, indeed since 1834, with 708 sailing ships; in 1851, they were registered 237,000 GRT (1437 ships); 714 sailing ships bought from those laid-up in Danube etc. at the end of the Great War! Greeks bought most of them!
Comparing Figure 6 (for Norway) with Figure 11 (for Greece), we see that Norway in 1918, in 1929-1933, as well by 1944, lost part of its 5 m GRT fleet (in 1940). In 1944 the Norwegian fleet was about 3m GRT. Greece, however, had greater war-losses!
1) Period: 1949-1988
The picture from 1949 to 1988 is as follows (Figure 13).
As shown, the Greek-owned fleet expanded fast from 1949 to 1977. The depressions: in 1975; 1979; and 1981-1987 influenced—as shown—also the Greek-owned shipping.
2) Period: 1989-2022
The picture between 1988 and 2022 is as follows (Figure 14).
As shown, the above 35-yearly period produced: 1) an exceptional boom, lasting 6 years (2003-2008); 2) 3 stagnation periods (1988-1991), (2009-13) (2019-2020); 3) one long depression (2009-18; & one Global financial crisis 2009-18) and 4) one Pandemic (2019-2022) and 5) a major war 2022! We may
![]() Source: “Naftika Chronica”, maritime journal, 1931.
Source: “Naftika Chronica”, maritime journal, 1931.
Figure 12. The Greek-owned fleet in 1862; 1915; 1918-1931.
![]() Source: Data from “Naftika Chronica” for 1949-1984, end of the year; for 1988, the ships are over 1000 GT each; data from GSCC.
Source: Data from “Naftika Chronica” for 1949-1984, end of the year; for 1988, the ships are over 1000 GT each; data from GSCC.
Figure 13. The Greek-owned fleet, 1949-1988.
admit here that those shipping companies, which survived since 1988, over such serious events, no doubt, will survive till 2050.
As shown, a depression harms seriously shipping, like that in 2009-2018, while an exceptional boom, like that of 2003-2008, boosts the fleets, and given the slow reaction of the shipyards, the fleets increase for a number of years after the boom stopped… echoed into the future. The above 5 events, however, shaped the fleets of Greece and Norway differently… where Greece attempted great leaps forward several times (from 1992 to 2008) unlike Norway.
We come now to examine an important question: “if placing the majority of a
![]() Source: data from GSCC; ships > 1000 GT; 01/03/2022.
Source: data from GSCC; ships > 1000 GT; 01/03/2022.
Figure 14. The Greek-owned shipping between 1988 and 2022, forecast for 2023-2025.
Table 2 presents explicitly the performance of the Greek-owned Fleet to 2025 based on Figure 14.
![]()
Table 2. The Greek-owned fleet, 1988-2022; forecast 2023-2025.
Source: Data from GSCC 2022.
country’s fleet—from the 14 top maritime nations in 2021—under flags of convenience, could it gain one of the top global positions?”.
Part VIII: Can a shipping industry be more competitive by flying the flags of convenience?
We attempted here a graphical correlation between one nation’s degree of participation in the foreign flags and its % share in the word fleet (Figure 15). For the numbers to be comparable, we multiplied the global shares in the world fleet by 10.
As shown, one can “suspect” a positive correlation between the % of tons under foreign flags and the global % of tonnage… Three countries, however, Greece, Japan and China showed a different pattern than the rest! This means
![]() Source: Data from ISL.
Source: Data from ISL.
Figure 15. The correlation between the participation in the world fleet and the % under foreign flags (14 global fleets, 2021).
that also other factors influence the above stated relationship (examined next)! Let us remove the 3 “exceptional” countries from the picture to see if the correlation will improve (Figure 16).
As shown, the graphical correlation improved! Let us examine further our above result by running a regression between the % participation in the world fleet and the % use of the flags of convenience. In the first case, with the 14 countries, the coefficient of correlation found very low, at ~0.13, and in the 2nd case of the 11 countries the correlation coefficient rose to ~0.46! This 2nd one is still a low coefficient of correlation (≤1), indicating that also other factors—beyond the use of flags of convenience—play a role so that the 11 shipping countries to acquire a high % in the global fleet!
Part IX: The factors that contribute to obtain a high share of the world fleet beyond flying flags of convenience.
Greece, since 1988, was adding ~7.7 m dwt to its fleet from year to year, (except for 5 bad years), on average, for 35 years (Figure 17). We will assume that to grow by an average rise is not something important. Greece, however, surpassed its average yearly growth in 10 times (29%), out of 35 (Figure 17).
As shown, the additions to the Greek-owned fleet, par excellence between 2000 and 2008, accounted for 110 m dwt, and another 94 m dwt by 2022 (>4 times in 35 years). From the above analysis one can see that to be a protagonist in shipping industry, the quantity of the net additions to the fleet is the important key variable. The additions are made-up by the new-buildings acquired, the 2nd hand ships bought, minus the sales of ships, and those lost and scrapped. In 2022, the activity of the Greek ship-owners is shown in Table 3.
As shown, the Greek top ship-owners spent $6.2b in only 3 types of ships in 2022. In these, only 2 Norwegian companies appeared, i.e. the “Knutsen OAS shipping”, which spent $3.1b to order 14 LNGs and the “Golden ocean group”, owning $2.2b of bulk carriers. The strong preference of the Greeks was for the LNGs (66.5%), then for the tankers (18.5%) and finally for the bulk carriers (15%), as expected due to the energy crisis caused by Russia.
![]() Source: As in Figure 15.
Source: As in Figure 15.
Figure 16. The correlation between the participation in the world fleet and the % under foreign flags of 11 only fleets, 2021.
![]() Source: Author; data from GSCC.
Source: Author; data from GSCC.
Figure 17. The tonnage added to Greek-owned fleet from 1988-89 to 2021-22 p.a.
![]()
Table 3. Additions to the fleet of the Greek ship-owners in 2022, in $m, found in the 10 top companies worldwide.
In the shipping markets, 2 further new trends developed: 1) a sharp rise in the purchases of ships from the 2nd hand market. This is due to the as yet unknown
![]() Source: Data from “Naftica Chronica”.
Source: Data from “Naftica Chronica”.
Figure 18. The sale and purchase strategy of the Greek ship-owners, 1985-1993.
new fuel, which will be used in future (Goulielmos, 2021a) . This uncertainty halted the orders for new-building tankers and most companies resorted to the 2nd hand tanker market, spending $5.6 m there (almost 3 times higher than the money spent for new buildings, by the 10 top global shipping companies in 2022)!
2) The emergence of certain institutions—financial houses mainly in China—dealing with the leasing41 of ships, which they buy 2nd hand, and build as well, and then appoint ship management companies for their chartering and operation… Unless this strategy has the proper timing (Goulielmos, 2021b) , it may become dangerous, when the prices of the ships will fall, the banks will indicate losses, and a lost liquidity, unless they get rid of the tonnage in time!
In the orthodox banking activity, when the value of ships falls, the ship-owner has the obligation to restore the situation. Surely, there is a lot of money from playing with the assets, but for those who know the game… Greeks surely know the game (Figure 18).
The Greek shipping strategy is/was to buy 2200 ships totaling 57.2 m GRT, between 1985 and 1993, sized 26,000 on average, and to sell 1647 ships of 28.85 m GRT, sized 17,517 on average. Such a strategy gains on economies of scale by selling smaller ships and buying larger ones by 48%. This improves also the tonnage owned. Also, but not shown here, is/was the Greek strategy of selling older ships and buying younger ones and moreover, and more importantly, buying them at rock-bottom prices, and thereafter selling the others at higher market prices… A win-win project!
5. Conclusion
For a country to develop itself as a ship-owners nation, a combination of the 13 mentioned factors is required… For the shipping managers, however, things are simpler, as they have to know only 2 important facts about their industry: 1) Ship-owners are unable to foresee a shipping recession, depression or a coming war. 2) The one having the lower cost is the King!
Not only the shipping companies, but also the shipping nations, must believe the above 2 principles, and to get out of similar situations with the least possible wounds! One conclusion is to have balanced ownership between tankers and bulk carriers (in dwt) and why not also in LNGs? Who knows from what shipping sector the next depression will begin?
Greece and Norway possessed common properties as shown, which led them to establish a merchant marine, and by using specific strategies, to succeed in being protagonists holding one of the first global positions among 13 top maritime nations!
One was more important! This was the “decision” to deal with “tramp” ships and be “cross-traders”, avoiding this way, the British cartel in liner shipping since 1875, and the smallness of their national trade! Apart from the fact that the tramp shipping fitted to the character of those ship-owners as shown is more profitable (tankers and bulk carriers) including containerships except June 2021.
Moreover, the administration of tramp ships—there was only 1 vessel, old and 2nd hand—is personal. Poor countries like Greece and Norway, with a lack of finance, rested on tramps, and on their efficient sailors. Thus, tramps allowed establishing a one-ship, simple, company, without any other bosses! Another side of the character of Greeks and Norwegian Vikings…
Given that the above pattern attempted usually by ex-Captains, an ex-Chief Engineer and a secretary, was all it was required to own and manage a single ship, i.e. to be a ship-owner. An easy entry into the industry an economist could say…
The liner trades were different: 1) The ships had to have a higher speed; 2) they had to have their own gears, as the ports were primitive; 3) their holds had to be suitable to carry many individual cargoes, and LIFO; 4) they had to have cabins to carry passengers; 5) they had to advertise their itineraries and establish agents in all ports served. In a few words, liner companies are there to stay for years and not only for the lifetime of their owner… requiring a heavy expensive infrastructure.
Good extensive organizing is characteristic of liners as well as the need for adequate funds, requiring a number of 2 ships at least, or rather 4, to care for the times when one ship has to be maintained. British excelled in liners by having great companies like the P&O42 (in the making since 1822; 1837) and Cunard Line (since 1840). Germans, thereafter, excelled in containerships in line with the Japanese, something not at all random.
NOTES
1Corinth was the leading town of Greece due to its favorable port location.
2Athens became prominent when silver discovered at “Lavrion” Mines (c. 550BC), near Athens. Also, by its vicinity to Piraeus port. Copper used as a currency at least 2000 years ago till supplemented by silver. Copper coins used in Rome during the 4th c. BC and silver ones in 3rd c. BC. Jesus Christ mentioned the copper coins, in 30 AD, used in Jerusalem along with silver ones.
3The worldscale index varied from 313.3 WS in Sept. 1973 to 41.4 in Dec. 1974.
4Since 15 - 20 or so years ago one could not find any lady in ship-owning… By 2023, we can easily identify at least 8: Mrs. M. Travlos, in charge of the “Neptune Lines” & “Neptune Dry”, from a ship-owners’ family with a long tradition; Mrs. S. Palios, managing director of “Diana” Shipping. Mrs J. Prokopiou, belonging to “Dynacom Tankers & Management” and “Dynagas Ltd.”. Mrs M. Francistas, in charge of the “Franco Compania Naviera”. Mrs. E. Petrakis, operations/Chartering & Business development manager of “Enea” management Inc. Mrs M. Angelicoussis, in charge of a sipping group of 7 companies, since 2021, when her father John passed away. Mrs. Anna Angelicoussis, in charge of 3 shipping companies (“Pantheon”, “Alpha Gas” and “Alpha bulkers”, daughter of Antonis). Mrs. A. Frangou, in charge of the “Navios Group”, who sold-out her entire fleet to deal with logistics!
5One day we will write about this.
6Flag costs are the national ones including crew wages etc. Insurance costs are international, although may differ from one global market to the other. Important international cost is the fuel oil, lubricants, repairs, dry-docking, spare parts, class costs etc. The crew performance is national and this is very important, concerning also the nautical education. When we say that a cost is international we mean that it is the same for all global fleets no matter their flags.
7The Isle of Man. Research has shown that the institution of the flags of convenience emerged as a suggestion from the USA law firms.
8Greek ship-owners used once up to 37 different flags!
9This is why Greek ship-owners are never satisfied by the state-education provided to Hellenic crews, and every year shout-out for improvements… for the last 100 years. This effort had to be global, we believe, as the foreign nationalities on board every ship are increasing for some time now… Many heavy populated countries, facing poverty, “exported” their labor force to serve on board foreign ships like par excellence Philippines, India, and Eastern Europe.
10The ISL mentioned 157 countries in 2007-2008 having a merchant fleet of ships of 300 GT & over! Only 13 flag-nations, however, had 1%, or more, of the total global merchant fleet in 2008: Panama: ~23%; Liberia: ~11%; Greece: ~6%; Singapore: ~5%; Malta: 4%; China: 3.4%; Cyprus: 2.8%; UK: 2.5%; Norway: 2.1%; S Korea: 1.9%; Germany: 1.4%; Japan: 1.3%; & Italy: 1.2% (= ~66%).
11In USA, where the agreement took place (1944), concerning the international monetary arrangements after the end of the 2nd WW &to establish the IMF, the World Bank & the pegged exchange rates (till 1971). Important for shipping were the floating exchange rates in 1971 given that shipping companies use dollars in almost all their payments.
12This term used to distinguish the private tanker ship-owners from the oil companies, which were also ship-owners… up to a certain time, owning of about 35% of the global tankers.
13One principle of management is to identify one’s customers, in a continuous fashion as things change.
14The original ship-owners were both ship-owners and cargo-owners, including Onassis when he first started soon after 1922. Latter the ship-owners became only… owners and the cargo owners… became only charterers. This was a fundamental change. This change had positive and negative impacts also on the organization of shipping companies. This issue is proposed for further research.
15Another secret was in the nature of cargoes. Bulk cargoes were bulky and of low value per dwt. The crude oil from the oil-wells contains 50% soil. So, the economies of scale and the low cost per dwt were decisive elements for charterers to charter ships.
16Oil companies kept a fleet of tankers so that to serve their most valuable customers and their urgent needs. When “oil traders” appeared and the transportation department required larger amounts, oil companies withdrew from this endeavor.
17Worth-mentioning example is the negotiations between Onassis and one of the oil companies for tankers, the freight rates of which a few days after the agreement, rose substantially…
18Older Greek ship-owners worked with 100% own funds & had difficulties to understand finance terms like e.g. “moratorium” (1970s). Also certain unpleasant relations between Greek ship-owners & banks occurred. Onassis was proud to say that he restored the confidence of the banks to the Greeks ship-owners, & moreover he proved that a rapid growth of a shipping company, with own funds alone, is not possible. Modern ship-owners like Mrs. Frangou, understood how to manage the cost of finance given the substantial amounts involved in modern shipping & the high interest rates prevailing!
19There is a legend that Greeks learned the business of carrying crude oil from Norwegians in partnership..
20Surely, the Greek State committed mistakes vis-à-vis its shipping, but this was out of ignorance, not out of intention. Greek ship-owners always were seen by the Greek State as… the “chickens producing the golden eggs!” Similarly, Norwegian state committed also serious mistakes with reference e.g. to tankers and the prohibition to be bought by the Norwegians in order for the State to save foreign exchange! In certain countries like Greece, shipping started as a team effort paid-by only the ship-owners and the seafarers, where both shipbuilders and the State were absent!
21This precondition can be overcome by ordering ships abroad.
22At the beginning, ship-owners were also Captains (staying in owner’s cabin).
23Ship-owners were obliged to ask from their sons to sign-on, for a couple of years, on board one of company’s vessels… before working with the company. The “management of shipping companies” e.g. introduced in the University of Piraeus as late as in 1992 for the first time. This was not something to surprise because management started to be dealt scientifically since 1911… in USA by Taylor. In Europe/Greece management appeared in 1916 by Fayol. Thus to establish a shipping company & know how to run it, this was obtained by experience-empirically.
24Of great importance, but having nothing to do with shipping per se, was the fact that Norway was one of the 2 countries in Europe to discover oil (in the North Sea) in 1970-1980. We hope the 3rd one to be Greece and Cyprus in 2025… This development was the decisive one to transform Norway from a poor to a very rich country. This was more so as shipping provides riches to its owners, while oil and gas provide riches to the State (and its pensions)!
25This chapter is interesting as it also deals with shipping.
26If the size of one country is measured by its population, the situation was as follows in 1931: USA 121m; Germany 64; Japan 62; England (plus Ireland) 49; Italy 41; France 41; Spain 23; Holland 8; Greece ~6; Sweden 6; Norway ~3; Denmark 2.5.
27This explains why Norway & Greece are strong defenders of their role to carry the world cargoes, as being those who do that more efficiently-away from practices of cargo reservation, protecting a flag, flag preferences, shipbuilding subsidies, nationalistic policies, preferential finance terms and cargo sharing etc., including the 20-40-40 rule of UNCTAD.
28The obstacles are many: the tariffs, the quotas, the sanctions, the high prices, the low incomes, the wars…
29Surely, we do not see there either the Luxemburg or Switzerland, which have no coasts, though this criterion has no meaning nowadays. Luxemburg registered under its flag 38 ships in July 2021 and Switzerland 19!
30To be honest, a small country means that national sea labor is destined to be inadequate one day… for a country to be an international shipping nation. It needs foreign labor on board… sooner or later. This compelled Greek-owned shipping to maintain—if at all—the officers/Captains of Greek nationality. This, however, meant to kill 2 birds with 1 stone as foreign labor was/is cheaper than the national one!
31The competitive fleets like the Greek one managed to carry-out ship maintenance during the voyage! Greek sailors managed to navigate ships regardless their age and the state of their technical condition!
32The British dealt with both shipping endeavors: tramps and liners. In fact, they committed the mistake to have a great dependence on liners. When they lost the colonies, they lost the trade, and when they lost the trade, they lost their shipping!
33Maritime economists distinguish shipping into “tramp” and “liner”. The liner shipping is described by Tenold (2019) as the “bus services” of the sea! We call itbetter as the “cargo taxi of the oceans”… which is found along the sea routes and outside the relevant stations (= the ports) waiting for a cargo to be carried. The liner ships belong to a shipping company whereby the cargo-carrying ones operate between scheduled, advertised ports of loading and discharging on a regular basis (ISL, 2008: p. 419).
34“Tramp” is an English term indicating a questionable reputation, meaning the ships which visit ports at the will of their charterers. These ships travel round the world ports searching for cargo, like a tramp man, who has not a unique home, or a specific destination& wanders-round from port tavern to port tavern and from one wife to another…
35The years are not continuous.
36Ships following regular connections carrying, by majority, manufactured and handcrafted goods in boxes/containers.
371$ = 1 Euro. Liners gained 102 m Euro and tramps 105 m Euro.
38Liners had to charge slow-increasing freight rates (based also on the price of oil) and also as much, but not so much as to make the good transported too dear at destination given its elasticity of demand. The Pandemic also curtailed the business of containerships for a couple of years, and when the Pandemic controlled, the unsatisfied demand emerged, cumulatively, creating a 2nd boom in 2021. The volatility of the liner shipping freight rates was always lower. The liner trade indices between 2003 and 2008 varied from 95.4 in Jan. and 92.9 in August, passing from a high 113.5 in Nov. 2005 (1995 = 100). But in June 2021 the index exploded to 221 units (2015 = 100)!
39Moreover, the tanker depression occurred at least 2 years before the dry cargo one, and thus allowed Greeks to be prepared, as far as they could, for the coming depression in dry cargoes.
40Data comes from a conference held in Syra in 1902). In 1900, we counted that the 64% of the GRT of the fleet of the 25 leading countries, used steam, i.e. out of ~22 m GRT. The countries that had a better % than the world one were: Belgium 100%; Austria 93%; Hungary 86%; Spain 83%; Holland; UK 79%; Romania 73%; Germany 71%; Japan & Denmark 69%. Greece had 48% and Norway 35%. Surprising was the % of USA having only 40%. Data from Tenold (2019: p. 23) .
41We identified: CDB Leasing; Bo Comm Leasing; ICBC Financial Leasing; CMB Financial Leasing; CITIC Financial Leasing and Everbright Financial Leasing. These held about $42b of assets (plus those on order)!
42“P&O” earned 2.4b
in 2004, employing 22,038 persons, and sold to “DP World” in 2006.