An Empirical Study of Bilateral Trade in Egypt: Gravity Model Approach (2000-2018) ()
1. Introduction
International trade in goods and services is one of the most important foreign currency sources to resolve the “foreign exchange gap” to reduce foreign aid dependency. Trade means the exchanging of goods and services between countries. No doubt, international trade is high means of surviving in this world of diversity and endowment for emerging economies. Trade is considered to be the engine for developing the domestic economy, which can reduce the unemployment ratio through generating more job opportunities which can decline the poverty ratio (Shihab, Soufan, & Abdul-Khaliq, 2014), can also relieve the burden on the balance of payments, expand the foreign trade market, facilitate delivering goods, raise the competition between countries that can enhance the quality of goods with affordable price, and also can raise the income for both individuals and government as well (Ijeoma, 2013). Trade plays a crucial role in growing the manufacturing sector more than the mineral and agriculture sectors. Exports will boost the national industry to trade globally, help the countries get involved in the global economy, and decrease external shocks’ influence in the national economy. The Asian and Latin American economies’ experience provides good examples of the foreign trade sector’s importance to countries’ economic growth and development. That has led economists to emphasize that exports play a crucial role as a driver of economic expansion.
Egypt is one of the emerging economies in Africa and the Middle East region. Egypt’s international trade market makes up a substantial part of its economy. Egypt’s total exports have increased from US$4693 million in 2000 to US$29,383 million in 2018, and exports in the gross domestic product (GDP) also increased from 22.82 to 29.37 percent, during the same period of time, thus indicating the modest importance of the export sector in the Egyptian economy. Egyptian exports are not widely diversified but dominated by few products, such as chemicals, oil, agricultural and mineral products, which lead to a higher concentration of export products and, in turn, to highly concentrated export destinations. The market trade openness ratio improved to be 48.28 percent in 2018 from 39 percent in 2000 (Youssef & Zaki, 2019). Although the Egyptian economy’s trade sector has a great importance, it has suffered from a deficit in the trade balance in recent years (Elshehawy, Shen, & Ahmed, 2014). The data for exports in 2018 is 29,383,961 million $ and the data for imports is 80,992,321 million $ count a trade deficit about 51,608,360 in million $. As of 2018, Egypt’s foreign trade sector share about 18.91% of the GDP. This comparatively small contribution can lead to low-income jobs or Imposes additional revenue from taxation to tackle the country’s fiscal deficit. Egypt is still in the initial stages of the trade boom, indicating that if a minimum degree of political stability is restored, Egypt’s economy will begin to recover over the next few years. The researchers recommend to improve the medium and small enterprises, and also focus on the competitive advantage of local products because of this importance to the foreign trade sector's role in the Egyptian economy. It is important to identify the economic factors affecting Egypt’s foreign trade sector to help the government and policymakers take effective strategies to address the foreign trade sector’s output. The Gravity model and the panel data determine the economic variables that describe the country’s bilateral trade.
2. About the Gravity Model
The gravity model extracted from the Newtonian gravity law containing the positive influence of the two countries’ gross domestic product and the Distance will have a negative sign (Anderson, 2011). The model used to examine the scale of bilateral trade flows, 1) the supply from the exporter country, 2) the demand from the importer country, and 3) the cost of transportation and information. This model is focused on “natural” factors to explain international trade flows (Srivastava & Green, 1986), although other economic factors constant. While other literature review papers were using the gravity model to examine Egypt’s trade ties and trade policies, in this study, the researchers figure out the most influential factors affecting Egypt’s total foreign trade, among the period from 2000-2018.
The following theories are based on the framework of the literature:
Hypothesis 1: The impact of economic size on bilateral trade is positive.
Hypothesis 2: The Geographical distance effect on bilateral trade is negative.
The remaining paper is arranged as follows
Section 2 Includes a description of Egyptian bilateral trade to importer countries.
Section 3 The gravity model techniques.
Section 4 Discuss the findings of the empirical review, and at the end, there is a briefing for conclusion and limitations of the research.
3. At a Glance, Egyptian Exports
For Egypt, the latest foreign trade data:
In 2018, according to Economic Complexity Ranking, Egypt was number 43 in the world economy in terms of GDP (current prices US$), number 62 in total exports, number 42 in total imports, and number 71 in the most dynamic economy (ECI). Egypt exported $29.3M in 2018 and imported $80.9M, resulting in a negative trade balance of −$51.6M. Egypt’s exports per capita were $358 in 2018, and its per capita imports were $853. Trade: Crude petroleum ($4.93M), refined petroleum ($1.99M), gold ($1.86M), nitrogenous fertilizers ($1.39M) and petroleum gas ($1.17M) are Egypt’s its exports.
Destinations: Egypt mainly exports to Italy ($2.67M), the United States ($1.72M), Turkey ($2.41M), the United Arab Emirates ($1.98M), and Saudi Arabia ($1.43M), imports mainly from China ($12.3M), Russia ($7.75M), Germany ($3.83M), the United States ($4.93M) and Saudi Arabia ($3.53M).
Since one of the emerging economies in -the Middle East and Africa is Egypt, total Egyptian exports need to be investigated. Egypt’s exports increased significantly from 2000-2018 and added significantly to the Egyptian trade balance account. Total exports in 1980 were about US$3 million, with a trade value of US$29,383 million in 2018. Since then, Egypt’s foreign trade has risen to US$31,582 million in 2011. Due to the country’s political instability, Egypt had a revolution, and its trade was affected by a downgrade in 2011. In 2018, total exports reached US$29,383 (this can be seen in Table 1), among a few main international trading partners. Egypt’s exports have been focused on in terms of direction (Table 1). EU-27 has remained the first top destination for exports from Egypt, while its sharing increased from 1919$ in the year 2000 to 9186$ in the year of 2018. According to Table 1, in 2018, Egypt’s largest trading partners are (EU27, Turkey, UAE, USA, KSA, UK, Jordan, Libya, and India) as follows.
From Figure 1 the Egyptian total exports flows to the whole world.
![]()
Table 1. Exports from Egypt to the major trading partner, 2000-2018 ($ million).
Source: World Integrated Trade Solution.
![]()
Figure 1. Egypt’s total exports (in millions$). Source: World Integrated Trade Solution.
4. Literature Review about Using the Gravity Model
The gravity model has become increasingly prevalent in recent years and applied for many economics and finance fields to describe the relations between markets for commodities or economies as a whole. There are the same basic findings in this model’s different implementations: distances and boundaries are important determinants to describe the trade flow. For example, the researchers used the gravity model to determine Chinese agricultural foreign trade with its major partners (Muganyi & Chen, 2016). The researcher used the gravity model to examine the Trade Potential of Senegal and Morocco (Niang, 2016). The researcher used the generalized gravity model to investigate the motivator and obstructive variables affecting the trade in four forms of vegetable oil, indicated the significance of importer GDP and exporter GDP, and Distance. However, it gets fewer favorable benefits from language similarities, both colonial history, and language similarity (Wang, 2016). The researchers used the gravity model to examine the trade flows between Cameroon and twenty-eight countries of the European Union. The findings revealed that Cameroon’s foreign trade with the EU countries is positively influenced by economic size and per capita GDP and negatively affected by the distance between the trading partners (Doumbe & Belinga, 2015). The researchers the gravity model to analyze the influence of RTA on African agriculture exports. The study showed that African RTAs have a mixed effect on the growth and diversion of trade (Tegebu & Seid, 2019). The researcher used the gravity method to examine influencing determinates for Bangladesh’s international exports (Rahman, 2010). The researchers used the gravity model to estimate the trade flows between African Sub-Saharan and China (Adekunle & Gitau, 2013). The researcher used the gravity model to estimate the GDP and POP of The partners in foreign markets, culture, and Distance have a significant effect on Vietnam's foreign trade flows with 60 countries (Binh, Duong, & Cuong, 2011). The research has been shown that the exporter and importer the gross domestic product, regional trade agreement, importer’s population, and common border are significant to Egypt’s exports. In contrast, the trade openness, common language are not significant to Egypt’s exports (Elshehawy et al., 2014). For the population factor that can influence or not in the bilateral trade for a country, the results showed That the three estimates, however, are theoretically consistent but statistically insignificant for population factor (Brodzicki, Śledziewska, Ciolek, & Uminski, 2015) the results showed that the three estimates, however, are theoretically consistent but statistically insignificant for population factor. This study showed the negative coefficient for the population of the importer and exporter in his empirical research (Kien, 2009). The Researchers used the gravity model to investigate the significant variables affecting the Egyptian agricultural products to the main trading partners. The study showed that Egyptian agricultural exports significantly increase to countries where the official language is Arabic, which means the same official language, and sharing the same border facilitates exports. The RTA is not a significant factor in Egyptian foreign exports. Similar comparative advantages, consumption issues, overlapping membership, policy harmonization, and weak private sector participation can restrict regional economic agreements’ insignificance (Hatab, Romstad, & Huo, 2010). The gravity model has been used over the past 70 years in foreign trade (Van Bergeijk & Brakman, 2010). Today, the gravity model can consider a standard procedure when studying a country’s trade flow directions (Blomqvist, 2004
The foundation of the Gravity model:
The gravity model extracted from the Newtonian gravity law containing the positive influence of the two countries’ gross domestic product and the Distance will have a negative sign (Anderson, 2011). The model used to examine the scale of bilateral trade flows, 1) the supply from the exporter country, 2) the demand from the importer country, and 3) the cost of transportation and information. According to Newton’s universal law of Gravitation, and inversely related to the Distance square (Vayenas, Fokas, & Grigoriou, 2015). The model of gravity is represented as follows:
where:
fij Gravitation between the two countries.
Mi, Mjthe masses between two countries.
Dij the Distance between countries.
G gravitational constant.
Tinbergen is the first economist to use the gravity method in 1962 to examine foreign trade flows. The trade flows between two countries are a dependent factor. Gross domestic product and geographic Distance are independent factors. The estimated GDP and DIS factors significantly influence trade flows between them and opposed to Distance, indicating that countries with large economic size and close distances can trade more between each other. The gravity model relates foreign trade to the economical mass of two countries’ economic sizes, the distance between them, and other possible factors such as dummy variables, and other possible factors such as dummy variables. The general form of the gravity equation is as follows (Anderson, 1979):
(1)
xij show the country’s export flow i and j, ak are constant, β, γ, ε, μ are coefficients, weighted geometric averages, Yi and Yj are country’s gross domestic product (GDP), in country i and j, respectively, Ni and Nj are population in countries i and j, and Dij is the Distance from the countries’ capitals. The Uij is a standard distributed error log term with E(lnUij) = 0. The gravity model with dummy variables is often widely used to take preferential exchange factors between i and j.
It is possible to write the linear form of the previous gravity equation as follows:
(2)
4.1. The Gravity Model Analyzing the Egyptian Bilateral Trade
As independent variables, distance and the gross domestic product are the main factors of the gravity method. Many models contain population and several dummy factors. In this research, the gravity method is considered relevant to examine the trade flows. Its effectiveness has proven to be one of the most influential models to describe trade flows between the two countries. The researchers examine and evaluate factors affecting Egypt’s exports by adjusting and add more dummy variables to Equation (2). The value of Egyptian trade flow i to the importer country j can be written as follows:
(3)
All variables have been written in natural logarithms (excluding dummy variables). xij is the dependent factor that reflects the Egyptian trade flows I into the trading partner j. GDP, pop, Distance, and trade openness are independent variables. Dummy variables, such as common RTA, common LANG, and the common border, have been written in Table 2. Table 3 describes the descriptive estimation results. The independent variables included in Equation (3) each have a given effect on the level of trade flows between Egypt and its trading partners. The high level of income demonstrates a high production level in the exporting country and can increase the export’s products. The predicted sign of β1 would be positive. By the same principle, the anticipated sign of the β2 coefficient is also assumed to be positive.
![]()
Table 2. The description of gravity model variables.
![]()
Table 3. Descriptive statistics (numbers by thousand $).
The level of the importing country’s income contributes to import more Egyptian products. The importer β3 population coefficient estimation has a positive sign, depending on whether there is a greater opportunity for trade in a wide range of products or not. For the trade openness, the more open the country is, the more trade would be. The predicted β4 sign will be positive. The β5 sign is predicted to be negative, where a long distance between trading partners means high shipping cost and low-profit margins for the importer. Besides, for countries being members of the same trade agreements, sharing similar borders and the official Arabic language, they can trade more. Dummies were included as follows β6, β7 and β8 are supposed to have a positive sign (the summary of expected signs in Table 2).
4.2. Data and Sample Size
This study contains 36 of Egypt’s importing countries. These markets are selected based on the importance of the trade relationship and the availability of data. Ten markets from the European countries (Malta, Italy, Spain, France, Cyprus, Belgium, Germany, Italy, Netherlands, Portugal, and the United Kingdom), Ten from Arab markets (Saudi Arabia, Kuwait, Qatar, Oman, The United Arab of Emirates, Algeria, Jordan, Lebanon, Morocco, and Tunisia) non-Arabian markets in Asia are Eight (China, India, Malaysia Japan, the Republic of Korea, Indonesia, Singapore, and Pakistan). Eight other vital markets (Canada, Brazil, Switzerland, South Africa, Nigeria, Russian Federation, the USA, and Turkey) the importing markets absorb about 70% of total Egyptian trade. This study has one dependent variable and eight independent variables (the total number of observations = 684, N = 36, and T = 19, and all variables are in natural logarithm). The researcher decided secondary data from international sources to ensure that the data is accurate and reduce conflicting of the data from national sources. Besides, to confirm previous studies’ findings, the researcher collected data from six sources such as CAPMASS, The World Integrated Trade Solution obtains data on Egyptian total foreign trade to its trading countries (WITS). GDP and population data were collected From the United Nations Database of National Accounts and World Bank World Development (WDI). City Distance Calculator the data on the Distance (in miles) between Cairo (the capital of Egypt) and the importer's capital city.
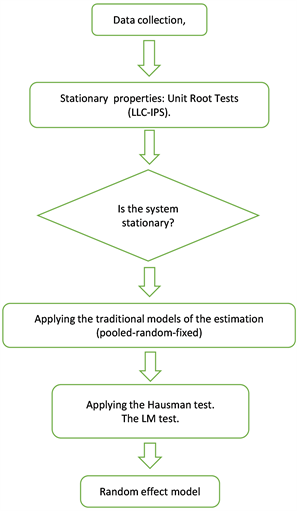
4.3. Methodology and Statistics
Several empirical types of research have been used classical gravity model through (cross-section data) to analyze the foreign trade relationship over specific a period of time, for example, the researchers analyzed trade policy orientations in a gravity method to measure bilateral trade flows through 82 markets year effects from 1960 and 1992 (Hiscox & Kastner, 2002). Nowadays, panel data were commonly used by many scholars. In this article, the panel data technique was used to determine the Egyptian bilateral Tarde variables. The panel data approach’s benefits can show the relationship over time between variables, track individual effects of trading partners, and prevent skewed estimates. The panel data and individual impacts used in the regressions were used to approximate the gravity model equation in this study. Three main models in panel data can be used to estimate: pooled model, random-effects model (REM), and fixed effects model (FEM). The researchers need to consider the properties of the data, as well as the results of tests, in order to decide which model to choose. The individual characteristics of every factor will influence its explanatory variables, called individual effects. For example, although the preference factor or infrastructure is not mentioned in the model, it will affect each country’s trade flows. When individual effects do not exist, the best alternative would be the pooled model. The fixed and random effect models would be more favored if they exist and are represented in the model. According to the Gujarati (2003) theory, a fixed-effect model will be chosen if there is a correlation between individual effects and explanatory variables.
Meanwhile, to measure the net effects of explanatory variables on the dependent variable, the regression model would monitor and isolate the influence of individual effects from explanatory variables. However, the random effect model will be more efficient if the entities’ individual effects are not correlated with explanatory variables. The random effect model considers a new explanatory variable to be the residual of each entity (which is not correlated with explanatory variables) and can estimate invariant factors such as language and Distance. The fixed effect model’s main problem is not possible to estimate the variables that do not change over time directly in this model. Thus, the fixed-effect model will not support variables such as Distance, regional trade agreement, and language. Using the random effect model is the most appropriate model for many studies to solve that problem. Also, as the methodology used in their analysis by Cheng and Wall (2005), there is a way to estimate these invariant variables in FEM, running another regression with the independent variable as individual effects and the independent variables as invariant variables; However, the accuracy of the regression, as well as the Hausman test for fixed effect model and random effect model, may be affected by this technique. In this research, the researchers used the pooled model for estimation and a random-effects model. Two models can measure the trade equation, and then the Breusch-Pagan LM test will be applied to select the most suitable model for the panel results. Economically related factors, such as the gross domestic product of exporter countries and importer countries, are disregarded. To resolve this problem, the researchers proposed a random intercept model. This approach includes the same predictions as a fixed-effect approach; it also helps to estimate exporter- and importers invariant variables. The model of random effects more suitable when analyzing trade flows between a random sample of major international trading partners with a large population. Hausman test is used to determine which model is most appropriate for this study random effect model or fixed-effect model. The Hausman test is used to check whether the null hypothesis can be rejected or not. If the P-value (Prob > chi2) is less than 0.05 and significant, a fixed-effect model will be used. If the P-value is greater than 0.05, then the most effective model is the random effect model.
4.4. Panel Unit-Root Tests
This research examines the data’s univariate features through panel unit root tests before estimating Equation (3). The Panel Unit Root Test describes a theoretically co-integrated relationship between the variables. If all variables are stationary without a unit root IE, the researcher can apply the traditional methods to analyze the variables’ relationship. If the IE unit root test showed the variables are non-stationary, a co-integration test would be conducted. There are many different tests to examine the unit root for the panel data. There are IM-Pesaran-shin and Levin, Lin, and Chu (LLC) unit root tests applied in this research. These two techniques presume that autoregressive parameters are common across countries: IM-Pesaran-shin, the null hypothesis of all panels containing a unit root. At the same time, the LLC method uses the null hypothesis of a unit root. Table 4 represents the outcomes of the tests. The LLC test results showed that all variables are stationary, except that the importer country’s market trade openness is not stationary. IPS test results showed that all variables are stationary. A rejection of unit root by at least one test is used in this research to finalize that the variables are stationary. Since the IPS test results showed all variables are stationary, it means that no need to apply the co-integration test, and Equation (3) can be used to estimate the traditional models.
![]()
Table 4. The results of the panel root tests.
Note: The rejection of the null hypothesis significance rate at 10%, 5%, 1%.
4.5. Applying the Methodology
4.6. Estimation Results
The estimation results for the pooled, fixed, and random effect models are presented in Table 5.
The pooled effect model does not allow for cross sections’ heterogeneity, and cross-section-specific effects are not measured. In addition to those concerns, the pooled model assumes that all cross-sections are homogenous and assumes that the single intercept and same parameters overlap over time and across countries. In the second column of Table 5, the results of the pooled panel data model are given in Table 5 in the third column, the output of the fixed-effect model has been represented, in the fourth column represented the random effect model. The model of fixed effects has heterogeneity and causes the parameters and the intercept to vary across countries. To examine the likelihood of the data, the researcher applied the F-test. From Table 5, the null hypothesis for equality of individual effects has been rejected by the test. That’s mean the model of individual effects is more effective than the pooled effect model. The random effect model is represented in the fourth column of Table 5. The random effect model assumes that a specific distribution generates the effects. Although this model considers differences in countries, it cannot separately present each influence. The Hausman test was performed to test the null hypothesis of regressors, and individual effects are not correlated. This test will differentiate between fixed and unpredictable effects since the Null hypothesis cannot be rejected (Aliyu, Dada, & Adam, 2015). The random effect model is more suitable for this research, and that is mean the country-specific effects are not correlated with regressors. The researchers are also running the Breusch-Pagan LM random-effects model test. The test indicated that the hypothesis “there are no individual effects from the entities” was rejected, that indicates the low efficiency of pooled model. The researchers choose to pick the random effect model and focus on its results. The variables influencing Egyptian foreign trade are the economic size of both Egypt and the partner country (GDPi, GDPj), the Distance (Distance j), and (border j). The coefficients are highly significant with expected signs. However, population, trade openness, regional trade agreements, and language have a positive coefficient; they are insignificant coefficients on Egypt’s bilateral trade. This means that the gravity model is appropriate to explain Egyptian exports’ flows to its major trading partners. As can be seen from Table 5, R2 shows that the Random Effects model can explain approximately 37 percent of the variance in total exports between Egypt and its major trading partners. The F-test value indicates that, at a 1 percent level, the model’s overall significance is highly significant. The GDP product explanatory variables are significant at 1 percent level, the population of the importer explanatory variable is insignificant. The trade openness variable for importers is not a significant factor in explaining Egypt’s exports. GDP is 1.93e−6, which means that holding constant for other variables, a one percentage point increase in Egypt’s GDP will result in a 1.93e-6 percent
point increase in Egypt’s total exports. On the other hand, the importer’s estimated GDP coefficient is 5.98e−8, which means that holding constant for other variables, a one percentage point increase in the GDP of the importer will increase to approximately 5.98e−8 percentage point in the total Egyptian trade. The trade openness and the population do not show a significant coefficient, and there are not explanatory variables in the Egyptian export flow. The results of the dummy variables indicate that the distance variable is significant with the expected sign. Egypt exports fewer goods to countries where the official language is Arabic, not according to theoretical standards. The variable RTA (Regional Trade Agreements) is not significant. The insignificance of RTA may be constrained by the problem of similar comparative advantages, consumption issues, overlapping membership, policy harmonization, and low private sector participation. The border variable has a significant and positive effect on Egyptian foreign trade flows, so Egyptian exports will rise if the importing country is close to Egypt.
5. Conclusion and Research Limitations
The foreign trade sector is the engine of the Egyptian economy. It is essential to identify the economic factors that may affect Egypt’s bilateral trade to help government and policymakers take appropriate measures to improve the international trade sector’s performance. One of the most widely used theoretical framework methods is the gravity model to estimate foreign trade equations from 2000 to 2018 using panel data. For this empirical analysis, a sample of 36 countries was chosen. Three techniques involving the pooled model (common intercept model), the fixed effects model, and the random-effects model were performed in regression analysis. The F-test and the Hausman test were carried out in order to choose between models. Estimating the gravity model using a fixed-effect model is common practice. It has a significant drawback: it does not allow for the estimation of invariant variables between exporters and importers. The impact of economically relevant variables on trade is disregarded. The solution is a Random Intercept model. This approach allows both the variant for exporter- and importer-invariant variables to be estimated. The F-test rejected the null hypothesis of common intercept. When deciding between fixed and random effects, the Hausman test cannot reject the null hypothesis. This study showed that the most accurate results were generated by the random-effects model and then demonstrated it using this model.
Most estimated parameters had the predicted signs and were statistically significant. The regression results showed that classical gravitational variables have the expected sign and level of significance; indeed; the importer’s GDP is positively associated with Egypt’s exports. The results indicated that the higher in Egypt’s GDP had a positive effect since a higher income stimulated exports. The higher the income, the higher the volume of Egyptian exports that can take place. The results also indicated that the increase in GDP in importing countries positively impacted Egyptian exports. The higher the income of the importing country, the higher the volume imported from Egyptian exports. Distance has a negative sign and significant influence on Egyptian exports. Sharing common borders has a positive coefficient significant in Egypt’s trade flows. While sharing a common language, regional trade agreement, trade openness rate, and population have a negative impact on Egypt’s exports, which is not in accordance with theoretical expectations. These findings will enable the Egyptian government and policymakers to take practical steps to enhance the sharing of Egyptian exports in the world economy.
Limitation of the Research
The Egyptian economy in the context of international foreign trade scope is certainly a very broad topic. In this respect, it will be impossible to cover it with all its aspects within one research paper. Due to this reason, this research will be compelled to narrow down our research and mostly focus on two main points. The limits of this study include:
Firstly, Spatial boundaries: the main influencing factors affecting Egypt’s foreign trade.
Secondly, Temporal boundaries: the influencing factors affecting the Egyptian foreign trade period from 2000 to 2018.