The Effect of Gas Production, Utilization, and Flaring on the Economic Growth of Nigeria ()
1. Introduction
The strategies of many countries are often woven around, and influenced by available resources such as mineral deposits, oil and natural gas. In view of this, [1] concludes that the presence of natural resources (especially oil and gas) plays an important role in national development strategy. This notwithstanding, the existence of natural resources does not always translate to development—a situation that may have influenced certain views. Michael Ross [2], for example, propounded the resource curse theory, a theory which perhaps substantiates the view that while growth rates in resource-rich countries seem stagnated, there are signs of rapid growth in resource-poor countries [3-5]. Although many reasons have been adduced for this [6-8], the authors of this paper identify with the view that the inability of resource industries to stimulate growth cannot be totally divorced from the predominance of the resource extraction Industry by foreign multinationals who choose to repatriate their profits instead of (re)investing them locally [9,10]. There is also a suggestion of a positive association between resource extraction and breakdown in law and order [2,11]. This may, perhaps be the reason why in Nigeria, no meaningful progress has been made in reducing the frequency and level of oil spill incidences, poor remediation and clean up of the environment, illegal oil exploration and refining, among others.
In spite of these observations, in Nigeria for instance, there seems to be a determination to correct the perceived imbalances in the management of the oil and gas sector. For example, rather than allow the flaring of associated gas, the Nigerian National Petroleum Corporation (NNPC) hopes to transform Nigeria into a leading Liquefied Natural Gas (LNG) producing and utilization nation [12] by commercializing Nigeria’s abundant gas reserves and promoting a viable LNG industry. The comment by Mrs Diezani Alison-Madueke (Nigeria’s Minister of Petroleum Resources), that Nigeria intends to reduce flared gas from the current 7% to 2% by 2017 [13] corroborates this desire. This is a laudable vision as better exploitation of natural gas resources, especially those under utilized in West Africa, is seen as a significant way to satisfy the world’s increasing natural gas demand, which has been projected to grow by 1.9% annually, reaching 4700 billion cubic metres (BCM) in 2030, and account for 24.4% of expected energy consumption [14,15]. However, this vision can only be realized if established management principles and procedures are adopted. First, those assets and capabilities that could enhance the efficiency and effectiveness of adopted development strategies need to be identified [16]. This is because some resources may actually prevent some valuable strategies from being conceived and implemented [17]. Michael Porter’s works [18-21] are good sources of information on the relationship between resources and sustainable development/ competitive advantage.
In view of the above, this paper intends to contribute towards the oil and gas development strategy of the Federal Government of Nigeria through a systematic analysis of gas production, utilization, and flaring. It shall go further to make a case for better regulation and management of the gas sector of the oil and gas industry as a way of maximizing its potentials. Although, there have been earlier studies of gas flaring in Nigeria, they are fundamentally different from this. For instance, [22] attempted an assessment of the economic cost of gas flaring in Nigeria between 1965 and 2008, but did not quantify this in monetary terms, perhaps the only language known to public (political) office holders in Nigeria. Another study by [23] looked at the contributions of major oil companies to the overall gas flaring activity in Nigeria, while [24] on the other hand, studied the relationship among gas flaring, transportation and sustainable energy development in the Niger-Delta region of Nigeria.
2. Literature Review
2.1. Natural Gas Resource in Nigeria
Nigeria boasts of substantial natural gas reserve that is estimated to be even greater than her oil reserve [25]. It could be seen from Table 1 below that as at the end of
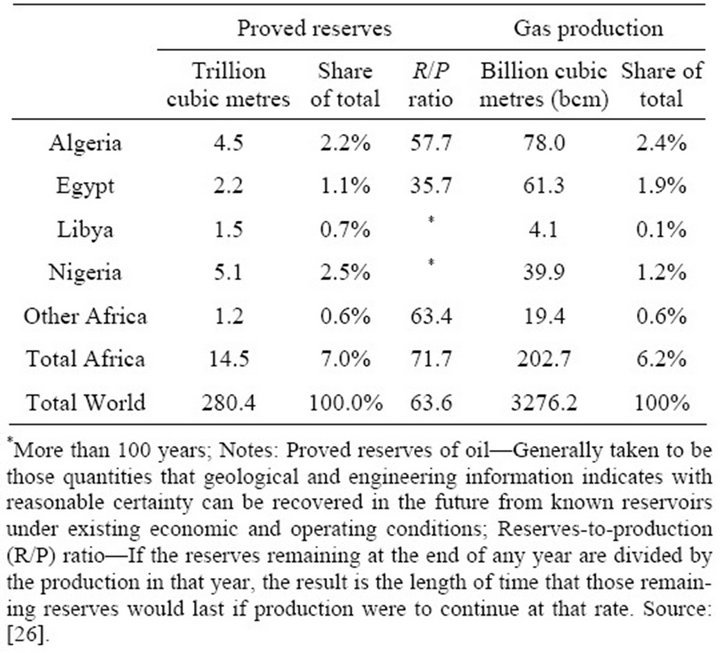
Table 1. Nigeria’s natural gas proved reserves and production at the end of 2011.
2011, the proved natural gas reserve of Nigeria is estimated to be about 5.1 trillion cubic metres; about 2.5% of the 208.4 trillion cubic metres of world proven natural gas reserves, and reserves-to-production (R/P) ratio of more than 100 years [26].
In spite of the estimated gas potentials, both anecdotal and empirical evidences suggest that the potentials from the level of resource endowment have not been maximally exploited. It could be seen from the data presented in Table 1 that while Nigeria has the highest proved gas reserves in Africa, it is placed a distant third in terms of gas production. The inability to maximise our gas reserve potentials could partly be blamed on gas flaring activity. Gas flaring, which is the combustion of associated gas produced with crude oil or from gas fields [27], has been discussed extensively in existing literature. Associated gas is the raw natural gas (usually a mixture of methane and other hydrocarbons) that emerges from oil wells [28].
2.2. Gas flaring in Nigeria: A Comparison with Global Trend
There seems to be a level of uncertainty about the actual volume of gas flared globally. This is perhaps due to lack of monitoring equipment and limited oversight [29], as well as the inability of many countries to publicly report gas flaring volumes [30].
Farina [29], for instance, suggests a global annual gas flare volume of 120 to 200 BCM, while [31] gives a figure between 140 to 170 BCM. Again, GGFR [32] estimates that about 146 BCM of natural gas is flared globally every year, GGFR [33] notes that in 2011, a lower volume of 140 BCM of natural gas was flared globally. Figure 1 below shows the volume of gas flared globally from 1994 to 2011 as estimated by the Defense Meteorological Satellite Program (DMSP) [34].
A significant inference to be drawn from [34] is that gas glaring is not evenly spread but concentrated in a small number of countries; with the top two gas flaring countries (Russia and Nigeria) accounting for about 40% of global gas flare and the top twenty countries account-
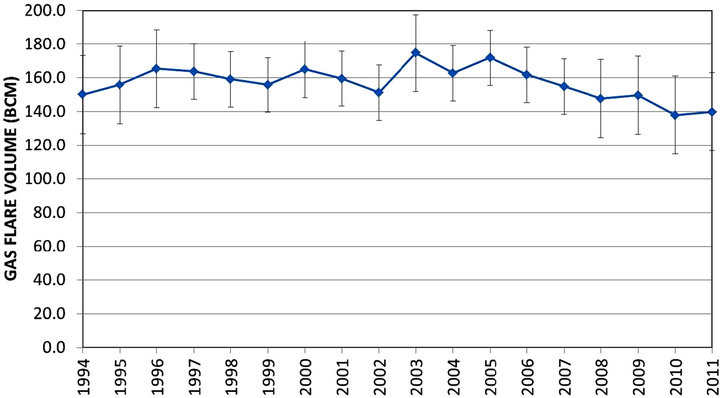
Figure 1. DMSP global estimates of flared gas volume (Source: [34]).
ing for about 85% of total global gas flare [31].
The impression created by the figure above confirms the view that Nigeria has, perhaps, one of the worst rates of gas flaring in the world [35], having flared about 76% of her natural gas in 2002 [36], and 60% in 2006 [37]. These flare data are an accumulation of the 2.5 billion cubic feet of gas that is flared per day, amounting to an estimated 2.5 billion US dollars yearly revenue loss [38]. These data can be placed within the context of Figure 2 below which shows Nigeria’s natural gas production, utilization and flaring trend between 2002 and 2011.
2.3. Major Motivators of Gas Flaring
While gas flaring could be carried out as a precautionary measure on oil exploration and production fields/platforms, unregulated flaring could have disastrous consequences. Gas flaring occurs due to several reasons. In the views of [40], it could be due to safety reasons wherein gas is flared in order to relief pressure on the system in cases of emergency or during maintenance; or as part of quality assurance procedure during well tests or start-ups of new installations, where gas is flared until gas with the required properties (for transportation or re-use) is obtained. Reference [31] believes that a major reason for continued gas flaring is the dearth of infrastructure which makes it impossible to commoditize the gas. This category of continuous flaring represents the largest quantities. Specifically with respect to Nigeria, [41] suggests that gas flaring has continued because of limited number of reservoirs suitable for gas reinjection/storage, the cost of developing major and inter-connecting network of gas pipelines, low technological and industrial base for energy consumption in the country, limited regional and international gas market, as well as inadequate fiscal and gas pricing policies to encourage investment. It has been noted that the dearth of infrastructure results in the flaring of approximately 76% of associated gas in Nigeria, compared 8% in Alberta, Canada [42,43]. Some other sources present an economic perspective to gas flaring, observing that it oil companies may find it cheaper to pay fines (often viewed as insignificant by the oil companies) that may be levied on them for flaring gas, than finance the re-injection of the gas back into the oil wells [44].
2.4. Economic and Environmental Implications of Gas Flaring
There are no doubts about the environmental, health and economic implications of gas flaring. An instance of this is the observation by [29] that gas flaring leads to environmental degradation, which impacts significantly on local populations, with a high likelihood of loss of livelihood and severe health issues. The soot and carbon monoxide resulting from the incomplete combustion of associated natural gas contribute to air pollution [45]. Again, according to [28], associated gas flaring releases carbon dioxide (CO2) and carbon monoxide (CO), alongside other pollutants such as volatile organic compounds (VOC) into the atmosphere. And these pollutants lead to premature death, respiratory illnesses, cancers, asthma attacks among others [46].
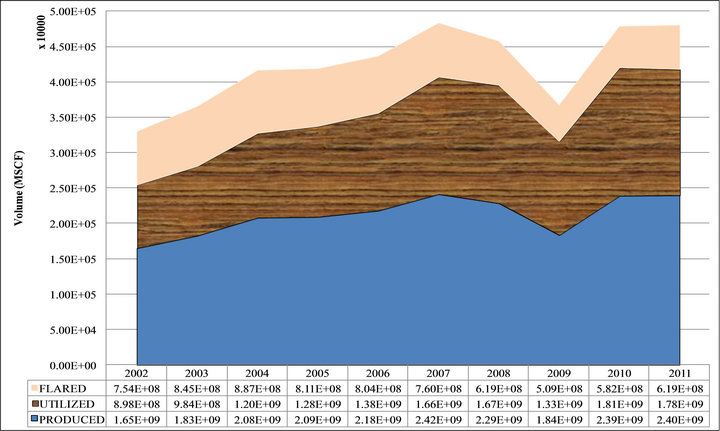
Figure 2. Ten year trend of natural gas utilization, production, and flaring in Nigeria (Source: [39]).
It is estimated that about $3 billion is lost annually through gas flaring in sub-Saharan Africa [47]. Equally, the energy resource wasted in Nigeria alone is equivalent to 45% of the energy requirements of France [48]. The World Bank [49] highlights how the volume of flared natural gas could help boost electricity generation. Gas flaring contributes to global warming by emitting greenhouse gas and carbon dioxide equivalent (CO2 e) into the atmosphere [29,31,50]. In Nigeria, an estimated 35 million and 12 million tons of carbon dioxide (CO2) and methane (CH4) respectively, acknowledged as global warming inducing substances, are released into the atmosphere [42,51].
2.5. Utilization of Flared Gas
The above statistics and their attendant consequences notwithstanding, the argument has not been whether associated gas should be flared at all, but rather how best to effectively utilize associated natural gas and or regulate its disposal. There is a business case for proper harnessing and adequate utilization of associated natural gas, as it can be a source of huge foreign exchange [52]. Offshore associated gas could be treated, recovered and economically utilized in power generation [53]. This view is supported by the outcome of the study by [54] which suggests that substantial amount of money could be saved if conventional fuel and energy were to be substituted with natural gas. This could also reduce the level of loss reported by [47].
3. Materials and Method
3.1. Data Sources
The results presented here were derived from data obtained from secondary sources. The data on gross domestic product (GDP), and the capital stock (K) measured by the gross capital formation (GCF) were obtained from the National Bureau of Statistics data portal. The data used for labour stock (L) were the total labour force data of Nigeria, obtained from the World Banks World Development Index (WDI) database. Nigeria’s gas production, utilization, and flaring data were obtained from the Nigeria National Petroleum Corporation’s (NNPC) statistical bulletins.
3.2. Model Specification
This study assesses the influence of the volume of gas flared on the economic growth of Nigeria (GDP in this instance) using an econometric analysis based on the Cobb-Douglas non-linear production function built around gas production and utilization. The model is thus used in estimating the impact of these components on Nigeria’s economic growth. The model is an independent and additive one, relating economic growth with components of gas production (GASP) and gas utilization (GASU). The essence of this model is to determine, simultaneously, the relative weights of each component— gas production and gas utilization—on improved economic growth in Nigeria, using gross domestic product (GDP) as proxy. Emphasis is placed on whether gas production and utilization has a significant impact on economic growth of Nigeria. Against this background, the model is formulated using the Cobb and Douglas [55] version of the production function, which according to [56] is popular in applied research because it is easier to handle mathematically. The production function in its general form is purely technological in relation to quantities of inputs and outputs. The production function in the neo-classical growth model is given as:
 (1)
(1)
where Q = output (amount); K = capital input; L = Labour input.
The above was expanded and transformed by [55] to yield the Cobb-Douglas production function shown below:
 . (2)
. (2)
Disembodying capital from Equation (2) above yields;
 , (3)
, (3)
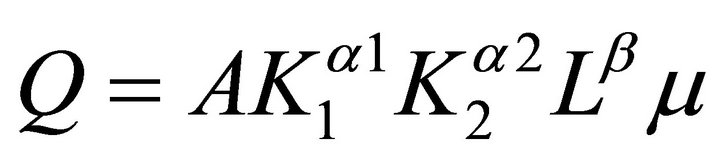
where Q is the output; A is the technical efficiency (or coefficient of production); K1 is the gas production and utilization; K2 is the capital inputs proxied by the nation’s gross capital formation.
Disaggregating Equation (3) above yields
 . (4)
. (4)
In view of the fact that the Cobb-Douglas production function exhibits a non-linear relationship, it would be more appropriate to work with the logarithms of the variables during the transformation process of estimation.
 (5)
(5)
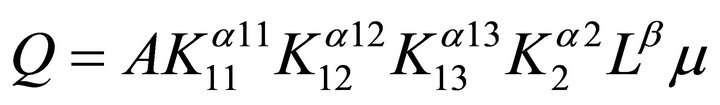
where lnQ = log output proxied by the nation’s GDP; lnA is the log of technical efficiency (or coefficient of production); K11 is the volume of gas produced; K12 is the volume of gas utilised; K13 is the volume of gas flared; lnK2 is the log of capital inputs; lnL is the log of labour input; α11 - α13 are the estimation parameters associated with the influence of gas production and utilisation on economic growth in Nigeria; α2 and β are the estimation parameters associated with the influence of capital and labour on economic growth in Nigeria; µ is the disturbance term.
The a-priori expectation regarding the relationship among the independent variables (K11, K12, K13, K2, L) and the dependent variable (GDP) is that  . That is, all coef- ficients, with the exception of gas flaring, are expected to positively impact on the economic performance of Nigeria.
In estimating the model, a multiple regression analysis is used in order to reflect the explanatory nature of the variance; while verification of the validity of the model was based on two major evaluation criteria:
1) The a-priori expectation criterion which is based on the signs and magnitude of the coefficients of the variables under investigation, and.
2) Statistical criteria which are based on statistical theory, which in other records is referred to as the first order least square (OLS) consisting of R-square (R2), F-statistic and t-test. The R2 is concerned with the overall explanatory power of the analysis and the t-test is used to test the significant contribution of the independent variable on the dependent variables [57, 58].
4. Results and Discussion
The summary of the result of the regression analysis carried is presented in Table 2 (see Appendices 1 and 2 for details of data used and result obtained respectively).
The regression result with an R2 value of 0.99, shows a good fit, suggestive that 99% variation in the dependent (endogenous) variable (GDP) is explained by the explanatory (exogenous) variables (gas produced, gas utilized and gas flared), while the error term takes care of the remaining 1% (which are the variables in the study that cannot be included in the model because of certain qualitative features). The computed F-statistic value of 59.36, which is greater than the tabulated F-statistic value of 2.58 at 5% level of significance, indicates a negative relationship between economic growth and gas flaring in Nigeria. Furthermore, a Prob (F-statistic) value of 0.00763 shows that the regression equation has some degree of validity in fitting the data; in order words, the independent (exogenous) variables are not purely random with respect to the dependent (endogenous) variables.
A consideration of the coefficients and associated tvalues shown in Table 2 shows an agreement with the a-priori expectations in all the variables except that of gas produced (GASP) and capital (K). It could then be concluded that gas flaring has a negative impact on the economic growth of Nigeria. Again, gas production in Nigeria could be said to be statistically insignificant to her economic growth. This outcome is not surprising because, as pointed out earlier, although Nigeria’s 5.1 trillion cubic metres of proved gas reserves is the highest in Africa, she produces only 39.9 billion cubic metres of
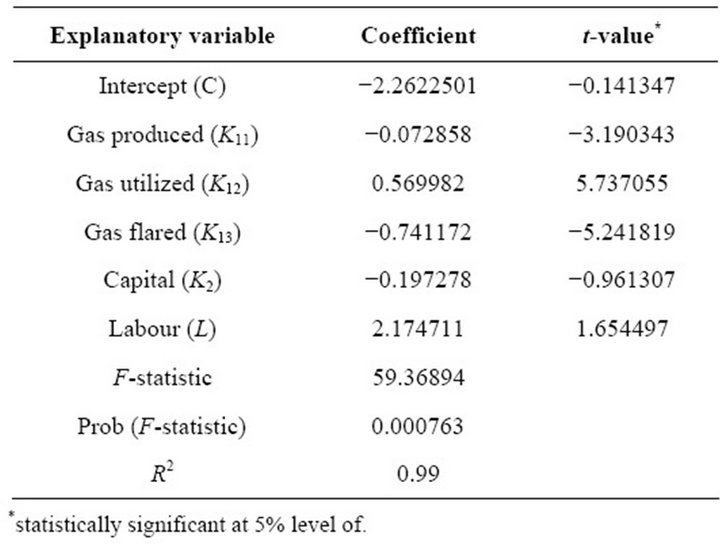
Table 2. Summary of regression result.
gas, placing her third behind Algeria with 78.0 billion cubic metres and Egypt with about 61.3 billion cubic metres. Indeed, a similar conclusion was drawn by [59] who concluded that “···gas production in Nigeria at this current state is not economically or socially worthwhile. That is, it is not profitable to the society.” While this may sound absurd, it should be seen more from the inability to put gas produced to productive use, and less from the volume of gas produced.
5. Conclusion and Recommendations
The practice of flaring gas and its implication(s) on Nigeria’s economic growth and stability has been considered within the traditional resource management viewpoint. The study has been empirically underpinned using a multiple linear regression analysis which established that gas production and flaring impact negatively on the economic growth of Nigeria, thus corroborating the “resource curse” arguments. In the light of this outcome, there is a need to turn this threat/weakness (gas flaring) and opportunity (gas production) into an economic strength.
In the light of the above findings, there is a need to improve on the gas production capacity of Nigeria, while reducing the volume of gas flared to its barest minimum. Consequently, the Federal Government of Nigeria, through its organs and agents, is advised to:
1) Construct more reservoirs suitable for gas re-injection and storage.
2) Expand local and regional gas networks, so as to facilitate improved local consumption of gas produced.
3) Establish adequate fiscal/gas pricing policies as a way of improving/encouraging investments in the gas sub-sector of the oil and gas market.
4) Strengthen existing legal framework so that it could be at par with international standards; Specifically, there is need to re-visit the existing punishment prescribed for indiscriminate gas flaring and other associated practices in the oil and gas industry as these have not been effective.

Appendix 1. Raw Data Used.

Appendix 2. Result of Regression.