Climate Change Impact on Sub-Surface Hydrology of Kaduna River Catchment ()
1. Introduction
Climate Change is no doubt one of the major challenges facing the human race today, especially in the midst of tight competition among the leading countries of the world in the area of technological advancement and industrialization Hassan [1]. [2] observed that global climate changes induced by increase in green house gas concentrations are likely to change precipitation patterns and probability rise the frequency of extreme events such as flood and drought. These changes as observed by [3] may have serious impact on the society because of both sea level rise and an increase in the occurrences of flooding events. The Intergovernmental Panel on Climate Change (IPCC) working groups 1 observed that long term trends from 1900-2005 have been observed in precipitation amounts over many large regions of the world. Drying according to the report has been observed in the Sahel and Mediterranean, Southern Africa and part of Southern Asia. More intense and longer droughts have been observed over wide areas since the 1970s particularly in the tropics and sub-tropics.
Precipitation is the principal means of replenishment of moisture in the soil water system and recharge to ground water. Moisture movement in the unsaturated zone is controlled by capillary pressure and hydraulic conductivity. The amount of moisture that will eventually reach the water table is defined as the natural ground water recharge. The amount of this recharge depends on the rate and duration of rainfall, the sub-sequent condition at the upper boundary, the antecedent moisture conditions and the water table depth and soil type [4].
[5] assessed the likely impact of climate changes on catchment hydrology and water resources. [5] used statistically downscaled out put from Global Climate Models as forcing into a lumped conceptual rainfall-runoff model, to analyzed changes on ground storage, steam flow and extreme events. Future simulations using the rainfall-runoff models suggest the reductions in soil moisture storage throughout the summer and autumn months are likely for catchment across the globe. The decrease in storage is likely dependent on the storage potential of the individual catchments. The lower the capacity of a catchment to store water the greater the sensitivity of climate change. Reductions in ground water storage during the recharge period according to [5] will increase the risk of severe drought because of failure of winter or spring precipitation may results in prolong drought period where the ground water system is unable to recover.
The impact of climate change according to [6] on water resources systems may be modeled by either the climate scenario approach or the approach based on the stochastic weather generator. The first approach which is a historical downscaling has so many limitations to its applicability [7,8]. The second approach which is based on the use of stochastic models at the site of a hydrological modeling tool proposed by [7,9] appears a better approach to estimate the possible climate impact on stream flow. In assessing the impact of climate change on ground water as sources of fresh water resources, [10] used the impact of many climate change scenarios on the ground water systems.
The paper was aimed at applying stochastic weather generator module of a hydrological model to estimate the likely impact of forecasted climate variable as forcing to generate the likely impact on ground water.
2. Materials and Methods
2.1. The Study Area
Kaduna River (Figure 1) is the main tributary of Niger River in central Nigeria. It rises on the Jos plateau south west of Jos town in a North West direction to the north east of Kaduna town. It then adopts a south westerly and southerly course before completing its flow to the Niger River at Mureji. Most of its course passes through open savanna woodlands but its lower section cut several gorges including the granite ravine at Shiroro above its entrance into the extensive Niger flood plains.
2.2. Stochastic Modeling of Future Climatic Variation Parameters
A changing climate according to [11] leads to changes in the frequency, intensity, spatial extends, and duration and timing of extreme weather and climate events, and can results in unprecedented extreme weather and climate events. The character and severity of impact from climate extremes depends not only on the extreme themselves but also on the exposure and vulnerability as observed by [12]. Global climate change is expected to have a strong impact on water resources on local [13] regional Haseman [14] and global scales [15]. Changes in the precipitation patterns affect surface and ground water availability and runoff directly while changes in temperature, radiation and humidity have an effect on evapotranapiration [11].
To asses the variability in the hydrological responses
due to climate change GCM-forced hydrological model are used [16]. The role of hydrological models as part of global climate models has become imperative. The essential component of global climate models as observed by [11] are; the fluxes of moisture and energy from land to atmosphere and from land to oceans, the impact of soil moisture on plant cover and CO2 fluxes. These components of GCM are often very sophisticated i.e. dividing the atmosphere into many layers [16]. Global atmospheric general circulation models (GCM) have been developed to simulate the present climate and used to predict future climate change by using regional hydrological models [16] The use of regional hydrological in assessing the impact of climate change has many attractive characteristics [17].
There exist therefore many gaps in the relationship between hydrological modeling and climate modeling as observed by [18]. Recent research development and achievement have been proposed by [18] to handle the problem of mismatch between GCM and hydrological models. The challenging task for both the meteorologist and hydrologist arise from the fact that the meteorologists who work with large complex models are forced through computational limitations to operate on a coarse grid scale whishing and to move to finer scale (scale down) while the hydrologists on the other hand are used to modeling at much smaller scale and is having to scale up. To circumvent the problems and narrow the gaps between GCM ability and hydrological models various methodologies have been developed during the past 20 years [18]. The approaches are; dynamic downscaling approach for generating high resolution meteorological input, statistical downscaling approach for simulating local scale surface variable based on large scale free atmospheric variable, and macro scale hydrological modeling approach and hypothetical scenarios have been used as input into the model to show the sensitivity to climate with reasonable interval.
Methods of simple alteration of the present condition proposed by [19] are widely used by hydrologist. In the approach, various hypothetical climate changes have been adopted and climate predictions for double CO2 conditions have become the standard. The procedure for estimating variables of rainfall and temperature on the hydrological behavior of Kaduna River catchment consist of the following steps derived from [17]; first parameters of the hydrological model were determined by calibrating the model with historic data, secondly, monthly historical time series of rainfall and temperature for the hydrological year 2010 were perturb according change scenario by adding ∆T = +1, +2, +4, for temperature and 1 + ∆P/100 for rainfall, thirdly, the hydrological characteristics of the catchment were simulated using the calibrated model.
Daily climate variables of temperature and rainfall for the year 2010 was used as a threshold at the site of the model to generate a 2, 5, 10, 20, 50, and 100 years monthly time series in the future. Frequency graphs for the return periods were constructed.
2.3. The Modeling Tool and Ground Water Modeling System
2.3.1. The Modeling Tool
Hydrognomon is a software application suitable for the process and analysis of hydrological time series, test, intensity Duration Frequency curves, stage-discharge curves construction and calculation, hydrometry, hydrological simulation of water basins, evaporation and evapo transpiration calculations. Data are usually imported through standard text files, spread sheets or by typing. The available processing techniques for the tool includes time step aggregation and regularization, interpolation, regression analysis and infilling of missing values, consistency test, data filtering, graphical and tabular visualization of time series. Hydrognomon support several time step from the finest minutes scales up to decades. The programme also include common hydrological application such as evapotranspiration modeling, stage discharge analysis, homogeneity test, areal integration of point data series, processing of hydrometric data as well as lumped hydrological modeling with automatic calibration facilities (Figure 2).
2.3.2. Ground Water Modeling System
The impact of climate change on the ground water system is simulated by applying the hydrognomon rainfallrunoff, recharge-discharge lumped based distributed hydrological model. The forecasted future climate variable parameters of rainfall for 2, 5, 10, 20, 50 and 100 yearly time step was applied a forcing into the ground water recharge for 100 × 130 mm model cell in the watershed. Prior to the simulation process, the intensity measurement of gauge level at Kaduna South Water works was used for scaling the flow to watershed volume.
2.4. Data Used
The historical data used for the calibration were recorded rainfall and gauge height levels at gauging point (Datum at 582.96 m) located in the study area at Kaduna south water works for 26 years (1975-2000). The data are totals on monthly basis spanning the calibration period. The steps of the data collection process involve the following:
• The daily stream flow was read as gauge height while the daily rainfalls were read for each of the stations;
• The monthly maximum stream flow values and rainfall values were extracted from the daily values;
• The gauged levels measured were used to scale the

Figure 2. Structure of the simulation module
(http://www.hydrognomon.org) [19].

Figure 3. Map of Kaduna River showing sampling locations.
flow to runoff volume of the watershed by using the expression below [20].
Q = ICA.
where Q =calculated runoff;
I = gauged water levels;
C = a factor (distribution coefficient) the ratio maximum gauge level at a point to the mean gauge levels of Kaduna river.
A = drainage area of Kaduna river.
In determining the initial moisture content and moisture content at saturation, soil samples were obtained at four different locations along the river bank (Figure 3) representing four land use pattern. The four locations represent densely vegetated condition sample location 1 (SL1), sparsely vegetated conditions sample location 2 (SL2), crusted condition sample location 3 (SL3) and bare land conditions sample location 4 (SL4). The method of undisturbed sampling was employed in obtaining the samples for testing. The samples were taken using cylindrical core cutters (100 mm by 130 mm). The recharge to ground water was simulated at initial moisture content and moisture content at saturation while simulations at completely unsaturated condition (0%) moisture serves as control by adjusting the most sensitive parameters of rainfall and soil-water content.
3. Results and Discussions
The average monthly variations in ground storage are as depicted in Figure 4 above. Increase in ground storage was observed at 2 years ARI, followed by a sudden drop at 5 years ARI. At 10 years to 100 years ARI, a steady increase was observed. This increase may results in increase in the amount of gravitation water and hence a further increase in water available in the zone of saturation.
The average monthly base flow in Kaduna River as depicted in Figure 5 above indicate an initial increase in base flow at 2 years ARI simulations to 5 years. At 10 years a constant value was observed up to a 100 years. This value increases steadily throughout the summer and autumn months.
The average monthly decrease in soil storage is as shown in Figure 6. At 2 years ARI simulations, an increase was initially observed, but at 5 years simulation, the soil storage decrease significantly. At 10 years ARI a slight decrease was observed and remains constants for the remaining simulations periods.
4. Conclusions
From the study we concluded the following:
• The hydrognomon model identified a base flow

Figure 4. Average monthly variability of ground storage in Kaduna River.

Figure 5. Average monthly variability of base flow in Kaduna River.
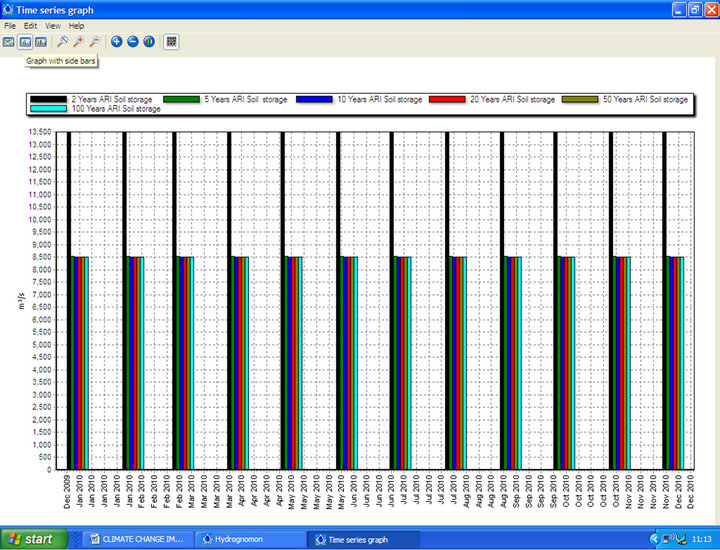
Figure 6. Average monthly variability of soil storage in Kaduna River.
component that is spatially lumped and does not take into considerations the heterogeneous nature of ground water aquifers or their storage and discharge capacities.
• A future simulation indicates a reduction in soil storage throughout the summer and autumn months. Largely dependent on the response of the catchment to climate change. The lower the capacity of a catchment to store water, the greater the sensitivity to climate change as proposed by Murphy and Charlton (2006).
• Increase in ground storage will lead to increase in gravitational water and this will lead to increase in storage and discharge potential of aquifers located along Kaduna River.
NOTES