Warfare vs. Welfare Finance: Assessing the Effect of Military Expenditure on Out of Pocket Healthcare Financing for NATO Countries ()
1. Introduction
Out of pocket (OOP) payments can be defined as any direct outlay from health consumers to health providers for healthcare utilization, which it excludes any refund-reimbursement either by public or private risk pooling insurance arrangements (Grigorakis et al., 2022) . The reliance of health systems financing on high levels of OOP payments can make population accessibility to health facilities difficult, may drive people to experience financial hardship, and may lead worse-off and vulnerable socioeconomic strata to impoverishment (Chantzaras & Yfantopoulos, 2018) . For monitoring and reducing financial hardship owing to high OOP payments levels, the United Nations (UN) has prompted Universal Health Coverage (UHC) since 2015 as one of the most important health sustainable development goals (SDG’s) for the 2030 Agenda (WHO, 2016a, 2016b) . Especially the indicator 3.8.2 which monitors and captures at a global level the proportion of the population with high enough OOP payments as a share of total household consumption or income reflects the interest and focus of the UN and WHO on this major critical concern (Yerramilli et al., 2018) . Existing empirical evidence indicates that when OOP spending to current expenditure on health (CHE)1 is more than 15% in a country, then households present a higher tendency to experience financial distress or even catastrophe due to OOP payments; reflecting in such a way an ineffectiveness of health systems to provide financial protection to their citizens against OOP spending for necessary healthcare (Xu et al., 2018; Xu et al., 2003) . Empirical health financing literature clearly advocates that OOP healthcare spending negatively corresponds to increased public expenditure on health (i.e., irrespective of health system financing structure) and the available fiscal space for general government consumption (Grigorakis et al., 2022; Grigorakis et al., 2018; Wagstaff et al., 2018; Younsi et al., 2016; Fan & Savedoff, 2014; Xu et al., 2011) .
However, several countries prioritize developing and enlarging their arsenals rather than promoting financial protection against OOP spending by financially increasing the domestic general government health expenditure (GGHE-D) on their governmental or societal-based health insurance systems as UHC proposes. Glaring example is the North Atlantic Troup Organization’s (NATO) recommendation to its allied countries-members that should at least spend 2% quota of their GDP on military expenditure since the 2002 NATO Summit in Prague (Odehnal et al., 2021) . Further, at the 2014 NATO Summit in Wales allied members politically committed that the minimum 2% of GDP standard is binding, while the allies were encouraged for a military expenditure impetus for the next decade (Alozious, 2022) . Despite the fact that all NATO allies agreed in 2014 Summit to the 2% baseline, which is widely known as Defence Investment Pledge (DIP), only a few countries had fulfilled the commitment to increase military spending to GDP. Especially, prior to Russia’s annexation of Crimea in 2014, only a handful of the NATO’s allies (i.e., Greece, Turkey, UK and the USA) actually spent more than the recommended military burden to national income, while the alliance average corresponding to 1.65% from 2000 to 2021, much lower than the 2% of the Organization pledge guideline (SIPRI, 2023) . Nonetheless, since the Russian invasion in Ukraine on 24 February 2022 and the nightmares of the “iron curtain2” to return back to the European continent, several European countries have decided to overcome their parsimonious policies for military spending in the previous decades, by monumentally increasing the power deterrence of their arsenals. Especially, several European parliaments (e.g., Czechian, Danish, Dutch, Estonian, French, German, Italian, Latvian, Polish, Romanian, Slovakian, Slovenian, Spanish) clearly declared to massively increase their military expenditure as a share of their national income and, thus to meet or even exceed the 2% NATO’s target, for offsetting any potential Russian threat. Even, Finland and Sweden, which recently agreed to abandon a long period of warfare neutrality and join NATO, decided to rapidly increase their military burden from nearly 1.2% to more than 2% of their GDP until 2024 (SIPRI, 2023) .
Defence economics literature suggests that the fiscal prioritization of a country on armaments unavoidably diminish the share of fiscal capacity that could be dedicated to public health funding; generating in this way the crowding-out effect of military expenditures on health budget allocation, whereby military expenditures shrink the public finances potentiality for greater budgeting allocations on national and health insurance systems (Fan et al., 2018; Zhao et al., 2017; Harris et al., 1988; Apostolakis, 1992; Russett, 1969) . Indeed, when a country chooses to prioritize its arsenal dynamic by raising military expenses on government budgets then unavoidably deprives fiscal resources from social spending (i.e., and vice versa) taking into consideration the financial restraints of a government budget (Kollias & Paleologou, 2019) . The widely known economic term “Guns or Butter” explains this dynamic competition between military expenditures for national defence-security objectives and social spending for socio-economic prosperity, reflecting the warfare versus welfare trade-off (Coutts et al., 2019; Agostino et al., 2017; Dunne et al., 2005; Scheetz, 1992; Mintz, 1989) .
Since the seminal study of Russett (Russett, 1969) , which concludes for the crowding-out impact of military expenditures on more socially beneficial state spending priorities, a substantial body of theoretical and empirical defence economics literature has examined the trade-off between military and health expenditures, by testing the crowding-out hypothesis; does military expenditure scaling up crowd-out governmental resources for social and welfare programs, including also state health financing? (see among others, Adhikary & Khatun, 2018; Bhattacharjee & Mazumdar, 2018; Fan et al., 2018; Eryigit et al., 2012; Ali, 2011; Apostolakis, 1992; Ozsoy, 2002; Yildirim & Sezgin, 2002; Deger, 1985; Peroff & Podolak-Warren, 1979; Dabelko & McCormick, 1977; Peroff, 1976 ). The vast majority of these studies are congruent that military spending as a percentage of the economy is necessary for national security purposes but no valued associated in stimulating public health funding, precisely indicating what the crowding-out hypothesis suggests for the defence expenditures impact on the other general government spending, including also health funding.
Although the substantial body of defence economics literature for the impact of military spending on public expenditure on health is based on the crowding-out assumption, there is only an empirical study in the available literature that testes the defence-military economic burden on the OOP healthcare financing. The recently published study of Grigorakis and Galyfianakis (Grigorakis & Galyfianakis, 2023) indicates that military expenditure as a share to GDP has a positive effect on OOP payments to CHE in all their selected groups of countries, by employing dynamic panel data specifications from 2000 to 2018 for 129 countries around the world. On the other hand, a fairly large health financing literature has investigated the responsiveness of OOP payments to several macroeconomic, health systems structuring and demographic explanatory variables (Grigorakis et al., 2022; Rana et al., 2020; Grigorakis et al., 2018; Younsi et al., 2016; Fan & Savedoff, 2014; Keegan et al., 2013; Xu et al., 2011) . So, despite the evidence arising from the health financing and defence economics empirical literature, there is quite limited consensus regarding the direct impact of military expenditures on the main private health funding contributor of overall health financing, the OOP healthcare payments.
Against this literature background, the aim of this study is twofold, namely: a) to indirectly contribute to the existing defence economics literature by investigating the warfare-welfare trade-off of military expenditure on state budgets allocations on health, since OOP spending for health is considerably associated to public expenditure on health according to the health financing literature and b) to extend previous health financing empirical evidence by re-testing the direct effect of military economic burden on OOP payments based on a homogenous group of countries, the NATO Alliance, for the first time. This is done by utilizing a dataset that encompasses panel data of 29 NATO countries from a period lasting from 2000 to 2021 and by employing a dynamic panel model econometric specification. In this regard, our study aims to especially emphasize on the validation of the hypothesis that the greater levels of military expenditure are considerable catalyst for increasing OOP payments. Post to the economic fallout of the Covid-19 pandemic and towards Europe’s energy and inflation crisis spiraling into an economic and social crisis, this study gives the opportunity to provide useful insights to policy-makers on the foreground of a great rearmament of Europe.
The remainder of this paper is structured as follows. Section 2 reviews the literature. Further, section 3 describes the data and econometric methodology used. Section 4 illustrates and discusses the empirical results. Finally, section 5 concludes the study.
2. Literature Background
2.1. The Rationale of Financial Risk Protection against OOP Payments
Saksena et al. (Saksena et al., 2014: 1) state that “financial risk protection is a key component of universal health coverage (UHC), which is defined as access to all needed quality health services without financial hardship”.
Financial catastrophe due to OOP payments occurs when households spend for health more than they are able to pay for, while they may use savings, sell off assets or even enter in damage debts in order to do not forego necessary healthcare (Van Doorslaer et al., 2007) . Further, the phenomenon of households’ financial hardship or even catastrophe owing to OOP medical payments is geographically borderless and not strictly associated to national income classifications (indicatively cited, Giannouchos et al., 2020; del Pozo-Rubio & Jiménez-Rubio, 2019; Baird, 2016; Grigorakis et al., 2017; Grigorakis et al., 2016; Kronenberg & Barros, 2014; Poulsen, 2014; Waters et al., 2004 ). A more recent study indicates that the incidence of financial catastrophe due to OOP healthcare payments is highly correlated with the burden share of OOP expenditure on overall financing of health, presenting in such a way that even high-income countries like Greece and Portugal exhibit considerable percentages of the population spending more than 10% of their annual income on OOP spending (Wagstaff et al., 2020) . Moreover, Wagstaff et al. (Wagstaff et al., 2018: 173-176) , using survey data for 94 countries for a period lasting from 2000 to 2010, present that 808 million people (i.e. equivalent to 11.7% of the world population) in 2010 faced catastrophic OOP payments, whereas the incidence of financial hardship or catastrophe due to the OOP spending increased from 2000 (9.7% of the world population) to 2010 for several developed (e.g., Argentina, Belgium, China, Czech Republic, Ireland, Poland, Russia, Spain, South Korea and Switzerland) and developing countries (e.g., Egypt, India, Indonesia, Moldova, Mongolia, Nepal, Niger, Nigeria, Philippines, Tunisia). Regression results of this recent study indicate that financial catastrophe due to OOP health expenditures is negatively associated with the share of domestic general government health expenditure (GGHE-D) that is provided through governmental or societal-based health insurance arrangements (Wagstaff et al., 2018: 173) . Further, OOP payments determination clearly depends on political choices to control governmental budgets, especially in periods of tight public finances focusing on fiscal rationalization (Grigorakis et al., 2018; Fan & Savedoff, 2014: 113; Cylus et al., 2012: 2204) .
2.2. Military Spending versus Public Health Expenditure Empirical Literature Framework
Numerous defence economics studies examine the impact of military expenditure on total and public expenditure on health by providing critical discussion regarding the fiscal rivalry of armaments versus socio-economic prosperity. Coutts et al. (Coutts et al., 2019) find an insignificant impact of increased military expenditure on public health financing by implying a tri-variate panel VAR model for 18 Middle East and North Africa (MENA) countries over a period from 1995 to 2011. Moreover, Biscione and Caruso (Biscione & Caruso, 2021) using a panel data of 26 transition economies for a period lasting from 1990 to 2015, show that the one-period lagged value of military spending to GDP has a statistically insignificant effect on current health expenditure (CHE), which also includes public health funding.
In contrast to the above-mentioned studies, there are researches suggesting a clear positive influence (i.e. complementary) of government budget allocations dedicated to military expenditure on public health funding. Interestingly, they confirm the Keynesian theory that armaments impulse economy (Lin et al., 2015; Kollias & Paleologou, 2011; Pieroni et al., 2008; Kollias et al., 2007; Atesoglu, 2002; Chletsos & Kollias, 1995) . Lin et al. (Lin et al., 2015) investigated the trade-off between military spending and public health expenditure for a sample of 29 OECD countries over the period 1988-2005. Their econometric findings present a significant positive contemporaneous impact of military spending on public healthcare expenditure for the OECD area. In the same line, Zhang et al. (Zhang et al., 2017) , by applying co-integration analysis with multi-country panel data concerning two examined periods (1998-2011 and 1993-2007) indicate that military spending yields a positive effect on social expenditures, including also government health funding, in developed economies (USA, Japan, Germany, the UK, France, Italy, Canada—the so-called G7 group of countries), while the impact is ambiguous in the selected group of emerging economies (i.e. Brazil, Russia, India, China, South Africa—the so-called BRICS).
In contradiction, a number of earlier empirical studies postulate that military spending appears responsible for rendering a crowding-out effect on total and public health expenditure (Ali, 2011; Ozsoy, 2002; Yildirim & Sezgin, 2002; Günlük-Senesen, 2002; Apostolakis, 1992; Scheetz, 1992; Deger, 1985; Peroff & Podolak-Warren, 1979; Dabelko & McCormick, 1977; Peroff, 1976; Russett, 1969) . Additionally, several studies suggest that a positive change of military expenditure takes place at the cost of public spending on health. As a result, the fiscal capacity of governments to promote this crucial social spending for their citizens’ welfare is limited, since armament raises induce a significant crowding-out effect on health spending (Elish et al., 2023; Adhikary & Khatun, 2018; Bhattacharjee & Mazumdar, 2018; Zhao et al., 2017; Eryigit et al., 2012) . As an illustration, Fan et al. (Fan et al., 2018) assess the relationship between health expenditure (public and total) and military spending. They use pooled cross-sectional data for 197 countries covering a period from 2000 to 2013 and elaborating simultaneous equation models to examine their linking. Their findings strongly support the crowding-out hypothesis, since the increased military burden reduces the fiscal capacity of governments to allocate valuable financial resources to state health funding. Relatively, the impact seems to be more intense for both the lower and middle-income economies. The results postulate that a 1% increase in military expenditure per capita corresponds to a 0.623% decline in public health funding per capita. The same results also emerged in the case that the proxy of the military expenditure is measured as a share of GDP rather than a log-transformed regressor. Specifically, it is additionally estimated that a 1% increment of military burden (percentage of GDP) is associated with a −0.630% decline in public health expenditure to GDP. A more recent study investigates whether military spending crowds-out public expenditure on health in 116 countries over a period lasting from 2000-2017, by also applying like our study, a GMM estimation (Ikegami & Wang, 2023) . Scholars show a significant crowding-out effect of military spending increases on domestic government health spending (GGHE-D) by taking into account the government fiscal capacity as the denominator for both the two examined variables, supporting in this way the evidence that military expenditure absorbs government financial resources from publicly funded health spending. Further, they find that the crowding-out effect is statistically more intense to middle and low-income countries in their samples.
3. Methodology
This section provides details of the data, the examined sample and variables we use in this study, as well the econometric methodology applied.
3.1. Data and Sample
All time series data employed in this study is obtained by applying publicly available official organizations’ databases. Particularly, OOP health expenditure statistics are obtained from the Global Health Expenditure Database (GHED)3 which is compiled by WHO (WHO, 2023) . In order to substantiate UHC objectives WHO’s GHED provides annual health expenditure statistics for the vast majority of countries worldwide available from 2000 to 2021 by applying the 2011 up-dated System of Health Accounts (SHA) standards (OECD et al., 2011) . Therefore, this study sample covers the period lasting from 2000 to 2021. Moreover, the annual military expenditure statistics are retrieved from the World Development Indicators (WDI) database of the World Bank (World Bank, 2023) and from an independent institutional entity, the Stockholm International Peace Research Institute (SIPRI). SIPRI’s database4 provides country-level annual data for military expenditure in various proxies for the majority of countries around the world available for the years 1949-2022, by taking into consideration the official national military spending reports by national governments (SIPRI, 2023). It is worth noting, that several World Bank’s military expenditure data is derived from SIPRI military statistics.
To sum up, this study dataset covers a period lasting from 2000 to 2021 for 29 countries of the 31 NATO members to empirically assess the impact of military expenditure on OOP healthcare spending. In order to ensure a balanced panel that includes the same time periods (T = 22) available for all the selected cross-settings (N = 29) we unavoidably exclude two countries. Specifically, we do not encompass Iceland and Montenegro in our analysis due to the non-availability of military expenditure statistics for several years in our time span to ensure no structural breaks in our sample (Younsi et al., 2016; Kollias & Paleologou, 2010; Pesaran & Smith, 1995) . Table 1 presents 29 NATO allies and one invitee country, Sweden5, which is under integration processing to join Alliance, and
![]()
Table 1. Selected NATO countries and summary statistics (2021).
Source: Authors’ elaboration based on WHO’s, World Bank’s and SIPRI’s databases (SIPRI, 2023; World Bank, 2023; WHO, 2023) .
summarizes statistics of the main examined variables.
It is clear to see, from Table 1, that there is considerable diversity among NATO allies. There are clearly three group of countries regarding their military burden to GDP. The first one which encompasses those allies that meet and some of them exceed the 2% target, the second one of those moving towards to the 2% benchmark and those which the Alliance expects to quickly meet it in the near future, but they still lag far away. Just six members manage to reach the Alliance’s target of spending 2% or more of national income on defence in 2021. Greece shows the highest share of military expenditure to GDP (3.86%) in 2021, followed for the same year by the United States (3.46%), Poland (2.22%) and United Kingdom (2.16%) far higher than the examined time span (2000-2021) NATO’s average 1.65%. Benelux, Nordic, Balkan and some Central-Eastern European allies present much lower military spending to GDP than the NATO’s military burden target (e.g., Belgium (1.05%), Finland (1.26%), Albania (1.22%), Germany (1.33%) and Czechia (1.38%)). The Luxembourgian military spending to GDP ranks last in our sample of NATO countries for 2021 and over the years (SIPRI, 2023; World Bank, 2023).
On the other hand, a close look at health expenditure statistics, reveal that the ratio of OOP payments to overall health spending is much higher than the WHO and UN 15% objective for the half of NATO allies. The reliance of overall health financing on OOP spending in Albania and North Macedonia reached in 2021 the extremely high 55.60% and 40.11% respectively. Subsequently, households in Bulgaria, Greece, Lithuania, Latvia, Hungary, Portugal spend a great deal of money on healthcare compared to NATO’s countries and considerable higher than the alliance average (almost 22%, 2000-2021) (WHO, 2023) . Descriptive statistics of the selected variables, for the time span 2000-2021, are presented in a more analytical way in Appendix Table A1.
3.2. Variables
We consider OOP expenditure as a share (%) of current health expenditure (CHE) as the dependent variable of our analysis, building on the work of previous empirical studies (Grigorakis et al., 2022; Grigorakis et al., 2018; Fan & Savedoff, 2014) . Furthermore, OOP expenditure to current spending on health is a suitable proxy indicator for measuring financial hardship. It is also widely used in the literature and closely monitored by WHO and World Bank, since it can provide useful evidence on progress towards UHC framework; financial safety-net against economic distress or catastrophic incidence of OOP medical spending as a core dimension of national health system performance assessment (Wagstaff et al., 2020; WHO, 2019; Yerramilli et al., 2018; WHO & World Bank, 2017; Xu et al., 2003) .
Additionally, we use military expenditure share (%) to GDP as the explanatory parameter in our analysis, since several empirical studies that investigate the crowd-out effect of armaments spending on health expenditures applied this regressor in their adopted methodology (indicatively cited, (Coutts et al., 2019; Fan et al., 2018; Zhang et al., 2017; Manamperi, 2016; Lin et al., 2015; Shmueli & Israeli, 2013; Hirnissa et al., 2009; Ozsoy, 2002) . Military expenditure to national income presents as a useful indicator to test whether national defence spending impedes the economic growth as an unproductive expenditure factor, which deducts valuable government budgets resources from social and welfare activities, including also state health financing allocations (Shieh et al., 2002) . Therefore, the assumption that has to be tested in this study is whether military expenditures for national defence may present as a one-way positive gun-butter trade-off adjuster of OOP expenditure since households OOP medical spending had been evinced by existing empirical studies to be negatively affected by general government expenditure and public health financing (Grigorakis et al., 2022; Grigorakis et al., 2018; Wagstaff et al., 2018; Fan & Savedoff, 2014; Xu et al., 2011) . Table 2 provides descriptions and the average values of the examined variables, as well it summarizes the secondary data sources applied for our sample period 2000-2021. In average terms, OOP health payments corresponds to 21.94% of CHE, while for the same period the average share of military expenditure to GDP is almost 1.65% for the NATO countries.
3.3. Econometric Methodology
In order to examine the effect of military expenditure on OOP healthcare payments for the NATO countries we apply a dynamic panel data estimation, since this econometric methodology has been elaborated in several previous studies related to the impact of several parameters on OOP spending (Grigorakis et al., 2022; Rana et al., 2020; Grigorakis et al., 2018; Younsi et al., 2016; Fan & Savedoff, 2014; Xu et al., 2011) . We apply the system Generalized Method of Moments (GMM) estimation in order to address fundamental econometric issues such as the persistence of the outcome estimated variable, heteroskedasticity, endogeneity and unobserved heterogeneity. This panel econometric estimator permits the utilization of the exogenous regressors in the form of instrumental variables and lagged values of the dependent variable to control the problem of endogeneity, providing in this way more consistent and unbiased estimates than the traditional static panel estimators such as the OLS, fixed or/and random effects models (Wooldridge, 2010; Roodman, 2006; Windmeijer, 2005; Cameron & Trivedi, 2005) . The system GMM specification, proposed by Blundell and Bond (Blundell & Bond, 1998) , deploys moment conditions by combining the lagged first-differences of the regressors which are used as instruments for the level estimator of Arellano and Bover (Arellano & Bover, 1995) in addition with the appropriate lagged levels of regressors as instruments in the first-difference model estimator of Arellano and Bond (Arellano & Bond, 1991; Baltagi, 2013; Xu et al., 2011) . However, dynamic panel methodology based on simplified approaches (i.e. ordinary least squares (OLS) specification depending on first differences) generates inconsistent fixed or random effect estimates, especially for a selected dataset where the time span is relatively small and root-mean-squared
![]()
Table 2. Description of selected dependent and explanatory variables and Descriptive Statistics (mean values for NATO countries, 2000-2021).
Source: Authors’ elaboration based on WHO’s, World Bank’s and SIPRI’s databases (SIPRI, 2023; World Bank, 2023; WHO, 2023) .
error (Blundell & Bond 1998; Nickell, 1981) . More specifically, when a panel data encompasses cross-sections relatively larger than the selected periods (i.e., T < N), panel system-GMM specification exonerates estimates subject to bias, in the case that the lagged outcome estimated variable coefficient and the explanatory regressors may be correlated with the composite error term
(Blundell & Bond, 1998; Arellano & Bover, 1995) . Therefore, the system GMM estimator provides more efficient and consistent estimates than the GMM first-difference estimation method, since the selected cross-setting dimension in this study is larger than the selected period (Blundell & Bond, 1998; Arellano & Bond, 1991) . The employment of instruments which are uncorrelated with the error term, as well the simultaneous combination of the regression in levels with the regression in differences absolve from measurement errors, omitted variables and endogeneity of the regressors, thus eliminating any dynamic panel bias (Roodman 2009; Blundell & Bond, 1998) . More specifically, for the purposes of this study a two-step GMM system is applied. It uses both levels with the first-difference for exempting issues of weak instruments of our regression in differences since the lagged outcome estimated variable and the explanatory one could be persistence over time. Moreover, the two-step GMM estimation yields more efficient estimates when heteroskedasticity, autocorrelation and unit root challenges arise (Roodman 2009; Windmeijer, 2005; Blundell & Bond, 1998) . Further, the GMM estimator approach is adopted, since it deploys both lagged levels and lagged differences of the regressors as instruments and controls for the dynamics of adjustment (Bun & Sarafidis, 2015; Baltagi, 2013; Hsiao, 2003) .
The following GMM dynamic specification model has been considered,
(1)
(2)
In Equation (1),
is the dependent variable i at time t, with
cross-sectional units and
indicates the time, c is the constant,
symbolizes the one-period lagged outcome estimated variable and δ depicts the speed of adjustment estimated. The regressors (i.e., explanatory parameters) in our analysis are represented by
, β is the estimated coefficient of the selected regressors, while
expressing the error of disturbance term consisting of two components (with
representing the unobserved cross-settings effects and
expressing the idiosyncratic error, assuming
—independently and identically normally distributed with a mean of zero and a defined variance—and independent of
). The military expenditure to national income is considered to be strictly exogenous (
for all N and T). The applied Granger-causality test (Granger, 1969) presents that it cannot be rejected the hypothesis that military spending as a share to national income does not Granger cause OOP healthcare financing, and vice versa, reflecting in such a way that Granger causality runs a two-way processing from OOP/CHE to Milex/GDP respectively (Dumitrescu & Hurlin, 2012) (see, Appendix Table A2).
Further, by including two additional period lags of the explanatory parameter in our elaborated equation, we test the dynamics of the military expenditure impact on OOP payments by also considering the effect of the previous armaments spending (i.e., two-period lagged values) on the current yearly OOP healthcare financing (Bontempi & Mammi, 2015: 1084-1086) . Since, the empirical literature advocates that any military spending raise to GDP primarily declines the available governments’ budgets resources for public health financing (Ikegami & Wang, 2023; Fan et al., 2018) , we aim to examine the previous years’ impact of military expenditure on OOP financing, as long as OOP healthcare payments are negatively associated to public health expenditure according to the health financing literature (Grigorakis & Galyfianakis, 2023) .
So, the applied two lagged values of the explanatory parameter are considered as a GMM style instrument for the level estimator model and an iv-style instrument for the first-difference estimator. The lagging of the military spending regressor by the two extra period lagged values addresses any potential reverse causality or simultaneity between the outcome estimated variable and the selected explanatory parameter in the elaborated econometric estimation (Roodman, 2009; Han & Phillips, 2006) . The applied panel data estimation equation in our study is symbolically expressed as follows by the Equation (3):
(3)
The econometric software package Eviews (Edition 10) had been used to perform the dynamic panel data analysis.
4. Empirical Results
4.1. Employed Econometric Specifications
To provide evidence as to the validity and soundness of our estimated regression findings, we consider crucial to elaborate and present several econometric diagnostic tests build on the work of previous empirical studies (Grigorakis et al., 2022; Rana et al., 2020; Fan & Savedoff, 2014; Xu et al., 2011) . Panel unit root tests with common and individual unit root process are applied based on four statistics values to check the stationarity in our panel dataset and avoid spurious regressions (i.e. Levin, Lin and Chu t* (LLC), Im, Pesaran and Shin (IPS), ADF—Fisher Chi-square and PP-Fisher Chi-square (Im et al., 2003; Levin et al., 2002; Choi, 2001; Maddala & Wu, 1999) . The results of the applied panel unit root tests exhibit that all the examined variables are significant stationary (i.e., I (0) ~1% or 5%) in level, indicating non-presence of common or individual unit root (see, Appendix Table A3).
Further, two additional diagnostic measures have been employed to evince for the outcomes soundness the applied GMM panel estimator. First, the J-Statistic, also reported in the literature as Sargan’s over-identification test, is employed (Sargan, 1958) to confirm if the over-identifying restrictions are correlated or not with the residuals (i.e., the instruments must not be correlated with the error term) (Arellano, 2002; Arellano & Bond, 1991) . The results of the J-statistic reported in Table 3 show that the instruments applied are valid to explain the elaborated panel data dynamic estimator (i.e., acceptance of Ho and high J-statistic p-value; both of them advocating for the valid instrumentation of the model) (Baltagi, 2013; Baum, 2006) . More specifically in our main elaborated econometric estimation, the J-statistic value is 25.151 and the Prob (J-Statistic) is 0.454, which indicates that the null hypothesis cannot be rejected, and hence the instruments are valid at any conventional significance level; the results do not provide evidence against the validity of our instruments-not correlated with the error term.
The second specification measure that has been employed to detect any possible auto-correlation presence in the residuals is the Arellano-Bond (1991) test for first-order AR (1) and second-order AR (2) serial correlation. The Arellano-Bond test assesses any violation of strict exogeneity due to the likely presence of serial auto-correlation between the covariates of both the estimated and explanatory variables and the idiosyncratic error in the employed regression (Windmeijer, 2005; Blundell & Bond, 1998; Hansen, 1982) . Furthermore, the Arellano-Bond autocorrelation tests, as well the robust estimates of the coefficient standard errors in our elaborated dynamic paned data estimations assume for no contemporaneous correlation in the idiosyncratic disturbances. Indeed, the Arellano-Bond statistics for AR (1) and AR (2) suggest the robustness of the applied panel data methodology, since the null hypothesis of no second-order auto-correlation failed to be rejected (see, the p-value of AR (2) in Table 3), exhibiting in this way that the model error term is serial no-correlated in levels and it is not necessary to employ deeper lags as instruments in our employed econometric estimator.
4.2. Econometric Results
The findings illustrate a statistically insignificant effect of military spending as a share to GDP to the current year on OOP healthcare financing, while the share of military spending to GDP on the previous two years has a significant positive impact on the outcome estimated variable. From Table 3 (see, Column 1), it is apparent that military expenditure to GDP exhibits a statistically significant positive effect on OOP spending as a share of total financing on health for the NATO countries, taking into consideration in our estimations the applied two lagged values of the explanatory parameter. Thus, it is soundlessly validated in this way our research hypothesis that any armaments spending increase presents as a positive adjuster for scaling up households OOP expenses for necessary healthcare over the time (Grigorakis & Galyfianakis, 2023) . Analytically, the magnitude of this impact is evident where a 1% increase of military expenditure to GDP is associated with two positive variations (0.609% and 0.423%) on OOP financed healthcare spending on overall health financing on the previous two years respectively. Previous empirical health financing studies, using similar econometric panel estimations, indicate that any decrease of OOP payments share to overall health expenditure majorly depends on the governmental fiscal space to allocate more budgetary resources on national health systems (Grigorakis et al., 2022; Grigorakis et al., 2018; Fan & Savedoff, 2014; Xu et al., 2011) .
Therefore, our econometric estimations in an indirectly empirical way validate several defence economics studies that support the existence of a crowding-out impact of military expenditure on public health expenditure (indicatively cited, Ikegami & Wang, 2023; Fan et al., 2018; Zhao et al., 2017; Eryigit et al., 2012 ). For instance, Fan et al. (Fan et al., 2018: 773) , who use like us the same explanatory proxy, estimate that a 1% increase in the share of military expenditures in GDP corresponds to a 0.63% decrease in the share of publicly financed health expenditures to national income for 197 countries from 2000 to 2013. The estimates which support the view that armament expenditure crowds-out public financing on health very aptly advocate for an intense rivalry for available public finances resources between warfare and welfare components of general government consumption in a given budgetary period (Agostino et al., 2017) . Thus, conceptually build both on defence economics and health financing empirical literature, the econometric findings of this study strongly display that any defence-warfare expenditure increases to GDP demand more state budgetary available funds that could be allocated on public expenditure on health, resulting in this way to increased levels of OOP healthcare financing to CHE for NATO countries governmental and health insurance systems.
Additionally, the econometric results show a significantly positive estimated coefficient of the lagged dependent variable, presenting that OOP expenditure to overall health financing for the NATO alliance has a strong persistence. As displayed in Table 3, the outcome examined variable positively responses to the lagged dependent one similarly with the estimation reports of previous empirical work (Grigorakis et al., 2022) . The severe health financing policies (e.g., higher rates of statutory insured cost sharing) for compressing government health budgets when it is fiscal necessary result in a positive effect of previous year OOP payments levels on current year OOP spending (Grigorakis et al., 2018) .
4.3. Robustness Checks
We undertake plenty of robustness checks to provide solid evidence of whether the positive impact of military expenditure on OOP healthcare payments that is exhibited in the initial main applied estimation is valid to changes in the econometric specification (see, Columns 2 - 7 in Table 3). In addition, apart of military expenditure as a share to GDP, we incorporate alternative control parameters as
Table 3. Regressions for OOP expenditures as a share (%) of CHE (2000-2021).
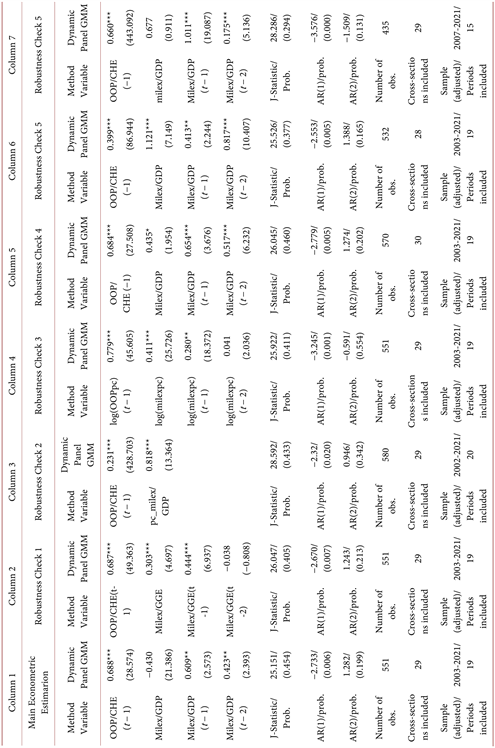
Notes: 1. The values in parentheses correspond to t-Statistic. 2. The Sargan (J-Statistic) over identification test the validity of the instruments used with the null as significant. 3. AB AR (1) provides the diagnostic test for the first-order auto-correlation in the differenced residuals and is distributed as N (0, 1) under the Null Hypothesis of no first-order autocorrelation. Similarly, AB AR (2) renders the test for second-order autocorrelation in the differenced residuals and is distributed as N (0, 1) under the null hypothesis of no second-order auto-correlation. 4. ***Significant at 1%; **Significant at 5%; *Significant at 10%.
described below to measure the size of military spending in order to test the robustness of our econometric specifications. Thus, following similar studies, we replace in our initial econometric approach military expenditure to GDP with the indicator military expenditure as a share of general government expenditure (GGE) to test whether the governmental fiscal space for armaments spending can differently influence OOP healthcare payments (Grigorakis & Galyfianakis, 2023; Ikegami & Wang, 2023; Töngür & Elveren, 2015) . It is considered crucial to mention that the GGE does not include governmental military spending, which is a part of government capital formation (World Bank, 2023) . Our econometric findings do not exhibit any qualitative change (Column 2). Secondly, we also set up as a regressor in our econometric modeling the growth rate of military expenditure to GDP instead of just a percentage quotient to examine any qualitative difference (Yildirim & Sezgin, 2002) . Similarly, the econometric results are not qualitatively changed (Column 3). In a further step, we re-consider our econometric specification by replacing OOP payments to CHE and military expenditure to GDP with their weighted averages respectively, adjusted for (PPP) and expressed in current US dollars per capita in a natural logarithmic form (Fan et al., 2018) . Our econometric results qualitatively remain the same (Column 4). Further, we include in our cross-settings Sweden due to their willingness to join NATO based on the alliance accession procedures took place in July 2022 at the Spanish capital (NATO, 2023). Even including the upcoming NATO membership, our findings are not qualitatively changed (Column 5). Additionally, in order to check the influence of potential outliers, we exclude Greece from the main econometric model; its military expenditure to GDP (i.e., defence burden) is over the years considerable and much higher than the NATO average (SIPRI, 2023) . We also find not qualitative change (Column 6). Finally, we investigate whether our results remain qualitatively the same when transforming the initial time span in order to control for any “period effect”. Specifically, we re-estimate our GMM model by considering the time span from 2007 to 2021 in order to capture any potential effect of the 2007 Great Recession and its aftermath (i.e., the declining proportions of fiscal resources devoted to armaments) on our econometric estimations. The results again do not substantively change (Column 7). In sum, our econometric findings hold across both our dependent (i.e., as share of CHE, per capita) and explanatory variable (i.e., as share of GDP, annual rate change, as a fraction of GGE,), and are robust to the application of alternative and different estimations of the model (i.e., time span, exclusion of outliers).
5. Conclusion
The main objective of this work is to investigate the effect of military expenditures on OOP payments for the NATO members. We elaborate a dynamic panel data methodology by using a dataset that encompasses pooled cross-sectional data of 29 NATO countries from 2000 to 2021. This study intends to fill the gap in the existing literature by testing for the first time the impact of the defence expenditure burden on OOP healthcare payments for the NATO group of countries. Further, the study aims to contribute to the existing health financing and defence economics empirical evidence by re-examining the indirect trade-off effect of military spending to national income on OOP healthcare payments (Grigorakis & Galyfianakis, 2023) . Prior studies only investigate the direct budgetary trade-off between military and public health expenditures built on the “guns” vs. “butter” argument (indicatively cited, Ikegami & Wang, 2023; Fan et al., 2018; Zhao et al., 2017; Apostolakis, 1992; Russett, 1969 ).
Our findings in an indirectly way exhibit that military expenditure renders a crowding-out effect on public expenditure on health (Fan et al., 2018) . Our study in support of the “guns” vs. “butter” argument indicates that any raise of military spending negatively influences public budgetary resources for healthcare. Armaments spending is a social costly key budgetary expenditure that renders a negative effect on national health systems efficiency against the financial uncertainty or hardship owing to OOP health expenses.
Military spending detracts valuable fiscal space from governmental budgets causing less public expenditure for welfare spending, including also state health funding (indicatively cited, Fan et al., 2018; Zhao et al., 2017; Eryigit et al., 2012 ). Dedicating valuable fiscal resources to increase arsenals dynamics in order to meet the demands of a strategic-military organization, instead of allocating them to strengthen public health financing would cause adverse consequences on the effectiveness of health systems against households’ financial distress owing to OOP healthcare payments. The crowding-out hypothesis is supported by the positive effect of defence expenditure burden on OOP payments based on our study findings, totally reflecting that any given boosting of military spending crowds-out public health budgets, since public health expenditure retrenchments have a positive impact on OOP healthcare spending according to the health financing literature (Grigorakis et al., 2022; Xu et al., 2011) .
The Russian invasion in Ukraine and the prolonged war conflict in the Eastern borders of Europe have massively induced the majority of European parliaments to abandon their over the decades post to the World War II parsimonious policies for armaments. Several European countries have decided to reverse the former shrinking climate of military spending in order to exceed the NATO’s 2% defence burden benchmark and obtain better deterrent power against a “hostile and unpredictable” Russia. With no doubt, a powerful national defence against any external threat which covets the national sovereignty of a country, displays as the most important national necessity. Nevertheless, bigger armaments for obtaining military readiness and engagement limit the available fiscal space for strengthening financial protection against OOP healthcare payments as the Universal Health Coverage agenda imposes. Since our study findings indirectly advocate in favor of the hypothesis that military expenditure tends to crowd-out public spending on health, NATO governments have to re-consider their generous decisions on irrational arsenal increases and prioritize state health financing on their fiscal planning.
On the foreground of a constantly volatile economic environment due to the COVID-19 pandemic, energy crisis, rampant inflation-cost living crisis challenges and current war situation (i.e., both the Russian-Ukrainian and Israel-Palestine ongoing war conflicts), policy-makers should re-adjust their fiscal priorities and seriously consider for any potential negative footprint of military expenditure increases on UHC objectives; citizens’ accessibility on healthcare facilities without a financial hardship. NATO’s members in order to lower the reliance of their national and health insurance systems on OOP healthcare payments should provide an unwillingness to cut from public health budgets in favor of an excessive military expenditure race.
Further analysis of the impact of military spending on both public and private healthcare financing should be incorporated for several other groups of countries in order to assess this relationship for overall health funding, since defence expenditures emerge as a considerable catalyst to render a crowding-out or growth-stimulating effect to several aspects of governmental spending. Regarding recommendations for future research, since our study focuses on merely NATO’s members, it should be interesting to investigate the impact of military spending on OOP payments for other strategic alliances or coalitions worldwide (i.e., EU, OECD, BRICS, MENA) in order to provide recommendations to policy-makers for their fiscal decisions and political priorities.
Appendices
![]()
Table A2. Pairwise granger causality tests.
NOTES
1CHE expresses the sum of all outlays for citizens’ health status maintenance, restoration or enhancement paid for in cash or supplied in kind during a year, but not including capital formation in health (investments and intermediate health consumption; capital expenditure (HK) as a share (%) of GDP). CHE encompasses the General Government Expenditure (Government, Compulsory Contributory and Medical Saving Accounts Schemes), Private Expenditure (Voluntary Health Insurance and OOP expenditure financing) and External financial aid on health. The three aforementioned health financing components (public, private and external) correspond to 100% of CHE (overall health financing) (WHO, 2023) .
2The ¨iron curtain¨ term explains the political metaphor that had been used in a public speech by the Winston Churchill in 1946 to describe the political boundary dividing Europe into two separate camps, the Soviet (i.e., USSR and Eastern-Central European Satellite States) vs. Western (i.e., former Allies and independent European countries) influence, since the end of World War II in 1945 to the end of Cold War in 1991. Further, it also symbolizes any military, political and ideological effort was made by the USSR to prevent itself and its dependent eastern and central European states from the open contact with the rest Western World (West and non-communist-controlled areas) (Eckert, 2019) .
3GHED provides national health expenditures data for over 190 countries available from 2000 to 2021 in order to support the main goals of Universal Health Coverage conceptualization. WHO’s GHE database uses, since 2017, a common accounting reference for the Health Financing (HF) classification based on the up-dated 2011 System of Health Accounts (SHA) framework (WHO, 2023; OECD et al., 2011) .
4SIPRI’s data currently provides military expenditure statistics, in various proxies (variables), for 174 countries from 1949-2022, by reflecting the official national defence and military spending as reported by national governments (SIPRI, 2023) .
5Sweden had submitted its official letter of application on 18 May 2022 to join NATO Alliance. On 5th of July 2022, one day later the NATO’s Madrid Summit, the Organization signed the Accession Protocols for Sweden, which officially became a NATO Invitee country. Sweden will become a full NATO member since its Accession Protocol will be ratified by the all the NATO member countries.