Does Internet Access Mitigate the Impact of COVID-19 on School Re-Enrollment Rates? Evidence from Mexico ()
1. Introduction
What if an entire generation of students in the public education sector faced long-term consequences as a result of a two-year pandemic? The onset of COVID-19 has affected all areas of society, including education. According to the United Nations Educational Scientific and Cultural Organization (UNESCO, 2020a; UNESCO, 2020b) , nearly 1.6 billion students in over 190 countries had their face-to-face education interrupted.
The impact of COVID-19 on education around the world has been multifaceted, with various countries implementing different strategies to address the challenges posed by the pandemic (Reimers & Schleicher, 2020) . The Organisation for Economic Cooperation and Development [OECD] (2020) provides valuable insights into how COVID-19 has impacted education. In Spain, students enrolled in “Second Chance Schools” received personalized support through telephone follow-ups, which addressed not only their academic needs but also their health and personal concerns. In England and Wales, schools remained open to provide support for vulnerable children and young people, especially those in the care of the social system or identified as vulnerable by educational institutions and local authorities. In Germany, the implementation of “transition coaches”, also referred to as social pedagogues, ensured that students received essential support to prevent disengagement and dropout. These coaches adapted their services to provide guidance over the phone during the pandemic. These examples demonstrate the variety of global strategies used to minimize the impact of COVID-19 on education. Latin American and Caribbean countries, on the other hand, faced extensive and prolonged suspension of in-person classes, affecting approximately 150 million students and leading to significant academic and social difficulties in this region (Huepe et al., 2023) .
The closure of educational institutions during the peak of the pandemic and its resulting consequences were essential factors in this closure. According to Vincent-Lancrin et al. (2022) , the COVID-19 pandemic caused significant disruptions to in-person instruction in schools and universities, resulting in limited opportunities for students to participate in traditional forms of learning. These authors highlight that, while many schools and educational institutions made efforts to implement alternative learning arrangements to ensure the continuity of education during periods when in-person instruction was not possible, the effectiveness of these measures varied greatly. Additionally, these arrangements had varying degrees of success in reaching students from different social backgrounds. Students from affluent backgrounds typically have better access to the technology and resources needed for online learning, while students from disadvantaged backgrounds face greater challenges in accessing and benefiting from remote learning opportunities (Vincent-Lancrin et al., 2022) .
There is a growing body of literature on the unequal impact of COVID-19, especially on individuals from different socioeconomic status backgrounds (Zhai et al., 2021) . A notable study by Tomaszewski et al. (2022) examined the unequal effects of COVID-19 on the attendance rates of secondary school students in Australia from various socioeconomic backgrounds. According to Tomaszewski et al. (2022) , individuals with lower socioeconomic status had lower attendance rates during the pandemic. The authors acknowledge that there is a lack of research on the impact of COVID-19 on outcomes beyond academic achievement, such as attendance, retention, or completion. This is especially true in developing countries like Mexico.
One potential way in which socioeconomic status affects education is through limited internet access in lower-income households. Access to internet services became essential during the pandemic with the suspension of face-to-face education. Teachers and students utilized online resources as an alternative method for conducting class sessions and exchanging assignments and/or feedback. The unequal impact on individuals with limited internet access is significant. Previous research in different contexts has demonstrated that households with internet access have a higher re-enrollment rate compared to those without (Fairlie, 2005; Cristia et al., 2014) .
The study by Huepe et al. (2023) highlights the significant disparities in internet access in Latin America and the Caribbean. It is important to acknowledge that when schools closed, a significant number of children, adolescents, and young people in 13 Latin American countries, around 33%, did not have internet access in their households.
These disparities extend further, with variations in internet access based on both country and socioeconomic status. In the lowest income quintile, only 53% had access compared to 93% in the highest income quintile (Huepe et al., 2023) . Additionally, internet access was even lower for rural households. The quality of household internet connections in the region is below international standards, resulting in slower speeds compared to more technologically advanced nations (OECD, 2020) .
Understanding the disparities in internet access is crucial, particularly when considering the potential impact of the COVID-19 pandemic on student re-enrollment and their ability to acquire knowledge. This is particularly important for the re-enrollment rates of Primary and Secondary students. Difficulty in maintaining basic cognitive skills over an extended period can increase the likelihood of school dropouts in the 6 - 14-year-old age group. According to García (2020) , the closure of educational institutions in Latin America and the Caribbean resulted in widespread disengagement and, in some cases, school dropouts. García’s report for UNICEF warned about this disruption from the beginning.
Our study examines the impact of internet access on re-enrollment rates in the Mexican educational system during extended school closures caused by COVID-19. The literature on this topic is limited, making our research crucial in understanding the potential role of internet access in mitigating the consequences of school closures.
This led us to investigate whether internet access helped lessen the impact of COVID-19 on school re-enrollment rates. We examined re-enrollment, internet connectivity, and school closures data in Mexico’s 2446 municipalities from 2013-2022, and analyzed their interactions using regression analysis.
We hypothesized that states with longer school closures would have lower re-enrollment rates within their municipalities. Prolonged closures were expected to negatively impact re-enrollment. However, we expected that the impact of extended school closures on re-enrollment would be lessened in municipalities with better internet connectivity.
2. Mexico as a Case Study. Theoretical Motivation
Mexico is a good case study due to its territorial dimensions, the diversity in demographic distribution, the difference in access rates to connectivity services in its regions, and the unitary system on which its educational system is based. This means that, in the educational field, operational decisions are national and homogeneous. It was, exclusively during the pandemic, that Mexico’s federalism gave flexibility to the states in making decisions about reopening schools based on the registered cases of Sars Cov2 contagion. On the other hand, as mentioned above, Mexico did not even resort to online classes for young children, who experienced a complete interruption of formal education and whose learning relied fully on their own access to materials. This access, however, was directly linked to connectivity, since communication with teachers and receipt of study materials was done through applications such as WhatsApp or through social networks (Carrazco Zendejas, 2021) . We believe that, in socio-educational conditions such as those in Mexico, it is pertinent and essential to investigate the relationship between the dynamics imposed by the pandemic on educational continuity and the implications of changes in the re-enrollment rates of school-age children.
We also focused on Mexico for two reasons. First, there is a lack of research on this topic specifically in the Mexican context. Secondly, the way in which Mexico dealt with the closure of schools and in-person education differs from that of other Latin American countries.
Mexican public primary schools did not use the now widely-known synchronized online classes. Instead, children had to learn through the medium of television with a program called “Aprende en Casa II”, or “Learn from Home II” (Gobierno de México, 2020) . The relationship between teachers and students was strongly modified. The role of teachers was limited to sharing tasks through WhatsApp group chats. This meant that the students received no direct instruction from their teachers, doing most of the learning by themselves in their own time. The Mexican government did not provide free Internet, so students were left at the mercy of the level of access and type of Internet service they had at home.
There were many obstacles to remote educational solutions during the pandemic (UNESCO, 2020a) , including in Mexico. Many homes do not have desktop computers, only some mobile devices, and households had little or no fixed connectivity, generally depending on the “airtime” purchase system by using their phone network provider (Instituto Nacional de Estadística, Geografía e Informática [INEGI], 2020a) . From an educational perspective, Mexican teachers were poorly prepared for online teaching, much less for adapting activities and curricular approach to digital media (Reimers & Schleicher, 2020) .
This is particularly troubling in the case of Mexican public primary schools, where active, synchronized online classes did not take place. As above mentioned, Children had to receive their education via television using a program known as “Aprende en Casa II”, which translates to “Learn from Home II” (Gobierno de México, 2020) . The aim of this strategy was to act as support material for professors in all regions of the country. The national educational agencies also signed an agreement with Google for Education to allow access to a dedicated website, as well as individual email accounts for basic-level educational actors to facilitate the distribution of digital educational materials aligned with the official curriculum (Gobierno de México, 2020) .
However, the Mexican government did not provide free Internet, leaving students dependent on the quality and availability of the internet service they had in their homes. Internet connectivity and access were two of the named obstacles for learning in Mexico during the pandemic (Instituto Nacional de Estadística, Geografía e Informática (INEGI), 2021a) . This lack of access to the internet did not allow students to utilize one of the main features provided by Google for Education—connecting with their teachers in synchronized online classes. Thus, the Ministry of Education left schools and teachers to determine the exact way classes would happen (Castedo, Dávalos, Möller, & Soto, 2022) . The guiding principle of the national education authority was that schools and teachers had a better idea of how to organize their communities than the federal government in this scenario.
The relationship between teachers and students was strongly modified. The role of teachers was limited to sharing tasks through WhatsApp group chats. This meant that the students received no direct instruction from their teachers, doing most of the learning by themselves in their own time (Fuentes Cardona, 2022) . This method of teaching lacks a fundamental aspect of formal learning: interaction with a teaching specialist, and so can lead to hindered learning (Whitehurst & Lonigan, 1998) .
This was also true in a survey applied in Mexico by a public agency in charge of coordinating the National System for the Continuous Improvement of Education (Comisión Nacional para la Mejora Continua de la Educación, 2020) . In June 2020, this agency surveyed Mexican teachers, principals, students, and families about how they were dealing with the educational response by the government and the local educational authorities. The survey sample design could not be probabilistic due to the public health restrictions, but, due to a public call for participation, the response rate was high. Nearly 194,000 persons from all over the country responded to their electronic survey, with almost: 15,035 school principals; 71,419 teachers; 72,305 parents; and 34,990 students. The information collected from parents showed that they and their children experienced a lack of support from teachers, a lack of clarity in the instructional activities and very limited or poor-quality feedback for their children in academic activities. These perceptions led to a drastic change in the re-enrollment and dropout. According to INEGI (2021b) , at the beginning of the 2019-2020 school year, 33.6 million people between the ages of 3 and 29 were enrolled (62.0% of the total). Of these, 740,000 (2.2%) did not complete the school year: 58.9% due to reasons associated with the lack of resources to pay for airtime services and 8.9% due to the perception of low educational quality in remote education mediated by WhatsApp.
INEGI (2021b) also reported that student re-enrollment dropped in the following school year. Regarding the reasons associated with COVID-19 in the school year (2020-2021), 26.6% of parents considered that distance classes are not very functional for learning; 25.3% of the teachers indicated that one of the parents or guardians lost their job and could not pay for connectivity. While this data is revealing in terms of the impact of educational responses to COVID-19, the data provided is not broken down by region or community-type criteria.
Moreover, although there is research showing the negative effects of the pandemic on aspects like academic achievement and learning (Angrist et al., 2021) , there are very few studies of its impact on attendance, re-enrollment and retention. During the preparation of this study, we only identified one study focused on re-enrollment at the district level in Massachusetts, America (Dee & Murphy, 2021) and one at the state level in Ohio (Chatterji & Li, 2021) . The results of both studies agree with the decline in re-enrollment being significantly larger in districts with higher concentrations of economically disadvantaged students.
Similarly, UNESCO (2020c) reported that one of the most recurring causes of child dropout was poor access to connectivity. This institution emphasized that the risk of disengagement could increase if students who were already in low re-enrollment areas fell behind due to a lack of connectivity for lengthy periods of time.
This might be the case, not only in Mexico, but beyond, as numerous studies have also shown that the difference in access to internet during COVID-19 has had a great impact on different communities, with those with less access to the internet facing greater difficulties during the pandemic (Eze et al., 2021) . For example, a study by (Lai & Widmar, 2021) found a negative correlation between rurality and Internet speed, which emphasized the struggle for rural areas and to achieve equitable educational access. Similarly, Means and Neisler (2021) carried out a survey with over 1000 U.S. undergraduates, who reported much lower course satisfaction levels after courses moved online, as well as several obstacles to their continued learning. Another study that lends support to this is the analysis of the COVID-19 Lockdown-Challenges to Higher Education carried out by Harsha and Bai (2020) , which recognized the challenges of digital and online learning, particularly for those in “rural and backward areas”.
Overall, the available literature shows the possibility of alarming effects of a decrease in re-enrollment rates. The impact of a notable decrease in re-enrollment rates has several implications, not only on the immediate effects on education, but also on the long-term acquisition of relevant knowledge and prosocial skills, as presented by several studies (Rodríguez et al., 2016; Espíndola & León, 2002; Cliburn & Bohanon, 2020) . There is still a need for studies that focus on aspects related to re-enrollment or dropout with a country vision that considers the population diversity of its regions and the dynamics of its educational system. Specifically, we believe that the implications of the changes in re-enrollment rates of school-age children are something that should be investigated.
The existing literature and studies presented above lead us to the following hypotheses. Firstly, in Mexico, States with longer school closures will also be the States with the lowest re-re-enrollment rates in their municipalities (school closures will have a negative effect on re-re-enrollment). Second, municipalities with higher internet connectivity will have higher re-enrollment rates than those with lower internet connectivity. The opposite will be true—municipalities with lower internet connectivity will have lower re-enrollment rates than those with higher internet connectivity. Taking these first two hypotheses into account, we present our third and main hypothesis to answer the research question—the effect of longer school closures will be less pronounced in municipalities with higher internet connectivity.
3. Research Design
We created a municipality-level dataset covering the years 2013 to 2022 and used regressions to examine the relationship between our main independent and dependent variables. However, it is important to note that not every variable has data for every year in this range.
3.1. Variables
Our independent variables were as follows: 1) number of days missed from school and 2) internet connectivity (in percentage rates based on the population) in each municipality. The dependent variable we measured was the re-enrollment rate in primary schools per municipality, also based on the population. There are some covariates we controlled for (see 6.1 for details) such as wealth and population.
3.2. Sample
We looked at 2446 municipalities (every municipality in Mexico), from 2013 to 2022. We focused on this timeframe because public internet connectivity access data became available from 2013 onwards, and COVID-19 school closures took place between 2020 and 2022, with 2022 being the most recent year we have data for. This time frame allows us to take a look at the historical interaction between school closures and re-enrollment rates or between internet access and re-enrollment rates, to better comprehend the changes in this interaction in the COVID-19 context.
3.3. Data
The data from this sample is collected through the database Data Mexico and other various datasets from the Gobierno de Mexico official database website, as well as CONEVAL, the National Council for the Evaluation of Social Development Policy. Data used in this study:
• Number of weeks missed from school per state (which would affect all of the state’s municipalities) during the pandemic period 2020-2022. The variance in weeks missed from school is due to the government implementing a “stoplight” method, which was updated each month, allowing states deemed as “green” or “yellow” (low risk) to continue in-person schooling, while “red” (high risk) states were banned from doing so, and “orange” (medium risk) states were advised not to continue in-person schooling (Gobierno de México, a) . The risk was determined by the rate of spread of COVID-19 cases per state each month. This method of choosing which States and municipalities could carry out in-person schooling is important for our design because we can quantify the percentage of weeks in a school year each State was forced to stop in-person schooling and see if there is a relationship between these percentages and re-enrollment rates. It is important to say that since 2008, the Mexican educational system has imposed the same school calendar for all schools and students in the country. This single calendar was maintained during the pandemic, what was modified was the (non) authorization to attend school in person during 2020-2022. The “stoplight” method described above was the decision to authorize the use of school buildings and facilities or to keep students at home.
• Re-enrollment rates per municipality from the 2001-2002 academic year until 2022-2023, available through the Gobierno de México (b) official database (Sistema Interactivo de Consulta de Estadística Educativa).
• Internet connectivity since 2013 as a percentage of the population with access (through contracts) per municipality in Mexico through the Banco de Información de Telecomunicaciones, Instituto Federal de Telecomunicaciones (Banco de Información de Telecomunicaciones, Instituto Federal de Telecomunicaciones) .
• GINI (a summary measure of income inequality) and Income Rate data, gathered from the National Council for the Evaluation of Social Development Policy from 2020 (El Consejo Nacional de Evaluación de la Política de Desarrollo Social (CONEVAL)) ., El Consejo Nacional de Evaluación de la Política de Desarrollo Social (CONEVAL).). This data is useful to find out if there is a relation between missing values or any of our other variables and low GINI and Income Rates, which could help further explain the results. This is also a way to control for economic covariates.
3.4. Methodology
The methodology used for the analysis of the data and the establishment of relationships between them followed the following steps.
• Applying interaction regressions between school closures, re-enrollment rates and connectivity rates. We ran interaction regressions to see whether Covid-driven school closures are positively correlated with post-Covid re-enrollment rates on their own (Hypothesis 1) to find the relationship between internet connectivity and re-enrollment (Hypothesis 2) during that period (historically), and finally to find the interaction between school closures and internet connectivity on re-enrollment (Hypothesis 3).
• Measuring re-re-enrollment rates. We used the lag in students from one year to another—that is, for example, the difference in enrolled students from 2021 and 2020. By doing this, we looked at the percentage of students that actually re-enrolled in the next year, as opposed to just raw re-enrollment rates per year. By taking into consideration every municipality we have data for, these re-enrollment rates encompass even the students who might have switched schools.
• Applying run interaction regressions to GINI. We included GINI (a summary measure of income inequality) and Income Rate data, gathered from the National Council for the Evaluation of Social Development Policy (CONEVAL) from 2020, which is the most recent year available. We did this to find if there is a relation between missing values or any of our other variables and low GINI and Income Rates, which could help further explain the results. This is also a way to control economic covariates.
• Framing the context. We also carried out some descriptive work to show the historical relationship between this data, such as the variation in internet connectivity over time, school closures, and the historical relationship between internet and re-enrollment rates, including in the pre-Covid period.
4. Results
4.1. Statistical Results
4.1.1. Analysis
Table 1 presents the results of a regression analysis with Primary re-enrollment Rates as the dependent variable and several independent variables. The first column of the table lists the independent variables (Weeks Off School, Income Rates, GINI, Connectivity Rates, and Connectivity X Weeks Off School) and the subsequent columns report the coefficients and standard errors of each independent variable in separate regression models. The table also reports the number of observations, R-squared, adjusted R-squared, residual standard error, and F-statistic for each model. From the results presented by Table 1, we can see that only Income Rates and Connectivity Rates are statistically significant predictors of Primary re-enrollment Rates. Weeks Off School is significant only in the fourth model, and its coefficient has a negative sign. The interaction term Connectivity X Weeks Off School is not statistically significant in predicting Primary re-enrollment Rates. The constant term is statistically significant in all models except for the first model. The adjusted R-squared ranges from 0.0003 to 0.041,
![]()
Table 1. Regression analysis: primary re-enrollment rates.
Note: *p < 0.1; **p < 0.05; ***p < 0.01.
indicating that the models explain only a small proportion of the variation in Primary re-enrollment Rates. The F-statistic is statistically significant in all models except for the first model.
Table 2 presents the results of a regression analysis with the dependent variable “Secondary” and five independent variables: Weeks Off School, Income Rates, GINI, Connectivity Rates, and Connectivity X Weeks Off School. The table reports the regression coefficients, their standard errors, and their statistical significance levels based on the t-tests. The table also reports the number of observations, the R-squared, and the F-statistic of the regression.
Table 2 suggests a few things. Firstly, that Weeks Off School has a negative and statistically significant effect on the dependent variable, with a coefficient of −0.002 and a p-value of less than 0.01, meaning that an increase in weeks off school is associated with a decrease in the dependent variable. Moreover, Income Rates have a positive and statistically significant effect on the dependent variable, with a coefficient of 0.415 and a p-value of less than 0.01, meaning that an increase in income rates is associated with an increase in the dependent variable. Additionally, GINI has a negative and statistically significant effect on the dependent variable, with a coefficient of −0.638 and a p-value of less than 0.01, meaning that an increase in GINI is associated with a decrease in the dependent
![]()
Table 2. Regression analysis: secondary re-enrollment rates.
Note: *p < 0.1; **p < 0.05; ***p < 0.01.
variable. Connectivity Rates and Connectivity X Weeks Off School do not have statistically significant effects on the dependent variable, as their coefficients are not significantly different from zero at conventional levels of significance. While the F-statistics are statistically significant in all specifications, suggesting that the regression models as a whole are statistically significant, the R-squared and adjusted R-squared are relatively low in all specifications, suggesting that the independent variables explain only a small portion of the variation in the dependent variable.
Comparing Table 1 and Table 2 (thus comparing the effect between Primary and Secondary school), we find that the magnitude and significance of the coefficients differs, indicating that the variables have different effects on primary and secondary re-enrollment rates. For instance, weeks off school is positively associated with primary re-enrollment rates but negatively associated with secondary re-enrollment rates. The income rates variable has a strong positive effect on primary re-enrollment rates but is not significant for secondary re-enrollment rates. The GINI coefficient is insignificant for both primary and secondary re-enrollment rates. Finally, the connectivity variable has a significant negative effect on secondary re-enrollment rates but is not significant for primary re-enrollment rates.
4.1.2. Historical Analysis
To provide context, we conducted descriptive analysis that highlights the historical correlation between different data points, such as changes in internet access over time through Connectivity Rates or in school re-enrollment prior to the Covid pandemic.
Table 3 shows the results of a linear regression analysis with “Primary re-enrollment Rates” as the dependent variable and “Years” as the independent variable. The coefficient for “Years” is −0.018, which means that for each additional year, the primary re-enrollment rate decreases by 0.018 units. However, the coefficient is not statistically significant as the p-value is greater than 0.1. The constant term is 41.031, which represents the predicted primary re-enrollment rate when Years is equal to zero. The R-squared and adjusted R-squared values are very low, suggesting that the model does not explain much of the variation in primary re-enrollment rates. The F-statistic is not statistically significant, indicating that the model is not statistically significant.
Table 4 provides the results of a statistical analysis examining the relationship between years and secondary re-enrollment rates. The dependent variable is the secondary re-enrollment rate. The results of Table 4 show that the coefficient for years is −0.041 with a standard error of 0.005. This suggests that there is a statistically significant negative relationship between years and secondary re-enrollment rates. In other words, as years increase, secondary re-enrollment rates decrease. The constant term is 84.116 with a standard error of 9.384. Table 4 has an R-squared value of 0.006, which indicates that only a small proportion of the variation in secondary re-enrollment rates can be explained by the “Years” variable. The F-statistic of 77.841 is highly significant (p is less than 0.01), indicating that the regression model is a good fit for the data. The residual standard error of 1.166 indicates that the model has a good fit to the data.
Table 5 presents the results of a regression analysis where the dependent variable is “Connectivity Rates” and the independent variable is “Years”. The regression coefficient for “Years” is 0.363, and it is statistically significant at the 1% level (p-value is less than 0.01). This suggests that as time passes, connectivity rates increase significantly. The constant term is negative and statistically significant. The R-squared value is 0.023, indicating that the model explains only a small portion of the variation in connectivity rates, while the adjusted R-squared is also 0.023, which means that adding the independent variable to the model does not significantly improve the model’s goodness of fit. Finally, the F-statistic is 246.021, indicating that the regression model is statistically significant. This table shows a historical increase in Connectivity Rates.
Overall, considering Table 3 and Table 4, it seems that, even prior to Covid, re-enrollment rates keep decreasing, which casts doubt on the already small effect found during Covid. Moreover, the historical increase in Connectivity Rates shown in Table 5 could suggest that Connectivity Rates by themselves are not linked to re-enrollment Rates, as the increase of the former did not stop the decrease of the latter.
![]()
Table 3. Primary re-enrollment rates over time.
Note: *p < 0.1; **p < 0.05; ***p < 0.01.
![]()
Table 4. Secondary re-enrollment rates over time.
Note: *p < 0.1; **p < 0.05; ***p < 0.01.
![]()
Table 5. Connectivity rates over time.
Note: *p < 0.1; **p < 0.05; ***p < 0.01.
4.2. Results by Hypothesis
4.2.1. Hypothesis 1
The finding in Table 2 that Weeks Off School has a negative and statistically significant effect on the dependent variable, with a coefficient of −0.002 and a p-value of less than 0.01, suggests that an increase in the number of weeks that schools are closed (due to reasons such as the COVID-19 pandemic) is associated with a decrease in school re-enrollment rates. This is consistent with previous research suggesting that school closures can lead to declines in school attendance and re-enrollment.
Notably, the effect is more pronounced in Primary school than in Secondary school, which could be explained by the historically lower incidence of Secondary school re-enrollments across the entirety of Mexico, as compared to that of Primary re-enrollment.
4.2.2. Hypothesis 2
Table 1 shows that Connectivity Rates are statistically significant predictors of Primary re-enrollment Rates, which lends support to the hypothesis that municipalities with higher internet connectivity would have higher re-re-enrollment rates in the case of Primary schools. However, Table 2 presents that Connectivity Rates do not have statistically significant effects on Secondary re-re-enrollment rates, as their coefficients are not significantly different from zero at conventional levels of significance.
4.2.3. Hypothesis 3
Table 1 and Table 2 also show us the main results we are interested in: the interaction effect between Connectivity and Covid Cases on school re-enrollment rates. The main independent variable to pay attention to is “Connectivity X Covid cases”, which shows said interaction. Unfortunately, in Table 1 the interaction term Connectivity X Weeks Off School is not statistically significant in predicting Primary re-enrollment Rates. Similarly, Table 2 shows that the interaction effect of “Connectivity Rates” and “Weeks off School” on Secondary re-reenrollment rates is not statistically significant. This means that the coefficients of these variables are not significantly different from zero at the standard levels of significance.
5. Discussion
The aim of this study was to determine if internet access mitigates the impact of Covid-1 on Mexican school re-enrollment rates during school closures.
Only Hypothesis 1 was fully supported in a statistically significant way, suggesting a link between school closures and re-enrollment rates, while Hypothesis 2 was only proven in the case of Primary schools. Hypothesis 3 was not proven in any statistically significant way.
When we analyze the data, and take into account the interaction regressions made, it seems like there is small tentative support for the theory that Connectivity might mitigate the impact of COVID-19 school closures on student re-enrollment in Primary schooling, but not in Secondary schooling, as Connectivity has a positive, significant effect on Primary re-enrollment.
This may be because for families in rural or marginalized areas, primary education is the most important, since it is at this level that basic skills such as reading/writing and solving basic arithmetic problems are learned. On the other hand, in secondary school, young people in these areas are already considered “educated” and allowed to leave schooling to contribute to the family income.
In some cultures, and communities, completing primary education is seen as the minimum requirement for basic literacy and numeracy skills, while secondary education is viewed as optional or only necessary for certain professions. However, it is important to recognize that education at all levels is essential for long-term personal and societal development, and policies should strive to provide equal access and opportunities for all students, regardless of their background or location. This includes addressing issues such as connectivity which might help students’ engagement.
This has many implications for educational policies, government funding and future courses of action in the case of other pandemics, natural disasters, or some occurrence that could force the children of Mexico to interrupt formal, in-person education:
1) Increase access to and quality of online education: given the significant impact of connectivity rates on school enrollment during the COVID pandemic, it is essential to prioritize efforts to increase access to and quality of online education. This can include investing in internet infrastructure, providing devices and internet access to students in need, and ensuring that teachers are adequately trained to deliver effective online instruction
2) Address income inequality: the positive effect of income rates and negative effect of GINI on school enrollment rates suggest that addressing income inequality is crucial for ensuring access to education, particularly during crises such as pandemics or natural disasters. Policies such as cash transfers or targeted scholarships can help to alleviate financial barriers to education for marginalized families.
3) Develop targeted interventions for primary education: the analysis suggests that primary education is particularly vulnerable to disruptions, and therefore targeted interventions are needed to ensure that children can continue to learn basic skills even in the midst of crises. This could include providing educational materials and resources to families, training parents to support their children’s learning, and ensuring that schools have the resources and support they need to continue delivering effective instruction.
4) Increase government funding for education: the low R-squared values in the regression models suggest that there are likely other factors influencing school enrollment rates that are not captured in the data. Therefore, it is essential to increase government funding for education to ensure that schools have the resources they need to adapt to crises and continue delivering quality education to students.
5) Develop contingency plans for future crises: the COVID pandemic has highlighted the importance of having contingency plans in place to ensure that education can continue even in the face of unforeseen events. Schools and government agencies should work together to develop comprehensive contingency plans that address issues such as connectivity, teacher training, and resource allocation, to ensure that children can continue to learn even in the most challenging of circumstances.
Limitations
This research design has a few limitations, such as the issue of selection in our design. Whether states had more or fewer missed days of school was not assigned randomly. This is probably driven by other variables (level or urbanization, wealth, etc.) that lead to higher spread of Covid cases. The same might be true for re-enrollment rates. In fact, internet connectivity is also likely to be affected by not only municipal wealth but also household wealth, so I cannot rule out wealth or income as an explanation and it might be difficult to cleanly identify the effect of connectivity. The socio-economic effects on quality of internet connection (such as bandwidth) should be considered, as a family of 10 will not face the same connectivity issues as one of 3, even if they both have the same technology.
Also, there is an aggregation problem, as what is happening at municipal level might not be happening at the household level. Other confounding variables might include fluctuations in population or simply population differences across states and municipalities. I included population rates per the INEGI census, but the most recent population census was carried out in 2020 (Instituto Nacional de Estadística, Geografía e Informática (INEGI), 2020b) , which means the rates are somewhat of an estimate.
Moreover, there is not much data post-intervention. We have a lot of data for before the COVID-19 pandemic, but only 3 for during and post-Covid, which makes the results and conclusions less reliable and convincing, especially considering the small effect viewed. The data provided on the relationship between connectivity and enrollment in times of pandemic do not fully capture the digital divide. Other studies can delve into the relationship between Internet quality and school retention in times of confinement.
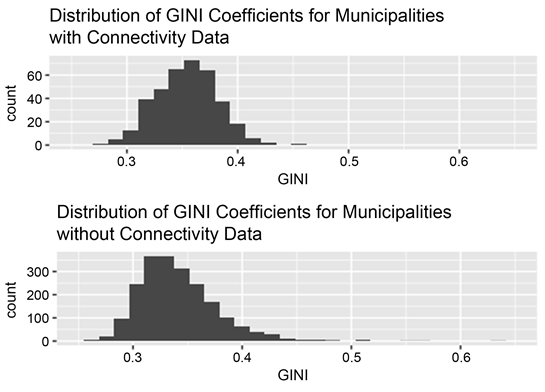
The sample is notably reduced in the regressions that take Connectivity Rates into account. This tells us that the Connectivity Rates data is missing for most of the municipalities, which could be influencing the effect. Which municipalities are falling out of the dataset which could explain a lack of effect. For example, places with low re-enrollment rates might have missing connectivity data, altering the effect. To try to explain this, we not only include GINI and Income Rate data into the regressions, but also carry out histograms to find a pattern between GINI and Income Rate and Connectivity Rates data being present or missing.
Histogram 1 compares the distribution of GINI Coefficients for Municipalities with Connectivity Data and Municipalities without Connectivity Data. What we find is that, although there is an overlap, the distribution of lower GINI Coefficients (higher inequality) is more abundant in municipalities without Connectivity data. This could support the theory that the municipalities for which we lack Connectivity data could be one of the reasons for a lack of effect, as these municipalities with more pronounced inequality might report lower re-enrollment rates.
Histogram 2 compares the distribution of Income Rate Coefficients for Municipalities with Connectivity Data and Municipalities without Connectivity Data. Similarly, to the first histogram, there is an overlap. However, the data suggests that some places with higher income rates (reaching 0.3) lack Connectivity data, while there is a spike in low income rate places (between 0.1 and 0.2) with Connectivity data. This could be explained by the GINI Coefficient—some municipalities might have a few people that skew the income rates into seeming higher, but the mean income rate of that municipality might be much lower, which would give way for low GINI Coefficients and explain a lack of Connectivity data too.
A final limitation is that we only have data from public schools. In some municipalities, people might have switched from public to private, which might lead to substitution effect, creating bias. To address this issue, we could view the fraction of people left when comparing the maximum that can be enrolled (through the same population data) with the fraction enrolled (re-enrollment data). The number left would be either people who dropped out or who transferred to private schools. We could even make a map of “missing” students by age group/ by grade. Therefore, even if they did leave to private schools and we don’t have data for this, we still have a story to tell about the public schooling system and how it was affected by COVID-19, as well as the potential implications of this. We invite further research on this.
Histogram 1. Comparison between the distribution of GINI Coefficients for Municipalities with Connectivity Data and Municipalities without Connectivity Data.
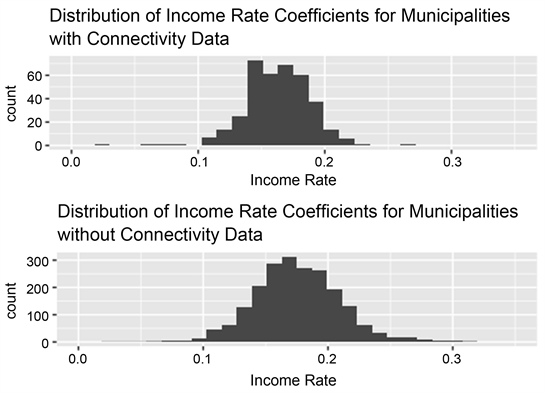
Histogram 2. Comparison between the distribution of Income Rate Coefficients for Municipalities with Connectivity Data and Municipalities without Connectivity Data.
6. Conclusion
The analysis presented in this paper contributes to our understanding of some of the many struggles and obstacles in the interruption of in-person education—namely, the number of weeks of this interruption, enrollment rates and connectivity rates, and the interaction between these.
The methodology used in this analysis allows different factors to be brought into play that may have contributed to changes in schooling trends in Mexico during the COVID-19 pandemic. Using multiple regression analysis, the study was able to identify relationships between the dependent variable (enrollment rates) and several independent variables, including weeks of school interruption, admission rates, GINI, and connectivity rates.
This analysis provides policymakers and education stakeholders with insight into factors that can help mitigate the impact of pandemics and other disruptions to face-to-face education. The findings suggest that policies should focus on improving connectivity rates, particularly in rural and marginalized areas, and ensuring that students have access to technology and the Internet.
Furthermore, policies should also focus on reducing income inequality, as the results suggest that higher income inequality is associated with lower enrollment rates during the pandemic. In addition, policymakers should consider implementing specific interventions to improve primary school enrollment rates, particularly in marginalized areas, as the results suggest that primary education may be more critical for these communities than secondary education.
By addressing the factors identified in this study, policymakers can help mitigate the impact of future pandemics or other disruptions to education and promote more equitable access to education for all students.
It is also true that this study provides relevant information on the effects of admission rates, the GINI, and connectivity on school enrollment rates during the COVID pandemic in Mexico. However, it must be acknowledged that the findings cannot be generalized to other countries or time periods. Therefore, it opens the possibility of comparative studies with other countries that have geopolitical and/or socioeconomic characteristics like those of Mexico.
Acknowledgements
Megan Binnis thanks Professor Melina R. Platas, PhD; Agabek Kabdullin, MSc; and Abdullah Zameek, BoS, for their unwavering support.