Quantification of Carried Sediment Charges through the Outflow in the Basin of Mono River in Benin ()
1. Introduction
The non-existence of enough hydrologic and morpho-dynamic data related first to the constructed water infrastructures and secondly the climate variability and the climate change, about west-African environment, have been carried out to the inundations and floods and the destruction of environment during the two last centuries in West Africa. Studies analyzed the effect of construction of hydroelectric dam of Nangbéto on Mono river in the context of climate variability and the effect of anthropic activities in downstream of the dam between Athiémé and Agbanankin in Benin [1] [2] . That investigation strongly showed that those activities had affected the behaviours of Mono river. According to those considerations, Mono river is confronted to important damages due to the construction of dam at Nangbéto on one side, the inundations, floods, erosion, and the effect of anthropic activities in the basin on other side. That provoked consequently, a change of hydrologic balance of the river system, and then developed new characteristics for the river (height of flood, sand-bank, sand-filling, sand of bed, biological properties of environment).
The presence of solid sediments in rivers is a process resulting from the erosion of the river bottom and the destruction of banks transported by the outflow system. Thus the hydro-sedimentary unbalance is involved by the trapping of majority of sediments transported by the river and the consequences observed even at the mouth of the stream are the coastal erosion in the township of Grand Popo.
Apart the precipitations, the raising of the bed of the river, and the erosion have amplified the flooding phenomenon in the low valley of the Mono river. The presence of strong sediments in the river may be justified by the erosion of the banks, by coming from the uphill of the dam and especially from the deterioration of the floodplain of the stream, where vegetation is destroyed by an anarchical occupation and anthropic activities in the basin.
It depends essentially of the undermining of the bottom of the river, the granularity and the granulometry of the sediments. CODO and et al. [3] analysed those properties and drawn the granulometric curve of deposited sediments in the river and determinate its granulometric parameters, which led to the proposed simulated shape geometrical model of the Mono river in order to evaluate the quantity of carried solid flow.
2. Presentation of the Study Area
The Basin and the Outflow in the River of Mono
The basin of Mono river presented from the north to the south, three climate areas and its watershed is shared between Benin and Togo. The problem of outflow in the river had been summarized by CODO and et al. [3] , and according to them, the influence of the gravity on the flow depends on the slope and flowrate, while the friction depends on the flow characteristics and the granulometric and topographical solid interface characteristics. For certain case of flow rates, the flow conditions depend also of the granulometric and topographical properties of the bed. The flow velocity depending of the variations of water height, is induced by topographical perturbations and thus, cannot move upstream; it is the case of torrential flow. This case is only found in mountain torrents or in special cases (outlet of the alluvium); otherwise the flow is supposed to be fluvial. It exists between those two cases, a very marked difference in behaviour. The cases encountered will be always in fluvial regime. Concerning the applying friction, only on the solid banks of flow (bed and bank), the flow velocity is not uniform in the section. In rectilinear section, the maximum value of velocities of the area is located at the middle of the section and near the free surface, and therefore, the regime of flow in the river is generally highly turbulent. Turbulent flow features will therefore arise with origin, all areas where strong gradient of velocities are generated; i.e. bed and banks and also all topographic discontinuities of the bed. The maximum size of those turbulent flow features is limited by the maximum spatial scales according to the considered direction (height of water in the vertical plan and width of transversal section in the horizontal plan). Those flow features play an important role in the deformation of bed by the outflow.
3. Materials and Methods
3.1. The Mode of Transport of Sediments in Mono River
In general case, movement of grains is organized according to the intensity of flow which puts them in motion during this movement the solid transport is carriage or suspension. The solid sediments transported through the erosion by the hydrographic system named the capability of solid transport, depends essentially of the undermining of the bottom of the river, the granularity and the granulometry of the sediments [4] . The cohesion of solids is an important characteristic of the erosion and for the transport of fine sediments too. It means that, between the resistance to the erosion
(critical shear stress) and the flow erosive strength
, if
then there is erosion; if
then there is no erosion; where
is the critical deposit stress. The theoretical aspect of the solid transport shows that, when the fine sediments are transported without touching the bottom of the river, it is the case suspension; but if the rough sediments are transported by rolling or sliding, then it is the case of overthrusting. It is the case of saltation, [4] [5] [6] . Below certain threshold, the flow is too weak to move the sediments, and when the flow rate increase, some grains begin to move by bearing and saltation. This movement is then extended to all the surface sediments. In the case of coarse sediments, the total mobilization of bed requires high bed slopes or extreme hydraulic conditions, while it is current in the case of sandy beds. According to the increase of flow intensity, the thickness of the saltation layer increases too until the trajectories of the grains can occupy all the entire water column. It is a continuous process, and a criterion allowing to distinguish the transport by carriage (close to the bottom) and the transport in suspension will be therefore arbitrary, [7] [8] [9] .
In the case of gravel river, the solid transport is generally too weak to give rise to the suspension which is rather in the sand rivers. For these one, the solid transport is generally accompanied by dunes. The distinction between carriage and suspension can also be defined by comparing the length of saltation and the characteristic length of dunes. In the case where the path of grain is significantly less than the length of dunes, it is a transport by carriage, and in the contrary case it is a transport by suspension. Other difference between the two transport modes is that the transport by carriage at a given point depends only of the local hydraulic characteristic while the transport by suspension depends of the concentration in water column and thus all of suspension history (and sedimentation) upstream of point considered. A simple way to determine if there is a tendency to suspension is to compare the fall velocity of sediments (who depends of the grain diameter) and the characteristic turbulent vertical speed within the flow. The friction velocity (that is another way to express the constraint of the bottom) gives an order of magnitude of the latter. In the case of Mono river, the interested type of transportation is the transport of sediments of the bed; but there is often the carriage plus a transport in suspension of the very fine grains, result of the leaching upstream, and do not settle down in the bed. However, this type of transport takes place in the fluvial morphology: it can be trapped by the vegetation and to contribute to the raising of islands, or to settle down at recession in some areas of the alluvial (formation of dyke beads), [9] [10] [11] [12] .
At least, the transport of sediment on a flat bottom is, in the case of sandy beds, an exceptional situation which corresponds to very low transport, whether to a very strong transport.
3.2. Model of Quantification of Engelund and Hansen
The formulation of calculation method
The solid flow is defined as the total weight of solids transported by the stream through a cross-section of stream during a unity of time. The total solid flow rate is calculated with the empirical formula of Engelund and Hansen; [13] in the dimensionless form:
(1)
K: being the global coefficient of Strickler of the minor bed, including the roughness of the banks and that of the grains constituting the bottom and if necessary, that of the dunes.
: being the shear stress.
That formula had been established for a d diameter varying in 0.15 mm < d < 5 mm, (case of sandy soil), condition respected in the case of Mono river. Thus, with that model, the carried solid charges in a section can be calculated for each section, according to the simulated section of the upstream river at the station of Athiémé; [3] .
3.3. The Initial Conditions of Solid Sediments
The granulometry testing permitted to draw the following granulometric curve [3] .
The Dm = 0.75 mm and D50 = 0.375 and the uniformity coefficient is calculated with the following formula:
(2)
The results of granulometric analysis obtained for the different sands are as follows: For clays and other sediments derived from clays, diameters are between 0.002 mm and 0.05 mm; for fine sands, the diameters are between 0.05 mm and 2 mm; from medium sand to rough sand, grains diameters are higher than 2 mm [3] . The uniformity coefficient (Cu) of grains indicates the type of granularity of grains. In the case of Mono river, Cu = 0.33, (Cu < 3, the granularity is uniform). Thus consequently, the particle size distribution in Mono river is uniform. Through the granulometric curve, different diameters are determinate [3] . The determinate D50 and D10 according to Figure 1 and the calculated uniformity coefficient
are necessary to evaluate the Shields parameter. If Cu < 3, then the granularity is uniform. Therefore, the soil of Mono river is sandy soil. The medium speed depending of the season, is between 0 and 1.2 m/s. According to those conditions, thus we concluded that the Engelund-Hansen model is a suitable calculation model. Figure 1 shows the different diameters determinate through the granulometric testing.
3.4. The Threshold of the Water Movement in Mono River
The diameter used for the calculation of Shield number depends of the nature of particles size. In this model, we use the median diameter d50 due to the fact that the particles size distribution is uniform in Mono river; however, other practical and easy way is to use the suggested classification of Ramette (Table 1).
![]()
Figure 1. Determination of different diameters in the granulometric curve (Codo, 2019).
![]()
Table 1. Movement threshold for uniform particle size distribution (Ramette).
3.5. The Determination of the Limit Speed of Transport of Sediments
The water flow can present three distinct behaviors, depending of the speed. Huljström (Huljström, 1935) had studied all those cases as follows:
The sedimentation: the particles are at rest and the current velocity is not strong enough to mobilize them.
The transport: the current velocity become high enough to start the transportation of particles.
The erosion: the current velocity becomes strong enough to pull the average and large grains out of river bed.
Those different behaviors are exposed in the diagram of Huljström which illustrated the behaviors of flow transport of particles in function of the particle grain sizes in Figure 2.
According to the diagram of Huljström, the behaviors of flow transport of particles depend of the size of sediments and the current velocity of watercourses. That diagram presents the different areas for transportation, sedimentation and suspension-transportation.
3.6. The Critical Shear Stress and the Threshold of Shear Stress
In order to understand the formulas used to calculate the transport capacity as a function of the hydraulic quantities, it is important to know the different forces exerted on particles at the bottom of the river. The main forces are:
The gravity acceleration;
The pressure;
The shear stress.
The shear stress is a parameter determining the mechanism of the water movement at the bottom of the river. It is also called the tangential stress and noted τ as the tractive force, expressed as follows:
(3)
The critical shear stress called critical Shields number, used in Engelund and Hansen formula can also be expressed in dimensionless form as a function of
particle size distribution; [14] . In the case of uniform particle size, the average diameter is a diameter used during its calculation as follow, according to [15] [16]
(4)
where
.
The different values of the critical shear stress are summarized in Table 1, according to types of movement threshold for uniform particle size distribution.
Extracting the term
from Equation (5), we got
, named dimensionless shear stress at the bottom is the value of the shear effect and can be calculated as follows:
(5)
It expresses the friction speed at the bottom of the river. The following Figure 3 shows a schema of the shear stress useful for the quantification of carried solid charge.
The following Figure 4 shows the movement threshold of grains, consequently the values of the critical Shields number in function of the distance.
3.7. The Calculation of Fall Velocity of Sediments
The fall velocity results of balance between drag force and submerged weight. It is noted Ws and can be calculated according to the Stokes law as follows:
(6)
The fall velocity of sediments is an important parameter which governs the vertical repartition of suspended soil grains and the speed of the sedimentation during the period of low streams. It helps to distinguish the sediments in equilibrium state. According to the measurement, the mean speed of Mono river from Athiémé to Agbanankin is between 0 and 1.2 m/s.
4. Results and Discussion
4.1. The Results of the Simulation of Shapes of Water Sections
This study is the second step of the study of the investigation of the carried solid flow transport in Mono river, after the publication, untitled “Geometric drawing model of shape of water sections for investigation of solid flow transport in the basin of Mono river in republic of Benin”, [3] . That study is basically useful for the quantification of carried solid flow charges. Basing on [17] [18] and thanks to the bathymetry, to the calibrated measurement of depth and of the survey on a number of sites, the transversal profile of the river (down-Mono,) is reconstituted, to identify the evolution of the filling, comparing to the previous works. The movement of sediments, which shapes the bottom of the river, is a complex phenomenon. To study the geometry of this watercourse, the assimilated bathymetric curve of the river to a regular form of figure have been plotted and at least, on the following figure, the measured bathymetry of a section of the upstream at the station of Athiémé is drawn (Figure 5) and presents the simulated transversal section of the river at Athiémé (Figure 6); [3] .
![]()
Figure 4. The Critical Shields number in function of the distance.
![]()
Figure 5. Bathymetry of the section of the river upstream at the station of Athiémé.
![]()
Figure 6. Simulated section of the upstream river at the station of Athiémé.
Taking into account that all section of Mono river at Athiémé, may be calculated according to the simulated form [3] , where
Y: the water draught;
AB: the width of glassy water;
DC: the width on top;
AD: the left of bank;
BC: the right of bank.
And considering Sk as the area of the river section located at K point on the average line of longitudinal profile then we got:
(7)
where
,
,
and
(8)
and
(9)
Lk: the width of glassywater, lk the width on the top, zk position of the section on the average line, n the step in the space and Lb the length of the reach. Xj, Xi, Yj et Yi are the topographic coordinates of the bank, [3] . The different geometric parameters obtained from the river on the reach is based on the analysis of the bathymetry in twenty (20) measured sections of the river from Athiémé to Agbanankin, considering the sinusoidal character of the river, its geomorphology is handmade by the hydraulic turbulences of meanders, and the cross section is the simulated section of the upstream river at the station of Athiémé. With the geometric model, the evaluation of width to glassy water and to top of the river in the reach on 10 km with a step of 500 m is obtained. The knowledge of dimensions of the sections of the river allowed to evaluate the dimensionless stress (Shields parameter) in order to determine the transport mode of grains. The following Table 2 is the recapitulation of the measured dimensions of the sections of each point by the bathymetric measurements [3] .
The longitudinal profile of the river (left bank and right bank) in the reach upstream of the station of Athiémé shows four (4) meanders on just 10 km [3] . The river is therefore very sinuous; and its sinuosity had highly influenced the dynamic of watercourse. The evaluation has been calculated with the so called Engelund-Hansen model and using the results of [13] [17] [18] [19] .
4.2. The Quantification of Carried Solid Sediment Charges
Through the analysis of the evolution curve of the dimensionless stress, the movement threshold of the grains (
) is not reached in over 18 sections
![]()
Table 2. Evaluation of the dimensions of the cross sections of the river from Athiémé to Agbanankin.
calculated by the geometric drawing model of shape of water sections in the calculation of solid flow transport in the basin of Mono river with an exception of 2 sections. This remark includes that the big part of materials which are deposited in the bed of the river come from the erosion of banks and basin. Those phenomena are undoubtedly due to the effect of the dam of Nangbéto and the consequence is the solid flow and the erodability of the soils. The solid charges on a section (10 km) carried are evaluated in each section with the model of Engelund and Hansen [13] .
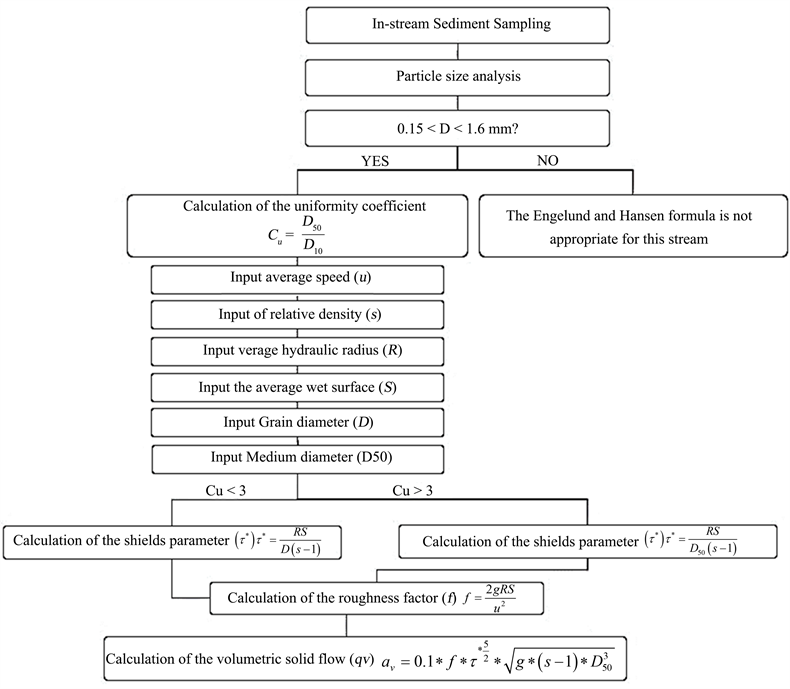
4.3. Engelund-Hansen Method of Solid Sediment Charges Quantification
A computing code based on Equation (1) and an interface asking input data is designed in MATLAB environment [20] . The required steps of the algorithm are the followings:
Algorithm for Calculation of solid charge with Engelund-Hansen Mode
4.4. Results of MATLAB Code for Engelund-Hansen Method
The results of the quantification of carried solid flow obtained by Engelund-Hansen model are presented in the following Table 3.
Table 4 presents the results of the calculation of carried solid flow charges in each section of the river.
4.5. Evolution of the Solid Sediment Charges in Mono River
The evolution of the solid sediment charges depends of the flow speed. In Mono river, the flow speed varies between 0 and 1.2 m/s. Consequently the volumetric solid quantity (m3/s/m or m2/s) has been evaluated by taking into account the speeds in Mono river. Thus the tendency curve is plot as power type curve of Figure 7 and its equation depending of the speeds of the solid flow in Mono river is plotted as follows:
![]()
Table 3. Results of calculation of solid flow quantity by Engelund-Hansen Model.
(10)
And the volumetric solid flow varies as follow:
Table 5 shows the solid charges of bottom by carriage, during three months in the reach.
![]()
Figure 7. Variation of volumetric solid flow in function of the speed of the solid flow in Mono river.
![]()
Table 4. The solid charges calculated by section in the bief.
![]()
Table 5. Solid sediment charges quantities evaluated at the bottom of the river during 3 months at the reach.
5. Conclusion
In order to investigate and calculate the solid flow quantities of Mono river, the model of Engelund-Hansen is usable in the interval of
(case of sand). In that interval which is the case of this river from Athiémé to Agbanankin, the mean speed is between 0 and 1.2 m/s. The result of the simulation confirmed the observations of the watercourse which shows the rate of denudation higher in the river (43 t∙km2/an) after the construction of the dam, against (16 t∙km2/an) before its construction, because of the increased erosion of the banks and the degradation of the covering vegetation during the current years.