Shipbuilding: The Neglected Industry among Those of Shipping, Maritime & Marine: The Case-Studies of UK, Japan & S Korea ()
1. Introduction
The British Maritime economist late Professor Goss (2002) and the Greek Marine Economist Goulielmos (2001) , defined 3 terms determining their sciences: Marine, Maritime and Shipping. Shipping includes two industries: shipping and shipbuilding, and this is a historical fact as the first economists used to deal with ships and their building.
Thereafter, shipping economists recognized the importance of ports and coined the term maritime, by extending the circle of their original science to include Ports (& Canals) and their economics (1965). This extension was successful because it soon attracted the research interest of the shipping economists.
In 1982, UN decided to vote the law of the sea and to determine a number of zones in the sea, beyond territorial one, and also and more important to connect the zones to the coastal nations, which could exploit the resources there. This way marine economies were established in a wider circle to include shipping and maritime sciences.
Namely Marine economy includes 17 industries (listed below). Important, for economic reasons, and especially nowadays (2022), is to pump-out oil and gas trapped in the sea (Picture 1)!
Shipping economists, before 1965, dealt occasionally with Ports! Goss (2002) argued that the economic principles underlying the 3 most important activities of Ports: construction, extension and operation, were unclear 4 decades ago (1965). He also (2002, p. 399) argued that Mr. Price E1 proposed the term “Maritime” so that the Ports to become a part of the ships.
Shipping appeared together with life on earth, more than 5000 years ago (Stopford, 2009: pp. 3-45) . The 1st great economists Smith (1991) 2, Ricardo (1847) and Marshall (1890) 3, made extensive references to “Shipping” and “Sea Commerce”!
2. Aim and Structure of the Paper
The paper studied primarily Shipbuilding: historically, geographically and economically. We also answered the question: “Why certain global shipbuilding powers, like UK and Japan, had eventually to step back?” In addition, we presented the enlargement of shipping economy towards Ports, in 1965, and the enlargement of Maritime economy towards Marine, in 1982.
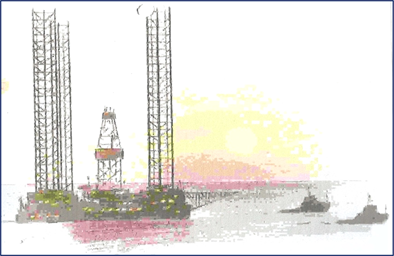
Picture 1. An artist’s idea of platforms extracting oil (North Sea, 1990). Source: the 1990 “Platou SA” report.
The paper has 12 parts, after literature review: 1) Why Seaborne Trade mattered to Nations? 2) How the “territorial Sea” determined? 3) The “Marine Economy”. 4) Are there obstacles to economic Growth? 5) The unintentional error of Adam Smith. 6) The “Maritime Economy”. 7) The history of Shipbuilding. 8) The main characteristics of Shipbuilding. 9) The economics of shipbuilding. 10) The “new-building” Price. 11) To build or not to build for export? 12) What are the benefits from having shipyards? Finally, we concluded.
3. Literature Review
The UK “Physiocrats” (18th c) influenced economics, and Adam Smith, by their focus on Agriculture. They believed that the “wealth” comes from labor (in conjunction with land) (Quesnay F; 1694-1774)4. The early economists, and Adam Smith, had to find-out the sources of “wealth”5!
Koopmans (1939) argued that: “a high level of rates leads to large-scale orders (for tankers)…upon their completion, about one year later, they have a depressing influence on the (tanker) freight market…producing cycles” (bolds & parentheses added). Modern tankers need now at least 2+ years to be completed and extra 6 years, if there is an exceptional boom (like in 2003-8) (Goulielmos, 2022) !
Certain scientists defined, indirectly, the content of shipping economics by their writings: the Norwegian Svendsen (1958) , the Swedish Thorburn (1960) and the English Sturmey (1962) . The first wrote a “shipping economics’ textbook” (translated into English), a product of his doctoral thesis. The 2nd dealt with the Supply & Demand of ships. The 3rd dealt with UK shipping and the question: “why the tonnage registered in the UK declined from over 45% of world total (in 1900) to about 16% (in 1960)”?
In USA, there were Ferguson et al. (1961) . In Japan, there was Shimojo (1979) . Alderton (1999: p. 225) wrote about ports and argued that the same ship and cargo, in 1988, paid $150,000 in Finland & Southampton and $12,500 in Lisbon! Stopford (2009: p. 81) mentioned ports occasionally. Professor Talley (2012) (editor), however, devoted 1/3 of pages to port economics, and almost nothing to shipbuilding!
Heaver (2012) categorized the 659 papers, written by maritime economists, into 14 segments, during the recent 30 years or so: 1982-2009 ( Figure LR1), in two only journals: Maritime Policy & Management & Maritime Economics.
Four new sub-sectors6 appeared for the 1st time in 2000, reflecting the fresh interest of maritime economists, but also of the international community! Ports gained the lion’s share followed by liner shipping economics. Heaver (2012) underlined that the research of maritime economists remained diverse and certain subdivisions of the field are necessary. For the segment of shipbuilding, Heaver quoted Dikos (2004) and argued that there is a variety of subjects.
Shipping economists had to take part in the pricing policy of ports7 earlier, we believe! As a result, Ports did not adopt the “95% dwt capacity” in deciding tariffs, as they should, and instead adopted the ship’s size (GRT/NRT). This based on the naïve assumption that “the bigger the ship, the more she earns”!
4. Part I: Why Seaborne Trade Mattered?
Smith observed that Nations were endowed. More important, however, was that each country had different endowments! Endowments are the “natural resources8” laid-down by God! As a result of the different endowments, the theory of economic autarky9 could not be applied! This was clear to Adam Smith (1723-1790), writing in 1776 the “Wealth of the Nations” (Picture 2)!
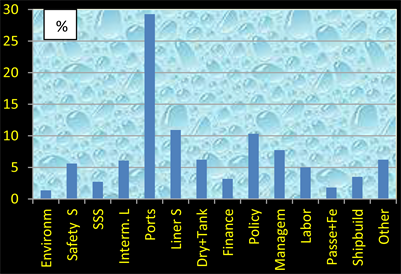
Figure LR1. Papers written by maritime economists on 14 main subjects, 1982-2009. Source: data from Heaver (2012: p. 26) .
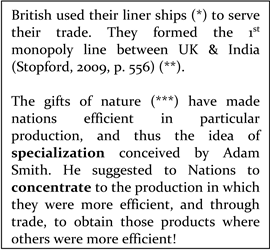

Picture 2. Adam Smith’s book cover (London 1776) (left). (*) The liner ships were dearer, faster with own loading/unloading means, keeping a schedule of departures and arrivals, capable to carry cargo and passengers, built by the British to serve the trade with their colonies. Greeks specialized in the simpler and cheaper ships called “tramps”, becoming the “cargo taxis” of the seas; (**) Marx Jr. (1953) analyzed the workings of this (conference) system; (***)10.
Moreover, “economic autarky” could not bring-in silver &/or gold as “Mercantilists” in UK (and France) wanted (16th-17th c)! “Mercantilists” saw the importance of seaborne trade, when they identified silver &/or gold with “wealth”! Mercantilists’ economic philosophy was powerful, however, as held by the merchants and the statesmen of UK. They arrived, however, at a dogma: “exports, (using “navigation acts”, tariffs, subsidies etc.), should exceed imports, so that silver/gold11 to pour-in (the UK)”. Moreover, the trade of colonies had to be exclusively with the mother country (UK)!
The big European nations, and, par excellence, UK, tried to make the manual workers more productive using “machines”. In the late 18th century the power of machines multiplied that of humans, known as the 1st “industrial revolution12” (Robbins & Coulter, 2018: p. 67) . Management also influenced by mechanization, but mainly since 1911, when the book of Taylor F W, on “scientific management”, published in USA. The Production at home succeeded by the production in “factories”, under the direction of “managers” and/or “supervisors”.
5. Part II: The Territorial Sea
Although this is not known, the pirates are “responsible” for the nations to adopt a territorial sea! Piracy was the ancient threat for coastal nations and/or for their islands. Nowadays (Mejia Jr. et al., 2012) pirates are also a serious threat for ships in Somalia and elsewhere. Places had, in the distant past, for their protection, walls13 and cannons. The cannons had a range from 3 to 6 n. miles14, and this, since then, became the range of territorial sea!
6. Part III: The Marine Economy
Τhe Marine industries, created by the “law of the sea”, voted in 1982 by UN in its 3rd meeting, are about 17 so far (Table 1) (Stopford, 2009: 663-666) .
![]()
Table 1. The 17 marine industries (1982).
Source: author.
In 1980 the “Marine science” taught20 in the “London School of Economics21” (by Professor Watt D C)! The coastal nations have, since 1982, the right either to share the fish catch with those that they carry-out it, or to do it on their own. The Sea, in 1982, became a lawful 2nd economy22, equally rich as Land, but required a new generation of economists to deal with it, as well as other scientists, so that to…avoid, we reckon, to the maximum possible, the mistakes committed in the management of land and the climate.
UN wanted, especially, to preserve sea environment, and sea resources, which were exhaustible, par excellence fishery, from human greediness! In addition, the EU was also very glad when discovered, for the first time, the “EU Marine Economy” by its transport commissioner Barroso, J. M. (in 2006)!
The New Sea Zones
The Map 1 indicates the expanded territorial sea23, since 1982, as a property of the coastal state (article 3), and of course its internal waters (article 8). The remaining sea, up to the end of the “Exclusive Economic Zone”, (200 n. miles; ~370 km; article 57) can add to the GDP of the coastal state(s).
The article 76 defined the continental shelf. The impact of the LOS on economies could not be so great apart from fishery, if scientists did not estimate that the oil and/or gas are deposited in the continental shelves!
The above, legal control, of the 2/3 of the planet, became possible when colonial powers decided to liberalize their former colonies, becoming members of UN!
7. Part IV: The Obstacles to Economic Growth24
Economists did not believe in dear oil, till 1975, 1979 & 2022! Moreover, Germany did not want to depend on nuclear energy, after the Chernobyl disaster (1986), for political reasons! Japan fights till today to restore the impact from the “Fukushima nuclear disaster” (2011), having already the experience of Nagasaki and Hiroshima (1945), where 355,000 Japanese died!
After the 2 energy crises, as well the 3rd one (2022), economists had to, and have to, deal with the issue if out there are “obstacles to growth”? We may remind that Economics as a science born-out to solve one problem: “How humans
![]()
Map 1. The Marine Zones defined by the Law of the Sea (UNCLOS III), 1982. Source: British Maritime Industry & EEZ catalogue (in 1999), “Combined service publishing Ltd”, Hampshire, UK; modified.
will be able to satisfy their innumerable needs having limited means?” This problem, however, put under control though not philanthropically, by the institution of prices, meaning that “who does not work, he/she will, most probably, not eat!”
A more difficult problem emerged, however, for economists in 1986: “how to satisfy infinite human needs, with certain limited, but at the same time, exhaustible, resources?” This means to “reserve” certain means for those that come after us, in accordance with the “sustainability25” principle.
Our kind God allocated natural resources according to his wisdom, but he certainly did not mean that the Arabs, in end-1973, had to use oil as a weapon against Israel, or that Russia, in 2022, had to use gas as a weapon against NATO! Resources are there to be exchanged in peace and solidarity, as Adam Smith the moral philosopher, argued!
More important, however, is water, which easily can become the next more effective “weapon”26! The democratic worldwide community has to supervise, by a new UN body, all the important rivers (e.g., Tiger & Euphrates), and their management, we strongly believe! In fact all rivers need a proper management as the summer of 2022 taught us!
The mechanism of prices, mentioned above, as a moderator of over-consumption, required someone to be “paid” in order to produce! Adam Smith instead “saw” the…“invisible hand”27! A producer, however, needs one to buy his/her products, meaning a demand accompanied by the proper amount of money meaning…a visible hand (an “effective demand” in other words, as mentioned by Keynes)!
8. Part V: The Economic Error of Adam Smith
Adam Smith meant an economic development based on “natural resources”. So, a country has to grow establishing “resources-based industries”. The Japanese did not follow him. Instead, (free) Japan “copied” and improved the imported knowhow from Americans28, par excellence in the manufacturing of private cars! British, of course, followed Smith! They saw that the raw materials, which they did not have, they were owned by other people (e.g., India). British called cleverly this whole trade relationship with colonies apropos “common-wealth”!
Certain countries, like Japan, could not follow Smith, due to lack of either oil or iron-ore! Alternatively, knowledge does not need resources. It needs know-how, meaning a number of good brains (Goulielmos, 2018) ! This, of course, diminishes by the “brain-drain29”, as this happened with especially Greeks in 2009-2018.
9. Part VI: The Maritime Economy
Historically, the right “hand” of ports (& canals) was inside the pocket of ships, and still is, and the left hand was in the pocket of those who import products, and still is. Some port economists claim that the port costs are made for ships’ sake, and so they have to be recouped (“Cost recovery theory”). This is partially true30!
Apropos, it appeared a new term: the “logistics”, which had to be used to reduce consumer’s transport cost, but it did not, we reckon. Logistics is a “branch of maritime economics, and of ship, and port management, which deals with the time, cost, manner & information flow of ships and ports, with a view to optimize the whole process”, but it concerns only containerships.
We turn now to shipbuilding.
10. Part VII: The History of Shipbuilding (1902-2021)
10.1. The European Shipbuilding (1902-2021)
As shown (Figure 1), Europe had the 90% of the world share in building ships for almost 50 continuous years (1902-1950s).
As shown, the 2 WWs reduced the global share of the “European shipbuilding” from 30% to 8%! Up to 1945, Europe exported more ships than imported! This ended. Its share fell to 60% by 1966. Its peak since 1960, was in 1977, with ~11 m GT31 (not shown). This share reduced to ~10% by 2005! In 2021 (July) arrived at ~13% in cgt32 out of ~76 m worldwide, showing a small rise (data from Shipping statistics yearbook, 2021, Institute of Shipping Economics and Statistics, ISL, 2021).
In more detail (Figure 2).
As shown, the 16 European countries, which have built ships since 1960, are presented over six decades till 2021 during selected years. Certain nations disappeared by 2021. In 2021 (July), Germany took over from UK, and Italy from Germany. The data of Figure 2 is selected from Stopford (2009) covering the period 1960-2006 and for 2021 the data is provided by ISL. Figure 2 shows the percentages of GT produced by each country in the total European production. UK was on top in 1960.
![]()
Figure 2. The Shipbuilding activity of the European countries, 1960, 1980, 2000, & 2021 in % of GT m in total European production. Sources: data from Stopford (2009: 615) till 2000; ISL for 2021.
The W European Shipbuilding in 1978
Japan and S Korea in 1978 took over most of the shipbuilding businesses of W Europe (Figure 3).
Figure 3 shows the global shipbuilding production in GRT in percentages from 1971 to 1987. The W European countries, in 1971 & 1977, completed 41% of the global ships vis-à-vis > 63% 11 years ago (not shown)! This fell to 12% in 1986! Japan having more than half of the global production in 1971 reached again higher percentages in 1980s after overcoming the shipping crises in 1975-1979. Also S Korea appeared in 1972, which by 1987 obtained a 25% share attracting it both from W Europe and Japan.
![]()
Figure 3. The % share of W Europe, Japan and Korea S in the world output of ships (1971-1987) (in GRT). Source: Stopford (1989) , modified.
By 2021, a ~10 m CGT production took place, which accounts for the 15.5% of the production of the 3 main shipbuilding nations: China, S Korea & Japan (source: ISL, 2021). W Europe stayed alive in shipbuilding, (in July 2021), by building 90 cruise ships (source: ISL, 2021)!
The above was the result of the depression in tankers (1975, 1979), and in bulk carriers (1981-1987) due to the first 2 oil crises. In October 1973, the shipbuilding boom ended (Stopford, 1989: p. 36) . From 36 m GRT, destined to be achieved in 1975, 3.6 times larger than in 1962, shipbuilding fell, in 1978, to 12 m GRT (1/3). The increased labor cost also contributed to this decadence.
In 1977, the building cost in the European countries was higher than the Japanese one by 20% to 30%, while the methods of building ships were old and no new investment has taken place. The required hours of work in a large Japanese yard were 1/2 of those in the EU yards, including those for maintenance.
10.2. The Scandinavian Shipbuilding
Scandinavia has a strong shipping tradition, and especially Norway (9th worldwide in 2022 with ~68 m dwt). The past share of its shipbuilding was, however, 3% (1902)! Shipbuilders originally had to switch from the wooden ships to the iron ones (1870). Also, they had to forget the home grown timber. The changes obliged ship-owners to use steam, something difficult for shipbuilders, because the raw materials, the heavy machinery and the cranes had to be imported. In addition, the new technology needed more land. These problems eventually solved, but they took 30 years (till 1900)!
Scandinavian shipbuilding retured, however, and reached a 21% share, globally, in 1933, and maintained this till 1971-1972. Sweden specialized in the production of the VLCCs, (the very large crude carriers), in a very productive way, but it could not stop the increase in its shipbuilding cost!
10.3. The UK Shipbuilding: A Case-Study
UK was a predominant producer of wooden ships, from 1741 to 1871! One competitor of the UK was France, designing better ships; the other was USA-building better ones! UK, however, was a great seaborne trade power (in 17th c.). In 1890, UK dominated also in shipbuilding, producing more than 80% of the world ships (Stopford, 2009: 616) ! In 1902, however, UK held a 58% share. In 1950s, UK started to lose it, and by 1960 its share was only ~15%!
The reasons of the above decadence were (Graph 1).
As shown, the 1st, valid, cause was the two WW. Stopford (2009) insisted that “the diminishing share of UK in the world shipbuilding” was due to the “decline of the UK fleet”!
A digression. If the above was true, then all 5 top shipping nations (Figure 4) should also be top global shipbuilders, but they are not!
As shown, Greece, which lost 2/3 of its fleet in both WWs, held the top shipping position with 251.4 m GT33 in Nov. 202234; China owned 235.4 m GT; Japan owned 178.7 m GT; S Korea owned 66 m GT and USA 65.6 m. These 5 countries owned 1196 m dwt out of 2200 or 54% of the world fleet of 2.2b dwt.
Continuation for UK: A 2nd, valid, argument was that UK fleet lost its share in seaborne trade. True, UK developed, up to 1890, sea trade at its maximum, while the trade flows were massive in the Atlantic and Pacific routes at that time. A 3rd, valid, argument was that the UK shipbuilding achieved a low productivity compared with Germany and Scandinavia. True, UK shipbuilding needed a double amount of man-hours vis-à-vis Japan! The 4th, valid, argument was the parity35 between $ and sterling!
![]()
Figure 4. The tonnage owned by the 5 top powers in the world fleet (01/11/2022). Source: data from Clarksons.
10.4. The Chinese Shipbuilding
China is a modern shipbuilding nation appeared in 1990-2000. In early 1990, it had an active shipbuilding activity, with many domestic yards and a full infrastructure, properly organized, with a number of research institutes!
The “Dalian New Yard” marked the major expansion in late 1990, reaching from <~1 m GT in 1995 to ~6 m GT in 2005, and 11 m in 2007. By 2011-12, 40 m dwt of ships completed each year stabilizing down to about 22 m dwt by 2020. In 2021 (07), it had a 38% share in world deliveries and a 37% one in orders of ~11 m cgt. In 2022, about 37 m dwt of ships is estimated to be completed in China, or 60% of world total!
10.5. The South Korean Shipbuilding: A Case-Study
This was carefully planned for exports, in 1971-1972, in a major investment program run first36 by “Hyundai”37 (1973), followed by “Daewoo”38 (in early 1980) and “Samsung”39. As shown ( Figure KS1), S Korean shipbuilding started with 0.46 m GT (1962) and reached 1.23 m (1986), out of ~17 m worldwide (7.3%).
The new orders were 19.4 m GT worldwide (1983), where S Korea obtained ~19%, while Japan got ~46% ( Figure KS2). By 1995, the new orders were ~26 m GT, and S Korea got ~30% vis-à-vis Japan ~35%.
![]()
Figure KS1. Ship completions in Korea S, in m GT, 1962-1986. Source: Data from “Traditions of excellence”, 1998.
![]()
Figure KS2. New orders globally, in S Korea and in Japan, in m GT, and in %s, 1983-1995. Source: data from “Traditions of excellence”, 1998.
![]()
Figure 5. The activity of the E European Yards, 1960-2021 (selected years). Source: data from Stopford (2009) for 1960-2000 & ISL for 2021.
10.6. The East European Shipbuilding (Figure 5)
There was a small activity of 1.3 m GT p.a. worldwide (1960), with Poland to increase its production, and Ukraine to face the impact of the rising wages and of an unhelpful parity.
Poland and Yugoslavia dominated in shipbuilding (1960) with a ~4.5% share within the group; by 2021, the share fell to ~2.1%. Poland maintained its share followed by Croatia and Romania.
10.7. The Japanese Shipbuilding, 1950-2021 (July): A Case-Study
Japan lost almost its entire fleet during the 2nd WW. The 12 (survived) shipyards41, which by 1952 increased to 14, could produce 1/2 of their pre-war GRT (1948). Their prices were low due to low wages: a 15,000 GRT tanker, deliverable within 18 months, priced at $3m. Japan had to import steel mainly from USA! USA42 an occupier, helped Japan with a loan of 7b Yen to build tankers etc., to become self-sufficient!
Japan invested substantial amounts in equipment suitable for modern shipbuilding works, and methods, which were adopted by its heavy industry already, coupled with high degrees of planning and automation. These saved time and caused fewer labor accidents! The ship bridge installed back for the 1st time (the “transom” type). The Japanese yards adopted the standardization of ships in the “Freedoms” (1965). The Japanese yards shared the problems of ship-owners having to face the increased costs of loading/unloading and the rise in the price of oil (1975)!
10.7.1. Japan’s Fleet/Shipbuilding (1950-1970)—As a Free Country
The country’s new shipbuilding effort was well organized by involving Ship-builders, Ship-owners, and the Government as sponsor! The Government selected shipping and shipbuilding for an intensive state attention, (Ministry of Transport-MOT), in 1947, quite justifiably, aided by finance directed to shipping at >33%. Its steel mills soon provided the steel plates required (1948)!
Table 2 summarizes the main shipping/shipbuilding policies in 1950-1960.
![]()
Table 2. The Japanese shipping/shipbuilding, 1950-1960.
Source: data from Naftika Chronica, 2022.
The 3 main successful objectives of the Japanese yards in 1956 were (Graph 2).
The Greeks who never missed the good opportunities, ordered massively ships in Japan (Figure 6).
As shown, 74% of Japan’s exports (1955) were for Greeks, which fell to 40% by 1963-64 (April-Feb.). The Cuban crisis took place (1962). Apropos, the 2nd closure46 of the Suez Canal in 1967, demanded tankers > 200,000 dwt. Greeks built such tankers, and OBOs, sized 150,000 dwt. This is an area of extreme economies of scale (1964-1967).
This is also the time when the “mini bulk carriers” of 3000 GRT were built for the trade in USA lakes etc. for a Greek ship-owner, and the time of “Freedoms”, destined to replace Liberties (1968-69). In 1967 (August) the first automatic47 vessel delivered from Japanese yards to her Greek owner!
The shipyard policy of Japan during 1960-1970 was as follows (Table 3).
10.7.2. Japan’s Fleet/Shipbuilding (1971-1989) (Table 4)
The above period is characterized by the oil crisis in 1973. Before that the Suez Canal closed in 1967, and a boom in the freight markets took place, in 1969-1970. In 1971 an agreement achieved between major oil companies and OPEC and a recession emerged. A major change in the shipbuilding policy of Japan decided! We showed below Graph 2, that the adaptation to the ship-owners specifications was respected and satisfied by Japanese yards, and this was a competitive advantage.
In 1970, the Japanese decided to adopt the “mass production” through standardization, expecting to build ships of quality and of low price, something not liked by Greeks! The Japanese insisted, by majority, arguing in addition that the standardized ships were easier to maintain. They were right, but they did not expect the 1981-1987 shipping depression!
![]()
Graph 2. The objectives of the Japanese yards, 1956. Source: author.
![]()
Figure 6. Orders for ships from Greek ship-owners, 1949-1964 (Feb.). Source: data from “Naftica Chronika”, 2022.
![]()
Table 3. The shipyard policy of Japan, 1960-1970.
Source: as in previous table.
Decisive was also the revaluation of Yen, making shipbuilding prices higher, coupled with increases in the wages etc. of Japanese workers, and an increase in the price of steel (1971), at a time when Japanese shipyards worked at their full
![]()
Table 4. The history of the Japanese shipbuilding, 1971-1989.
Sources: data from Stopford (1989) ; & data from Naftika Chronica, 2022.
capacity. An agreement achieved between the Greek ship-owners union and Japan for the shipbuilding contracts affected by the revaluation (1977).
We have already mentioned the detrimental period of 1980-1990 for both shipping and shipbuilding when many orders were reduced and cancelled. Worth mentioning is the building of the 1st VLCC (very large crude carrier) 291,391 dwt, double hulled (in 01/02/1993) for Greeks, a “product” of the 1990 Oil Pollution Act. Between 2000 and 2010 Japan does not favor exports. Despite this, Greeks, in 2008, placed orders in Japan for “Aframax” tankers. In 2013, under the pressure for the decarbonization of shipping, Japan marketed the 33,000 dwt new bulk-carrier “IS” Tri Star capable to save energy, and the “eco-design”.
The Asian etc. shipbuilding performed as follows (1960-2021) (Figure 7).
As shown, Japan had the top position (1960). S Korea “obtained” almost 1/2 of Japan’s share (2000). In the meantime the cost of S Korean shipbuilding increased (1960-1970). Also, the cost of Japanese ships increased, and much shipping business lost away to Hong Kong and Greek ship-owners.
Despite the above the 3 major shipbuilding countries in 2005 had the 80% share in the 230 m dwt world orders (Figure 8)!
As shown, S Korea attracted the top world share in orders with 81.3 m in dwt and 1160 ships, of which 660 tankers and 430 containerships; Japan got 510 bulk carriers and 350 tankers (& 100 RORO); China got 320 tankers and 264 containerships.
10.8. Other Shipbuilding Countries
Once upon a time, USA held lion’s shipbuilding share with ~39% (1960). Brazil (1980) with 47% took over. Other countries obtained 84% (2000). In 2021 (July), Turkey held 49%; others 30%, and USA 20% in the group, with 541,000 CGT or
![]()
Figure 7. The Asian49 etc. shipbuilding production in 1960, 1980, 2000 and 2021, % in m GT, for each nation in the total. Source: data from Stopford (2009) (p. 615) ; for 2021: ISL.
![]()
Figure 8. Shipbuilding activity in Japan, S Korea and China (2005). Source: data from Naftika Chronica, 2022.
0.71% globally! Historically, USA was a leading shipbuilder (1800s). This ended during the Civil War (1861-65). In 1914-1919, USA produced up to 4 m GRT, using standard ship/production methods! There were more than 50 building berths, needing 275 days to produce 1 vessel. USA, however, is well known for the mass construction of 2600 Liberty ships50, (plus 563 T2 tankers), of 10,902 (16,543) dwt each, using welding for the first time (1941-46). USA failed to compete, however, the other world shipbuilding nations, despite its generous subsidies from 30% to 50%...
11. Part VIII: The Main Characteristics of Shipbuilding
Shipbuilding is a heavy engineering industry (Stopford, 2009: 613) , and only industrialized nations51 could do it. Shipbuilding requires an expertise also in the design of ships. A great competitive advantage is to manufacture locally the steel plates, the main engine and the design plans.
11.1. The Production of Completed Ships, 1948-2020
The production of completed ships, from 1948 to 2020, in the 3 main ship-building areas: Japan, S Korea & China, was as follows (Figure 9).
As shown, the global shipbuilding started from a low level of GRTs (2.4 m) (1948), but soon reached 36 m GT (1st peak; 1975) and eventually 104 m GT (2nd peak) (2011), due to the exceptional high freight rates in 2003-2008 (Figure 10)!
As shown, the Baltic dry cargo index from round 2000 units in 1985 Jan. reached the 11,000 units mark in end-2008.
In addition, the impact of the orders, placed during 2003-2008, echoed till 202052! The Shipbuilding industry is not only cyclical, but the cycles are very long! A shipbuilding cycle lasted from 1948 to 1988 (40 years) with a peak (1975)! A 2nd cycle started in 1989, and continues in 2022, with a peak of 156 m dwt (2011)!
11.2. The Impact of the Depression Periods, 1975-1987
The shipbuilding industry depressed by the tanker crises (1975, 1979), and the bulk carriers’ one: 1981-1987 (Figure 11 & Figure 12 for 1972-1985).
As shown, (Figure 11), in 1973, the orders peaked-up at 72 m GT, with a zero laid-up tonnage (1972-1974)! The “ships completed”, after 1975, (almost 1/2 of
![]()
![]()
Figure 9. Global Shipbuilding Production in GRT & GT, 1948-2020. Source: Stopford (1989) (LHS); source (RHS) ISL, 2021, modified.
![]()
Figure 11. Annual orders & completions, 1972-1985.
![]()
Figure 12. Laid-up and broken-up tonnage, 1972-1985.
those ordered), followed the orders placed 2 - 4 years ago53! In 1978, the orders placed, of a low 6 m GT-regressed thereafter between a low of 10 m and 18 m GT (1985). The ~6 m GT orders placed (1978) were below the scrapping level of 11 m GT, meaning that they were only for a partial renewal! Scrapping reached (1985) the 20 m GT, almost twice the orders placed!
11.3. A Survey on Shipbuilding of Greek Ship-Owners, 2004 (Table 5)
![]()
Table 5. The results of a survey, carried-out among 50 Greek-owned shipping companies, 2004.
Source: “Naftika Chronica”, 2022.
12. Part IX: The Economics of Shipbuilding
12.1. A Diagrammatic Model
The shipbuilding price is determined by the interaction of the Supply (of newly-built ships), carried-out by the shipbuilders, with their Demand, created-out by the ship-owners (Graph 3).
As shown, the current freight rate is the moving power behind the demand for ship buildings! If the existing fleet is large (0T3), and the freight rate is low (0F3), the demand for building ships is also low (0NB1). In addition, the new-building price (0P3) is low. As the new-building price increases, supply increases, (up to 0NB3 = full capacity). To increase the total supply beyond 0NB3, in the short-run, this is impossible according to theory.
The yards of equal technical ability and with the lower cost “catch the worm”. If there is an excess demand in the short-run, the yards prolong the delivery. It is very probable, however, to lose business in the 2nd hand market. Also, yards with a total cost above 0P1 will accept orders only if there is a subsidy (equal to 0P1-Subsidy).
In the long-run, (meaning after the time that it takes for a new berth to be built), the supply curve has to shift to the right (shown by the arrow). Apparently, the construction of new berths is not to the interest of the yards, if the shift reduces their future ship-building prices!
![]()
Graph 3. The interaction of the freight rate market & the shipbuilding one. Source: author.
12.2. A Mathematical Model
Let a yard’s (maximum) production be determined by its production function: Qy = f(Ky, Ly) [1], where Ky = Xy + My [2] = capital plus materials, and Ly = labor [3]. To produce Qy depends on ship-owners’ demand: Dy = g(Qy) [4], given ship-building price, Py [5]. The yard’s profits are: Πy = PyQy − rKy − wLy [6], where r is the capital cost and w is the average wage. Now, Πy = g(Qy)Qy − rKy − wLy [7] and Πy = g(f(Ky, Ly) − rKy − wLy [8]. Πy is a function of Ky & Ly: Πy = h(Ky, Ly) [9] and can be drawn as follows (Graph 4).
When a yard starts, its production is low (A), and enjoys zero profits (a yard has high set-up cost in buying and preparing the land, buying machinery, carrying-out staff’s training, paying property taxes, carrying maintenance, advertisement, etc.). The S Korean shipyards e.g., for 8 years, had a capacity (in GT) higher than the “ships completed” from 76% (1969) to 89% (1962)!
After sometime, production increases, and profits finally are obtained (B)! If, however, the yard cannot raise its price due to a price war or due to competition, so that to get the maximum profit (at M), then the profits obtained will be lower (at C). Worth noting is that, at C, inputs have to increase.
12.3. The Demand for Renewal & Expansion
The Demand for newly-built ships is expansionary. The demand for replacing a number of ships55 is to maintain the status quo (Figure 13).
As shown, the demand for newly-built ships-NBS, is more volatile than that for replacement56, from year to year, as expected. At times, the demand for NBS is larger by as much as 40 m dwt (1995) something reasonable. Peaks in the expansionary tonnage noted in 1997, 2000, 2003-04 and 2006, i.e., during the boom years in freight rates, as expected.
12.4. The Demand for Newly-Built Ships
The factors that determine the demand for a newly-built ship can be (Graph 5 & Table 6).
![]()
Graph 5. The factors determining the demand for a newly-built ship. Source: author.
![]()
Table 6. The number of questions that a shipping company has to answer before deciding to order a newly-built ship.
Source: author. (*) The parity is important: in 1978, e.g., 195 Yen bought 1$; in 1984, 250 Yen could do that, and in 1987 145; in 2023 Jan. 140 Y buy 1$. (**) One factor that plays a substantial role is the price prevailing in the 2nd hand market for, say, a 5 - 10 years of age sister ship! This is so because during a boom, the 2nd hand ships are ready to “catch the worm like the early bird”.
The estimation of the condition of the market upon delivery, perhaps after 2 - 8 years, is indeed difficult! The motive, however, to order a ship is always the current freight rate, being the most decisive immediate influence on ship-owners. The selection of the yard(s) from which offers will be asked, takes into account also the opinion of company’s engineers (technical department58). They also judge yard’s experience, its level of technology and its specialization! After 1, or 2, yards are selected, specific specifications are sent, and offers are invited. The building price is the key, however, to which we turn.
13. Part X: The New-Building Price
The low new-building price is most essential, provided that ship’s order is placed in perfect timing (Goulielmos, 2021a) . In end 1996, the order book for tankers had its lowest point at about 7% on the existing fleet. Earnings, in $ per day, of a VLCC, had also its lowest point, but with a two-year delay. This means that “orders follow earnings”.
13.1. The Volatility of the New-Building Price
The new-building price has a wide margin of variation depending on demand, but not only, and this is why timing is important (Figure 14)! The degree to which such a price can be reduced is determined by the cost of the materials (e.g., the main engine covers 16% of the total cost; the steel 13%). Stopford (2009) estimated that the materials cover 56% of the total building cost (p. 639)! The labor cost59, which covers 17%, as well profits, will be reduced during a shipbuilding crisis…
As shown, the prices of 2 new-buildings changed violently, over 44 years, from below or at $8.5m to $72m! The effects of the post 1973 oil depression60, as well as the post 1979 one, are apparent.
13.2. The Role of the Fixed Cost
A yard’s overhead cost (27% of the total) is indeed high, and it has to be managed! Yards are capital-intensive industries! Worth noting is that an increased fixed cost from 0FC1 to 0FC2 reduces profits by 1/2 (Graph 6)!
13.3. The International Differences in Ship-Building Prices
There are differences in prices among shipbuilding nations (Figure 15) and this is competition! In 1987, ship-owners gained perhaps up to $250m from the lower prices charged by the S Korean yards!
As shown, a ship-owner who placed an order in Korea S61 in 1988 Oct., he/she would save $23m vis-à-vis placing it in W Europe!
13.4. Can a Price War Take Place?
This occurred62, and also turned into a credit one (Graph 7)!
Prices in Far East “were” below the Japanese cost for a VLCC, in 1976-1979, 1983-1985 (by 40%), 1987-1988 (Figure 16). Worth mentioning is that up to 1987, the Far East shipbuilding policy was to fill-up the existing capacity! As this accumulated losses, the policy changed to the one getting rid of the surplus capacity, of course at the expense of employment!
As shown, certain yards priced a VLCC $38m less than her cost (1987)! We come now to another dilemma, where China took Solomon’s decision!
14. Part XI: To Build or Not to Build for Exports?
What is the strategy of the majority of shipbuilders in 2021 (Figure 17)?
As shown, 27 shipbuilding countries (out of 36 = 75%), built ships, by as much as 60%, for exports, (in cgt; ships > 300 GT), in 2021 (out of a total of ~76 m GT). Table 7 presents the situation of each shipbuilding country.
![]()
Graph 6. The impact of the fixed cost on profits. Source: author.
![]()
Figure 15. The estimated price of a medium sized VLCC in S Korea, W Europe & Japan (end-1988). Source: data from Stopford (1989) .
![]()
Figure 16. The estimated price of a VLCC (280,000 dwt) in Far East, and her cost in Japan, 1970-1988 (parity steady). Source: data from Stopford (1989) .
![]()
Graph 7. The preconditions of a price war among shipyards, in the traditional areas, 1978. Source: author.
![]()
Figure 17. The worldwide shipbuilding countries & their %, in cgt, in building ships for exports, 2021 July (01). Source: data from ISL, 2021 (01/07).
![]()
Table 7. The shipbuilding countries worldwide and their %, in cgt, of building ships for exports, 2021 (01/07).
Source: data from ISL (2021).
As shown, 12 countries (44%), had export orders by majority (>50%). Among the 3 top ones: S Korea64 had ~71%, China PR ~54% and Japan ~19%!
15. Part XII: What Are the Benefits from Having Shipyards?
The main benefits from establishing a shipbuilding industry can be (Graph 8).
![]()
Graph 8. The benefits from establishing shipyards. Source: author. (*) This used by politicians to boost regional employment. Japan had a problem to cut employmment at the start from its policy for lifetime employment!
As shown, one reason for establishing a shipyard industry is to manufacture an export product, and to obtain revenue, and foreign exchange. In Greece sea transport imported 23b euro (est.) (2022). A 2nd reason is to provide employment, especially in poor coastal regions (Figure 18). In Greece the sea transport employs about 200,000 people and contributes about 7% to GDP.
As shown, the worldwide employment in shipbuilding varied from 515,000 in 1975 to 224,000 in 1987, taking into account only 3 main shipbuilding areas! Japan held the lion’s share in 1975, with 300,000 employees (Figure 19).
Worth noting is that in Japan, the employment provided by the sub-contractors and related industries stayed almost intact at 105,000 employees an additional benefit! Another benefit accrues from the relationship between shipbuilding and ship-repairing, ship-modifications and dry-docking, as well constructions required for defense and other needs beyond shipping (metal bridges, trains etc.)! Shipyards nowadays may obtain a competitive advantage by building ships friendly to sea environment (adding e.g., scrubbers) conforming to IMO’s regulations vis-à-vis the new fuel.
16. Further Research
• How much port costs increase CIF price? Should ports charge depreciation for docks, wharves, piers, quays, etc., based on a “cost recovery theory”?
• Do immigrants contribute65 to their host-country?
• Is it true that “the larger the fleet owned by nationals, the larger it has to be the national shipbuilding industry”66?
![]()
Figure 19. The employment in Japanese yards, 1978-1984.
• Will the new trade routes, in 2022-23, due to sanctions on Russia favor Mediterranean shipyards?
• Why shipbuilding cycle is much longer 40 years on average than the shipping one (~10 years or so on average)?
• What is really the minimum efficient scale of a shipyard? Micro-economists determined theoretically the minimum (efficient) scale (Besanko et al., 2017: p. 57, 237) ! They argued that if a firm, and thus a shipyard, wishes to exhaust economies of scale, it has to produce there.
• What is the shape of the average cost curve of a Shipyard? Is it like number 1 ( Figure FR1), as often depicted by economists, or like number 2 or 3?
• Is globalization a solution for a mature shipyard, meaning to transfer all portable machinery etc. to a cheaper country (in labor and power) and produce there?
• Why UK did not “copy” the fellows Americans, who, by 1946, built 2710 Liberty ships, of which one67 built in ~5 days (4 days, 15 hours and 26 minutes from the time of keel-laying) ( Figure FR2, Figure FR3)?
• Is it true that shipyards can re-obtain their lost competitive advantage by building ships, which now respect sea environment complying with IMO’s regulations, & adding scrubbers on ships e.g., in a rather efficient and cheaper way?
![]()
Figure FR1. Two different average cost curves. Sources: inspired by Martin (2010: p. 132) and Besanko et al. (2017) . The MES of a shipyard in CGT equals √F/d, where F stands for the fixed cost and d is the parameter of any diseconomies of scale (proof in Martin, op. cit., p. 300-2).
![]()
Figure FR2. The construction of each liberty had to be done within a certain time68.
![]()
Figure FR3. Various constructions commissioned to 11, at least, yards at the same time! Source: author’s archive.
17. Conclusion
The “gifts of Nature” gave Adam Smith the idea for nations to specialize in what they were efficient. Mercantilists wanted to create a favorable Balance of Trade, so that the silver/the gold to pour into UK! This meant a strong merchant marine to connect the very distant colonies with Metropolis! The British killed 3 birds with one stone: exporting industrial products “made in G Britain”; importing raw materials from colonies and expanding their liner shipping!
Stopford (2009) (Chap. 15) persistently correlated the destiny of the UK shipbuilding to the destiny of the UK fleet! For this there is only one explanation: “all UK ship-owners ordered ships exclusively in UK shipyards, by trust or tradition!” As they used to do!
The resort to sea economy, in a more fair, legal and organized way, was inevitable to happen, given the steady increase of global population, arriving soon at 8b mouths! Colonies one day, would claim their liberalization, as they did, becoming also UN members! The law of the Sea in 1982 opened to the citizens of the sea (the coastal people), the sea economy.
Shipyards have to see who orders ships worldwide, and from them of course the dearer ones, and try to attract him/her, no matter his/her nationality. Greeks ordered 17.3 m dwt in 2022. Matters of foreign currency are secondary, as well the intention to support domestic ship-owners, if they are not competitive!
Ship-owners, as a rule, during a boom, order ships, do not lay-them-up or scrap-them-up! In a depression, they lay ships-up and scrap them-out and refrain from orders, except for careful and conservative replacements! This scenario proves that the level of the freight rate determines the level of ships on order!
Most important of all is to control the shipbuilding cost and avoid revaluation! This is the most difficult operation as labor will always claim wage rises. It is more profitable if the main engines, steel plates, etc. are not imported.
NOTES
1He was a chief economist of the London Port Authority.
2Smith spent 12 years to write the “wealth”!
31961 reprint of the 1920 edition (p. 241).
4Known for his “tableau economique” (1758).
5The “wealth” identified by Smith is today’s GDP.
6Environment; Safety & Security (of Ships & Ports); Short Sea shipping (sea transport intra EU); intermodal & logistics.
7Port costs exploded after 1950. One should expect the same port cost for the same services: but at Rotterdam a vessel paid $76,000; at Ras Tanura $7000 and at Yokohama $31,000 (1992) (Alderton, 1999: p. 224) !
8Endowments are the freely given “material phenomena” of nature within the boundaries of men’s activities (Pearce, 1992) : fertile land; oil; coal; gas; other cores/mineral deposits; natural forests; rivers & rainfall.
9Autarky is a situation where a nation isolates itself from the international trade by imposing mainly tariffs so that to become self-sufficient.
10Gifts of nature also are the: winds, waves, sun, nuclear power, fertilizers, steam, electricity, water, etc., and the new “material matters”: lithium, indium & selenium (listed in “Nature” in 2020). Imagine a new material for building ships: lighter, stronger & cheaper than the very dear nowadays steel plates! Lithium is obtained from water and is very cheap used in nuclear experiments!
11The gold/silver kept by the Central Bank is, no doubt, important. Economists can make the national products cheaper by a clever technical maneuver: devaluing the currency! This makes exports cheaper, and shipbuilding prices lower!
12Four industrial revolutions occurred so far, the 5th being the “digital one”, under way, aided by the smart phone.
13The Chinese are proud for their Great wall, near 8900 km long, from Gansu to Manchuria, built between 221 and 771 BC. Greeks are also proud for “Acropolis”, another wall!
141852 km = 1 n. m. Greece e.g., has a territorial sea of 6 n.m. (11.11 km).
15Mc Gonigle R M & Zacher, M W (1979): “Pollution, Politics and International Law”.
16The “State Oceanic Administration” established in China in 1964.
17Zhijie, F & Cote, R P, (1990), “Coastal zone of PR of China: management and institutions”, Marine Policy, pp. 305-314.
18OECD, 1989: “Fisheries issues: trade & access to resources”. Since 1977 the countries asked for an EEZ of 200 n. m.!
19Mason, C M, (ed.), (1979): “The effective management of resources”.
20The Law of the Sea underwent 2 rounds before 1982. See the “Sea Use” program (in Marine Policy, Jan. 1980).
21Canada, USA, Netherlands, Norway & in the Universities of Dalhousie, Virginia & Piraeus (1992).
22The gas & oil in the North Sea saved sterling, and made Norway twice rich! Greece is trying to find oil/gas in the Aegean Sea, but this caused the envy of Turkey: Kariotis, T.C. (1990). “The case for a Greek EEZ in the Aegean Sea”, Marine Policy, Jan. 1990.
23In 1983, 81 nations out of 137 (59%), had such a sea limit. By 1998, the parties were 124 to the LOS Convention. The coastal state can carry a “ship inspection” in its contiguous zone (article 33)!
24Lovejoy, D. (1996). “Are there limits to growth? The need for a transition to a solar-based economy”, Natural Resources Forum, Vol. 30, pp. 73-77.
25Meaning: to maintain the services & the quality of natural resources over time.
26Mesopotamia is a strategic area.
27He argued that each person trying to promote his own interest is promoting that of the society…
28USA is a country, we believe, where applied research is 20 years ahead, including UK, having only a 15-year gap. The economic growth of Germany (and Japan) based on USA imported technology. In end-2022 (05/12) Americans discovered the way to obtain “clean” energy, the way done by Sun/Stars! In the “National Ignition Facility” they used 192 sets of laser rays to produce 3.15 units of energy, (in a nuclear fusion experiment), spending 2.05 units! This is superior to EU “tokamak” method spending 10 units to get 6.7! This is based on the principle that mass & energy are mutually convertible: Energy = Mass c2, where c is the velocity of light in cm/sec. The isotopes of hydrogen deuterium and tritium were used, avoiding the beta and gamma rays! This will save eventually humanity!! Imagine a vessel with own energy…
29One benefit is to reduce unemployment. A 2nd is when these brains, in the long-term, get influential political positions & support the lawful interests of their mother country (e.g., Greece v. Turkey)! A 3rd especially in the past, is remittances.
30Ports had to: expand as ships become longer, to have proper draughts, to treat ships with stronger, faster, etc., cranes. These costs have to be recouped, over their useful life...
311 GT = 1.5 dwt on average, and this is rather on the low side; 1.3 is nearer reality.
321 cgt = 2.36. dwt.
33Average size: ~79,000 dwt; average age: 10 years; ships > 1000 GT on UNCTAD figures (01/01/2022). In 2014, Greece had ~15% share. Japan had ~11% from 14% & so fell in the third position. China had 9% and ~13% and so arrived 2nd!
34Greece owned according to Clarksons, 5895 ships (*); China 11,693; Japan 9018; S Korea 2968; USA 4999. The world owned 104,232 ships of 2.2b dwt (01/11/2022). (*) 1 GT = 1.53 dwt.
35The parity issue is complex one, because a revaluation of the currency harms exports & shipbuilding, & reduces home employment, but it reduces the deficit of the Balance of Payments.
36“Hyundai Shipyard” sent me its book: “Traditions of excellence”, published in 1998. Hyundai to mark her 50 years activity, renamed, in end-2022, to “Heavy Industries Hyundai”= HI Hyundai.
37A 380 m dry-dock to serve ships up to 400,000 dwt. In end-1998, HHI worked with 165 ship-owners from 37 countries. Hyundai as I remember, was anxious to attract the orders of Greek ship-owners. Greeks were careful in placing orders for its technical ability. The Greek Livanos was the first to order ships in 1974-end, followed by Niarchos (1983). In 1984 and thereafter orders placed by: Comninos Bros; Diana (1985); Efploia 1986; Ceres 1987; Eletson 1992; Anangel 1993; Chios 1994; Economou 1995; & Sea Justice 1997.
38A 530 m dry-dock to serve ships up to 1 m dwt.
39Obtaining the 1/4 of shares (1995).
40In end-2022, Hyundai quoted increased prices, and together with the economic headwinds prevailing, this resulted in lower volumes of orders estimated at about $23b.In 2011, the ships completed, were ~39 m dwt falling to 20 m (2020) and increased to ~26 m (2021) (July 1st)40.
41Japan built first 100 fishing vessels (1947) by priority & many coastal ships serving the national needs first!
42Japan asked & obtained from USA, 91 ships of the liberty type. Japan also recovered/repaired about 980 ships (war wrecks) & used many of them!
43Japan, in 1953, built 50 ships to carry-in iron-ore.
44Foreign ship-owners had to pay 40% - 50% in cash and the balance in 3 - 5 years (1955).
45The quality of the materials used was inferior (also the main engine, the boiler, electrical components, etc.) compared with those in USA & in certain European countries.
46Plus the Vietnam War.
47The engine room during the night was unmanned. Its control made from the bridge.
48The Japanese labor had free houses, fringe benefits (for the family, continuous training, insurance & gifts).
49India decided (2022-end), to boost the activities in its 28 yards, where the majority belongs to private interests. India plans to provide subsidies and lower taxes as well finance, but apparently to nationals…
50About 1400 liberty ships joined the US reserve fleet!
51The “Shipbuilding Europe” (1960) was: Belgium, Denmark, France (8% in total Europe), Germany FR (20%), Italy (8%), Netherlands (12%), Spain, UK (23%), Finland, Norway & Sweden (13%) (= 84%).
52The ship completions reached 58 m GT 12 years after 2008.
53The lag is not fixed, depending on demand.
54Given the finance provided by “China State Shipbuilding Corporation” & “China shipbuilding Industry Corporation” & by other banks.
55This is due mainly to scrapping, selling, accidents, ship’s age, speculation...
56This happened in 1987 with containerships: Fossey, J. (1987). Fleet growth slows as replacement tonnage leads new orders, Containerization International, 51-53.
57Clever ship-owners charter the ship to be built in a long term. Also they build her according to the recommendations of the charterer to be. This is so, because the delivery of a new-building may coincide with a market fall (the Colocotronis case).
58The previous experience with a yard also counts.
59The Japanese used the amount of the unemployment benefits of some 227,000 shipyard workers to…subsidize building prices in the 1970s!
60Due to the Yom Kippur war, the price of oil doubled (09/1973). Nations tried to keep under control their parities to the $, at ±2.25% (1971-1973). In 1979, the Iranian revolution occurred as well the Iran-Iraq war (1980-1988). The oil price doubled again!
61Korea S’ shipbuilding $ cost increased by >40% since 1985-6, due to massive wage increases. This coupled by the revaluation of won, as well the rise of the cost of steel plates imported from Japan.
62During the price war, lower prices are used to reduce competitors’ profits, but this reduces also entrant’s ones.
63India (end-2022) was ready to support domestic ship-owners with 50 new-buildings including small ones using batteries.
64Korea S started with a low % of exports, 14%, on total completions in 1973, which increased to 97% in 1975 (peak), and fell to 58% in 1979.
65Here come to our minds the names of Karatheodori the mathematician (W Germany), and Papanikolaou the doctor, “test Pap” (USA) father.
66Quite a number of Greek ship-owners established their own yards! The only benefit of yard-owners, and ship-owners at the same time, was, to build ships for their own account, cheaper and faster (Niarchos case-study) (Goulielmos, 2021b) ?
67Named: “Robert E. Perry”, hull 440, 12/11/1942 (Bourneuf, G, 1990, “Workhorse of the Fleet”: a history of the design and experience of the Liberty Ships built by American Shipbuilding during WW II, ABS).
68If not, the rope, forbidding the ship from launching, had to be cut!