Statistical Analysis of Small Holder Farmer Financial Exclusion: Case Study of Migori County, Kenya ()
1. Introduction
A small holder farmer is generally understood to be one that farms on a small piece of land, often taken as 2 ha or less, and largely for subsistence; however, this size threshold varies from country to country, depending on the prevailing ecological and demographic conditions; for example, in Kenya, it is about 0.5 ha. According to the Food and Agriculture Organization of the United Nations (FAO), there are about 600 million small holder farmers in the world, and in developing countries, such farmers produce about 80% of the food consumed there [1]; in Kenya, such crop farmers are estimated to be about 3.5 million [2]; the farming activities of such farmers are therefore critical to the economies of their countries, and to the global food security. However, these farmers face the challenges of limited access to credit, often due to the fact that many of them farm on unregistered land that cannot be offered as collateral to lending institutions; but even where they are on registered land, the fear of losing such land should they default on loan payments often prevents them from applying for farm credit; and even if they apply, they still get disadvantaged by low credit scores (measure of credit worthiness). The result is that due to this financial exclusion they are often unable to use optimal farm inputs such as fertilizer, and good seeds among others. This depresses their yields, and in turn, has negative implications for the food security in their communities.
Looked at globally, this state of affairs is a big contributor to world food insecurity, and an impediment to the realization of the UN Sustainable Development Goal no. 2 (No hunger) [3].
2. The Concept of Financial Exclusion
Financial exclusion describes a situation where people are unable to access financial services such as bank accounts and credit extensions because they are deemed to be too high risk [4].
Financial exclusion is caused by demand side (e.g. low income, no credit history, poor social status etc.) and supply side (e.g. lack of insurance, lack of regular banking facilities etc.) barriers to financial inclusion.
There are two main consequences of financial exclusion:
• Financially excluded people find it harder to raise money when they need to; hence they are unlikely to improve their financial status over time, and the quality of their lives remains low in the long term.
• People who are financially excluded go on to become more socially excluded as time passes by; for example they are unable to access jobs that require bank accounts to pay them, and so they become less significant in society.
The financial exclusion of small-scale farmers is of particular significance in the developing world where it impacts negatively on the availability of life’s key necessity—food.
World Bank studies show that most such farmers in Sub-Saharan Africa are only able to receive payments for their agricultural produce in cash [5].
3. The Study Area
The study was conducted in Migori County of Kenya, illustrated in Figure 1. The County lies between East longitudes 33˚55'42'' and 34˚43'50'', and latitudes −0˚39'06'' and −1˚23'21'', and has a population of approximately 1.2 million
people [6]. Migori has two main rainy seasons, March to May and September to November, and this study targeted the maize planted in the second season, maize being Kenya’s staple. The main economic activity in Migori is farming except in the sub-county of Nyatike, which borders Lake Victoria and hence most people there are engaged in fishing; The study was therefore focused on the remaining seven sub-counties of Suna East, Suna West, Kuria East, Kuria West, Uriri, Awendo and Rongo. This study area was chosen due to ease of access for field research, and also the prevalence of small scale maize farmers who don’t actually own the land that they farm on.
4. Study Objective
The main objective of this study was to identify small holder farmers in Migori county, and then, through statistical analysis, to determine whether they were financially excluded or not, and to what general extent.
5. Questionnaire Survey
Small scale farmers were identified, and relevant data collected from them, through a field questionnaire survey conducted in all the eight sub-counties of Migori County. The total number of questionnaires administered, completed and returned was 320; of these 5 were administered to agricultural financial institutions such as banks and other credit institutions. The sample sizes for the county and sub-counties were computed in proportion to their population sizes.
The data collected included personal information (such as name, identification, gender, age and presence or absence of a bank account), occupation, any assets, type of agricultural produce and access to credit. Financial institutions on the other hand were asked to provide information on their lending practices and their use of credit scores.
6. Statistical Analysis
6.1. A Key Question
A key statistical question that needed to be answered was whether the small scale farmers of Migori are indeed financially excluded or not. Questionnaire responses from the financial institutions, and from the farmers themselves, indicated that one needed to have a bank account and collateral to qualify for credit. The following farmer variables were therefore selected for the subsequent statistical analysis.
• Gender
• Age
• Bank account (presence or absence)
• Credit
• Collateral
• Credit access
6.2. Data Exploratory Analysis (EDA)
An EDA was carried out in order to determine the variation that occurred within the data variables, and also the associated correlations.
1) Variations
Variation is the tendency of the values of a variable to change from measurement to measurement [7]. In this case a frequency cumulative plot was employed to visualize the distribution of the dataset, as shown in Figure 2; it was generated using the R code shown in Script 1.
2) Mapping Outliers
To discover outliers in the variables selected, the R code shown in Script 2 was used to generate the boxplot that is presented in Figure 3.
3) Correlations
Statistical correlation measures the extent to which two variables are linearly related (meaning they change together at a constant rate) [8].
The R code shown in Script 3 was used to generate the correlations shown in Figure 4.
Figure 4 indicates that there are no obvious correlations between the variables.
![]()
Figure 2. Frequency cumulative plot showing how values are distributed in the given fields in the dataset.
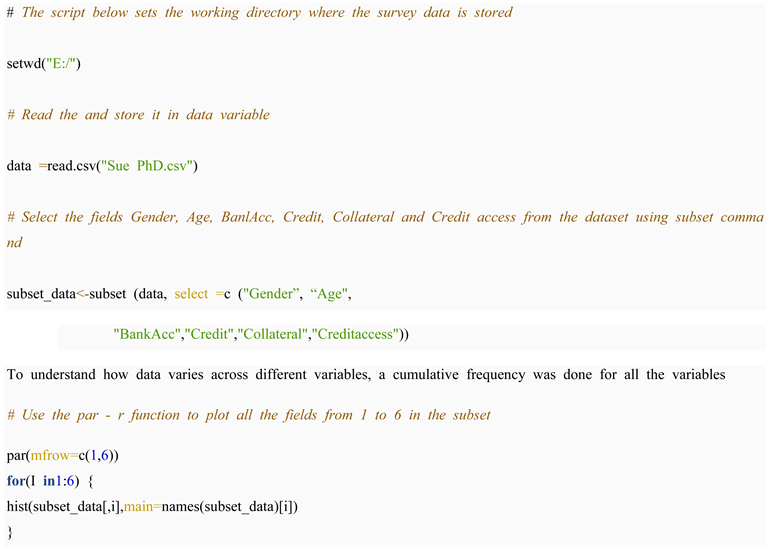
Script 1. For data frequency cumulative plotting.
![]()
Script 2. Data outlier mapping.
![]()
Figure 3. Box plot showing fields with outliers.
![]()
Script 3. Data correlation mapping.
Further examination of the density distribution of each variable broken down by Credit availability value was then carried out, as per Script 4.
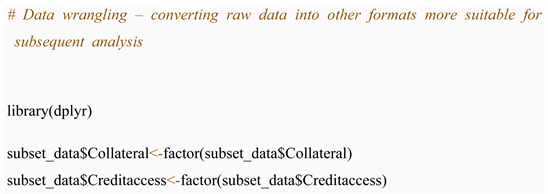
Script 4. Data wrangling.
6.3. Modeling
A logistic regression model was used to determine whether the Migori farmers were financially excluded or not, via a hypothesis test. The logistic regression was selected due to its suitability for modeling binary variables. To model that farmers are financially included, an assumption was made that there is a relationship between being given a loan if you have collateral versus being denied a loan because of lack of collateral.
Based on this Logistic regression model assumption, the null and alternative hypotheses respectively were stated as follows.
H0: β0 = 0: There is no association between being granted a loan and having/lacking collateral, the odds ratio is equal to 1.
H1: β1 = 1 There is an association between being granted a loan and having/lacking collateral, the odds ratio is not equal to 1.
The R code shown in Script 5 was used for fitting the model to the data, and the results are shown in Table 1.
From the model summary in Table 1, Collateral 4 and the intercept are statistically significant since they have a p-value of less than 0.05.
Odds Ratios were then computed at 95% Confidence Interval using the R code shown in Script 6 and the results are shown in Table 2.
Finally the model coefficients were computed using the R code shown in Script 7.
After testing the null hypothesis that there’s no association between credit and collateral, the null hypothesis at the 0.05 alpha (significance) level where the z statistic is 5.327 and p-value is 9.99e−08 (refer to Table 1) is rejected.
The results show that, on average, the odds of getting credit with a group of different pieces of Collateral e.g. Title deed and Car is 7.1099742 times more than for no or one Collateral.
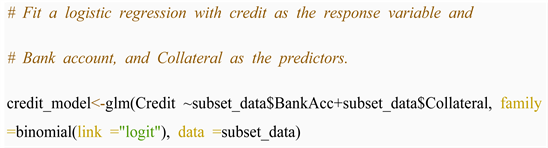
Script 5. Model fitting.
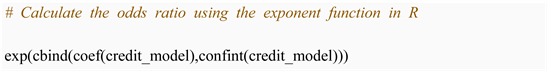
Script 6. Odds ratio computation.
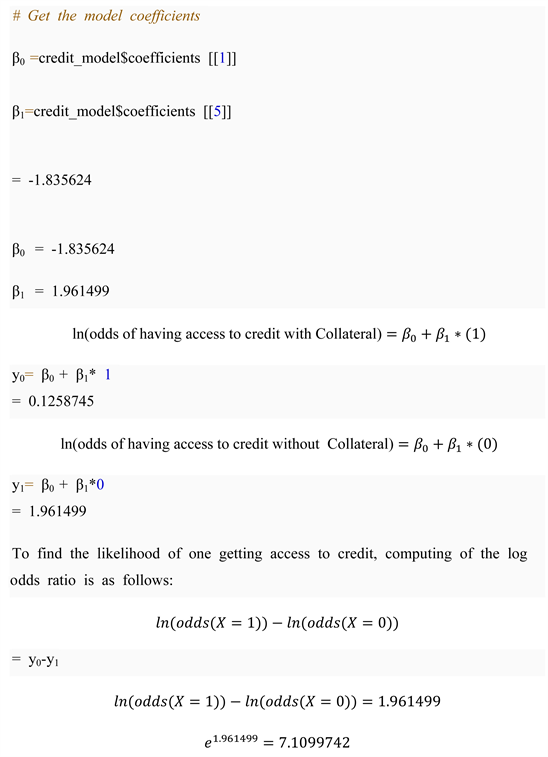
Script 7. Model coefficient computation.
It is therefore concluded that there is sufficient evidence to reject the null hypothesis and to accept the alternative hypothesis. This means that Migori farmers cannot get credit without multiple pieces of collateral, hence they are financially excluded.
As for the extent of exclusion, the questionnaire response descriptive statistics indicated that only 20% of the farmers have titled land under their names, which they could use as collateral. The same statistics further showed that nearly 45% of the farmers do not have any of the items that lending institutions will accept as collateral; In addition the same descriptive statistics also showed that nearly 60% of the farmers have no bank accounts. All this evidence therefore points to the fact that Migori farmers are financially excluded to a large extent.
7. Conclusion
From the results achieved, this paper has demonstrated clearly that indeed, small holder farmers are financially excluded in Migori County. As such, there is need to introduce new techniques for accommodating such farmers in order to improve food security. Introduction of the use of non-financial data to complement the financial data that is currently collected by financial institutions could assist these farmers to carry out their farming activities by making them more competitive in credit rating.
Acknowledgements
The authors acknowledge the Gandhi Smarak Nidhi Fund (GSNF) and the Artificial Intelligence for Development (AI4D) programme (Funded by the IDRC and SIDA, and managed by the African Centre for Technology Studies (ACTS)) for providing the funding that enabled this research work.