A Semi-Vectorial Morphological Segmentation Multi-Component Images of Coumarins on Thin Layer Combined with Laser for Better Separation ()
1. Introduction
Plants have always been a major and essential source of food and medicine for humans. Even today, a majority of the world’s population, particularly in developing countries, is treated only with traditional herbal remedies [1]. From aspirin to taxol, the modern pharmaceutical industry itself still relies heavily on the diversity of plant secondary metabolites to find new molecules with novel biological properties [2].
This is why researchers in the field of natural substances are directing research towards the separation of secondary metabolites contained in plants, in particular coumarins, through a method carried out on a thin layer. However, this separation is done manually in a slow and laborious way.
The challenge faced by experts in thin layer compound separation is to make it faster through several methods including that based on compound frontal ratio and thin layer developers [3]. However, the work of Datté et al., 2008 presented two different coumarins but with the same frontal ratio. In order to overcome these shortcomings, it is therefore necessary to resort to other methods based on morphological segmentation.
It is a particularity of signal processing whose objective is the transformation of digital images, with the aim of improving their quality and/or extracting information from them. In the field of digital image processing, segmentation plays a major role. It consists in extracting image primitives, either of contour type or of region type [4]. These primitives are exploited to perform pattern recognition, matching, compression, etc. Classification segmentation consists of partitioning a set of vector attribute pixels into k disjoint classes. Each class groups pixels with characteristics as similar as possible [5]. Indeed, the pixels of a region having an average value per channel in RGB higher than a certain value (threshold) T1 and lower than a second value T2 are classified as object recognition pixels which can be used for the separation and the identification of coumarins.
The approach for the automatic identification of secondary metabolites (coumarins) that we propose in this article, based on the segmentation by regions of the digital image integrating the coumarins to be identified, is an extension of the automatic identification of secondary metabolites. Parameters such as average pixel color on each channel, color entropy on each channel, standard deviation, equivalent distance, etc. of the different regions are calculated.
The values obtained are stored and form a database. From this database, an algorithm is developed and executed on Matlab software version 2016 [6], thus making it possible to perform the semi-automated and rapid identification of coumarins.
For the understanding of this work, the document is organized as follows: in Section 1, we present the photochemical screening and the image acquisition integrating the coumarins, the digitization, the filtering of these images and the calculation of the parameters, then in Section 2 we present the results of the different parameters calculated on the channels, finally in Section 3, a theoretical and experimental validation of our approach is presented. We conclude with some perspectives for future work.
2. Materials and Methods
2.1. Materials
2.1.1. Chemical Reagents and Apparatus
All chemicals used are analytical grade. The solvents and reagents used were purchased commercially from Polychimie (Côte d’Ivoire). For the separation of secondary metabolites on a thin layer, we used chromatoplates (thin layers) in silica gel 60 F254 on an aluminum support.
The different devices used for our analyses are as follows:
• A RETSCH brand electric grinder, type SM 100
• A Sartorius scale (Germany)
• A Burchi RII rotary evaporator
• A magnetic stirrer
• A UV-Visible spectrophotometer
• A camera
• Spatial resolution: 2448 × 3264 (8 M pixels)
• Tonal resolution: 24 bit (color)
• Color space: RGB
• Camera model: Infinix
• Focal length: F/2
• Exposure time: 1/13 seconds
• ISO Sensitivity: ISO-864
• Focal length: 4 mm
• Image format: JPG image
• A UV lamp (366 nm, 254 nm)
2.1.2. Plant Material
The plant organs mainly composed of leaves were all harvested from the forest relic of Nangui Abrogoua University in Côte d’Ivoire (see Figure 1). The plant species were identified in accordance with the herbaria available at the Center National de Floristique (CNF).
![]()
Figure 1. (a) Leaves of Solenostemon m.; (b) Leaves of Desmodium adscendens; (c) Leaves of Baphia nitida Lodd.
2.2. Methods
2.2.1. Selective Extraction of Secondary Metabolites (Coumarins)
The hydroethanolic extracts of the different leaves were treated respectively with 3 × 20 ml of hexane 95%, chloroform, ethyl acetate and n-butanol. The different organic fractions were concentrated under reduced pressure on a rotary evaporator and then stored in the refrigerator. Thus, for each crude extract, selective extracts are obtained distributed as follows: hexane, chloroform, ethyl acetate and n-butanol which were used for the phytochemical screening.
2.2.2. Photochemical Screening, Image Acquisition and Digitization
The photochemical screening was carried out according to the analytical procedures described in the works of [7] and [8].
Drops of each selective extract are deposited using a capillary on the points (01 cm apart) of the base line drawn 1 cm from the bottom of the thin layers (silica 60 F254). The deposits are left to dry for a moment before introducing the thin layers into the chromatography tank containing the migration solvent. After migration and drying using a hair dryer, the chromatograms are revealed with reagents specific to the phytochemical groups sought, then visualized in the visible then under a UV lamp at 366 nm (see Figure 2). The different developer systems used are:
• Hexane/AcOEt (20:4; v/v) for the hexane fractions.
• CHCl3/AcOEt/hexane (10:10:5; v/v/v) for the chloroform fractions.
• AcOEt/CH3OH/H2O/CHCl3 (18:2.4:2.1:6; v/v/v/v) for the ethyl acetate fractions.
We used Formula (1) to improve image quality.
(1)
• Sxyλ is the capture of the image transmitted by the sample on the plate;
• Rxyλ is the capture of the image of the empty plate; so-called reference measurement;
• Bxyλ is the capture of the image by obstructing the passage of light: measurement known as background noise [9].
![]()
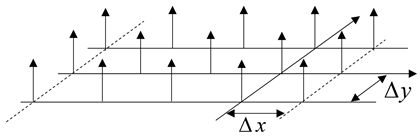
Figure 2. General diagram of image acquisition on the thin layer.
Digitization is carried out using the two-dimensional comb of Dirac-
:
: Intensity associated with the pixel (m, n) and quantified over a number q of bits
: Sampling step in X direction
: Sampling step in Y direction
: 2D Dirac comb
2.2.3. Improved Segmented Regions and Settings
f is the image to be filtered (or enhanced) and g the spatial filter, we have:
G is the transfer function of the filter. The digital image being essentially discrete (pixels and gray levels), we presented the filter in the discrete case. On each digital image, we did not do a global convolution but a local transformation based on the neighborhood of a point (Figure 3).
The improvement of the image was also done through the median filter [10]. In Figure 4 we present the original image and the filtered image.
In order to remove more noise, we can average more values around each pixel, Figure 5.
The distance most naturally used to recognize objects in the image is the Euclidean distance [10], defined for two vectors
and
of IRn by
![]()
Figure 3. Local convolution of the digital image.
![]()
Figure 4. (a) Original image; (b) Enhanced image.
![]()
Figure 5. Increasingly strong median filtering. (a) Original picture; (b) Median over 25 pixels; (c) Median over 49 pixels.
which has values in IR, or and are called respectively real, rational or discrete distances. The normalized value of the Euclidean distance is given by the relation
for making decisions from the coordinates of vectors in a database [10].
The estimate of the Shannon entropy of a probability density p in the continuous framework is given by:
The Ahmad-Lin estimator of the entropy of p is written:
with n the number of points in the sample.
In the context of image segmentation, we therefore consider the characteristic f of the image and p its probability density over a region Ω of the image. The expression of the entropy of p on the region Ω of the image is given by:
Entropy can then be considered as a measure of homogeneity of light intensity over a region of the image.
3. Results and Discussion
3.1. Acquisition of Images on the Thin Layer
For each extract, we obtained digital images on the thin layers. Figure 6 shows some of the images obtained.
3.2. Parameter Calculations
We segmented each spot from the images in Figure 6, then calculated the average color, standard deviation, color entropy using the algorithms coded in Matlab 2016 version running on Microsoft Windows 10 pro on an Intel i3-based PC. Figures 7-9 illustrate the segmentations of the different spots of the images
![]()
Figure 6. (a) Chromatogram under UV at 366 nm of chloroform, extracts; (b) UV chromatogram at 366 nm of hexan extracts.
![]()
Figure 7. (a) Color sub-image; (b) Array of 3 × 3 size values of each channel.
![]()
Figure 8. (a) (b) Segmentation of spots under UV 366 nm corresponding to families of molecules; (a’) (b’) Segmented spots of molecule families.
used. We finally created a database with the values of the parameters of each spot (region). The spots correspond to terpenes previously identified by the manual identification technique based on developers.
• Average pixel color
Each spot on the thin layer is a digital grayscale image and an array of values. Each cell of this array, which stores a value, is a pixel. By noting n the number of rows and p the number of columns of the image, we thus manipulate a table of n × p pixels. Figure 7, left, shows a visualization of a square array with n = p = 240, which is 240 × 240 = 57,600 pixels. For an image, we can therefore calculate the average color Ie of pixels characterizing this image [11].
Algorithm (a) below calculates the average pixel color of the spots. (see Figure 8)
b=imshow(im1);
im2=rgb2gray(im1);
h=imfreehand; (a)
bw=createMask(h,b);
figure,imshow(bw)
ht=regionprops(bw,im2,'MeanIntensity');
at=ht.MeanIntensity
• Standard deviation (std):
Algorithm (b) below is used to calculate the standard deviation of the spots. (see Figure 8)
b=imshow(im3);
im2=rgb2gray(im3);
h=imfreehand;
bw=createMask(h,b);
figure,imshow(bw) (b)
ht=regionprops(bw,im2,'PixelValues');
ap=ht.PixelValues;
s=std(double(ap))
• Entropy:
Algorithm (c) below calculates the average pixel color of the spots. (see Figure 8)
b=imshow(im4);
im2=rgb2gray(im4);
h=imfreehand;
bw=createMask(h,b);
figure,imshow(bw) (c)
ht=regionprops(bw,im2,'PixelValues');
ap=ht.PixelValues;
E=entropy(ap)
3.3. Parameter Values
For a stain on the thin layer, we identify the corresponding terpene by the traditional method using developers and for this stain, parameters are calculated constituting a database and corresponding to this terpene. Parameter values for terpenes are reported in Tables 1-4.
![]()
Table 1. Values of the coumarin parameters of the hexane fraction.
![]()
Table 2. Values of the coumarin parameters of the chloroform fraction.
![]()
Table 3. Values of the coumarin parameters of the ethyl acetate fraction.
![]()
Table 4. Coumarin parameter values of the n-butanol fraction.
In order to show if the properties of a molecule (coumarins) are the same for the different fractions, we have represented the values of the properties according to the molecules. Figures 9(a)-(c) represent the average color of the pixels of the terpenes of the four fractions, the standard deviation of the four fractions and the color entropy of the molecules of the four fractions, respectively.
From the different values of the parameters of the four (04) fractions, i.e. the hexane, chloroform, ethyl acetate and n-butanol fractions recorded in Tables 1-4 we obtained curves. Figure 9(a) corresponds to the representation of the average color of the spots resulting from these four fractions according to the molecules. This figure allows us to affirm that the value of the average color does not depend on the fraction, the curves of the fractions being almost superimposed [12]. Figure 9(b) corresponds to the representation of the standard deviation of the spots resulting from these four fractions showing the similarity between the values of the standard deviation, the curves being almost merged. The same observation is made in Figure 9(c) corresponding to the representation of entropy as a function of molecules. Figures 9(a)-(c) allow us to show that the identification of the molecules corresponding to the spots does not depend on the fraction.
The different representations show a quasi-superposition of the different curves of the hexane fraction, chloroform fraction, ethyl acetate fraction and n-butanol fraction. The gap between the different curves is reduced compared to the gap between the curves when we isolate the spots by considering the actual contours of the spots.
The results allow us to conclude that if the isolation is done closer to the center of the spots, the values of the properties are practically identical for the different fractions. Thus the spots integrating the terpenes will have the same values of the parameters if we isolate the spots closer to the center of it.
3.4. Development of the Identification Program
For the different fractions, the parameters have the same values, which allows us to develop the identification program below (see Figure 10).
![]() (a)
(a)![]() (b)
(b)![]() (c)
(c)
Figure 9. (a) Medium color according to the molecules of the fractions; (b) Standard deviation according to the molecules of the fractions; (c) Color entropy as a function of fraction molecules.
We proceeded to verify the presence of coumarins, in particular samidins, in the hexane fraction of the leaves ofDesmodium adscendens.
The manual identification protocol on thin layer being the same, we made the segmentation of the different spots on the thin layer (see Figure 11). We then calculated the various parameters including color entropy (Entropy), standard deviation (std) and average pixel color (MeanIntensity) [13]. We obtained the results recorded in Table 4. These values correspond to terpenes in the database.
The distance used to recognize the objects in the image is the Euclidean distance [13], defined for two vectors
and
of IRn by
which has values in IR,
or
and are called real, rational or discrete distances respectively. The normalized value of the Euclidean distance is given by the relation
for making decisions from the coordinates of vectors in a database.
The values of the average pixel color, the standard deviation of each component, the entropy per color component of the four fractions of the compounds are recorded in Table 5.
Table 5 confirms the presence of samidine, pimpinellin, visnadine, angelicine, in the leaves of Desmodium adscendens. For example we have the values of the average color (atR = 91.20; atG = 114.5; atB = 213.21), of the standard deviation (sR = 1.58; sG = 3.52; sB = 2.62), entropy (HR = 2.51; HG = 2.14; HB = 2.47) which correspond to the values of the Samidine parameters. The values (atR = 74.14; atG
![]()
Figure 11. (a) Segmentation of the first task, (b) Second task, (c) Third task, (a’) First task, (b’) Second segmented task, (c’) Third segmented task.
![]()
Table 5. Leaf segmentation parameter values of Desmodium adscendens.
= 87.21; atB = 75.89), of the standard deviation (sR = 59.54; sG = 13.54; sB = 12.58), of the entropy (HR = 6.08; HG = 4.12; HB = 4.80). These values identify the angelicines in the leaves of Desmodium adscendens. These coumarins have already been identified by the traditional method with the same plant in the work of [14]. These results show the reliability and robustness of our identification approach and its simplicity in its implementation.
3.5. Discussion
The automated identification of coumarins on a thin layer that we carried out on the digital images allowed us to identify a few molecules present in a hexane, chloroform, ethyl acetate and n-butanol extract. However, values of the mean color (atR = 87.01; atG = 41.05; atB = 54.01), of the standard deviation (sR = 6.47;sG = 3.58; sB = 4, 11), entropy (HR = 8.74; HG = 3.46; HB = 5.08) do not correspond to the coumarin values in the database. This could be explained on the one hand, by the noise due to stray lights during the acquisition of the images, on the other hand at the limit of our database data that does not contain enough molecules, it will therefore be necessary to enrich this database to take into account several molecules (coumarins).
4. Conclusions
We have exposed a new technique for the identification of coumarins on a thin layer based on the segmentation of the image and the calculation of the segmentation parameters such as the color entropy, the standard deviation and the average color of the pixels. Our method shows completely satisfactory results and has been compared with the results of the manual technique made from developers and the 366 nm and 254 nm UV lamp. The results of this confrontation showed a similarity between the coumarins obtained. This shows the reliability and robustness of our technique.
In our next work, it will be a question of working on a large number of plants in order to have a large database allowing the identification of several coumarins.