Statistical and Qualitative Evaluation of the Effectiveness of the African Development Bank’s Financial Sector Development Operations, 2011-2018 ()
1. Introduction
This paper presents the results of the evaluation of the financial sector development operations approved during 2011-2018. The evaluation covered the pre and post implementation of the 2014 African Development Bank’s (the Bank or AfDB hereafter) Financial Sector Development Policy and Strategy (FSDPS) approved in October 2014 (AfDB, 2014) to replace the Bank’s 2003 Financial Sector Policy (AfDB, 2003). The evaluation comprised a policy and strategy review, a portfolio review, and case studies in Burkina Faso, Cameroon, Kenya, Nigeria, Namibia, Tunisia and Egypt. Egypt was selected, because it hosts the African Export-Import Bank (Afreximbank), which received trade finance operations to on-lend to several countries in Africa. This paper focuses on the two last components of the evaluation. The acronyms used are defined in the Annex 1.
The objectives of the evaluation were: 1) to assess the relevance of the approach and effectiveness of the Bank’s assistance to the African financial sector; and 2) to draw conclusions and make recommendations on the design and implementation of the new strategy to be adopted in 2022 as well as the design and the implementation of the operations.
This paper: 1) depicts the structure and trends of the Bank’s financial sector portfolio; 2) assesses to what extent the portfolio reflected the main objectives of the policy and strategy; and 3) analyzes the performance of the operations evaluated. It draws on the cluster evaluation and the summary reports of the Evaluation of the Bank’s Role in Increasing Access to Finance in Africa presented to the Committee of Development Effectiveness of the Board of the African Development Bank on the 17th July 2020 (BDEV, 2020a, 2020b, 2020c, 2020d). The evaluation was objectives based and the reconstruction of the theory of change of the FSDPS is reported in the Annex 2.
2. Scope, Methodology and Challenges
The evaluation compared operations approved during 2011-2014 and those approved in 2015-2018 to assess the influence of the 2014 Policy and Strategy on the portfolio trends, composition and performance. The descriptive part covered the trends and the structure of the 226 operations approved during the period 2011-18. A more analytical part covered 32 operations, which were part of the field work. It assessed the relevance and the quality at entry of the financial sector development operations. It assessed whether those operations were implemented efficiently, produced or were likely to produce the intended results and if these results were likely to be sustainable. Table 1 contains the evaluation criteria and related evaluation questions.
Elaborated by the authors.
The research included the following building blocks: 1) a literature review including relevant evaluations of the policy documents and of the instruments used by the Bank and by other International Financial Institutions (IFIs), bilateral or multilateral development organizations; 2) a statistical analysis of the information on the operations from the Bank’s databases; 3) a qualitative analysis of the appraisal reports, supervision reports, back to office reports, completion reports and evaluation notes of completion reports; 4) a semi-structured interviews with the teams involved in designing, managing or monitoring financial sector operations of the Bank; and 5) a questionnaire sent to managers and task managers working on financial sector activities through a Survey Monkey.
The evaluation used a four-point rating scale to rate the 32 operations and to summarize the judgment on their performance in terms of relevance, effectiveness, efficiency, and sustainability. For the consistency and validity of the ratings, the scoring was carried out separately by two evaluators who discussed the results and agreed on the rating to give to each evaluation criteria (Table 2).
The evaluation faced the following limitations: 1) a lack of easily usable databases at the Bank; 2) unavailability of information at the client and end-beneficiary levels; 3) limited availability of local financial sector specialists with expertise in evaluation; 4) difficulties in measuring the results at the end-beneficiary level; and 5) the fungibility of resources limiting the attribution of the achievements to the Bank support. These limitations represented an obstacle to evaluate the effectiveness of the operations especially at the end-beneficiary level (Corporates and SMEs). As a result, the performance of the operations is assessed at the AfDB’s client level.
3. Trends, Structure and Status of the Portfolio
3.1. Overall Trends
The Bank has significantly increased its support to the financial sector after the adoption of the FSDPS in 2014. The number and the amount of the operations approved after 2014 were almost twice as high as in the previous equivalent period (Table 3). The share of FSD operations in the total amount approved by AfDB increased from 17.4 percent during 2011-14 to 21.6 percent during 2015-18. The average amount approved decreased from UA 42.8 million to UA 40.7 million between the two periods. The number of sovereign operations (SOs) increased from 8 percent during 2011-14 to 18 percent during 2015-18, while the amount approved increased from 12 to 28 percent between the same two periods. The number of non-sovereign operations (NSOs) decreased from 92 to 82 percent and the amounts from 82 to 72 percent. During the FSDPS period, the operations ranging from UA 5-50 million have recorded the highest increase. Their number and amount during the FSDPS period were almost 2.5 times that of the previous period. The operations of less than US 5 million and above UA 100 million increased in a smaller proportion than the overall portfolio.
![]()
Table 3. Trends in number, volume and size of FSD operations.
AfDB databases and project appraisal reports.
Almost 50 percent of all FSD operations were ongoing at the time of the evaluation. For operations approved between 2015 and 2018, 34 percent of the operations were approved and signed but with the first disbursement still pending (Table 4). Most of these operations were approved in 2018. There were 39 operations completed, of which 28 had a completion report (for public operations) or an expanded supervision report (for private sector operations). Overall, 21 operations were fully canceled for a total amount of UA 505 million. These represented UA 284 million during 2011-14 and 221 in the subsequent period. While the number of canceled operations remained almost the same in the two periods, their proportion in the policy and strategy period was almost half of those of the previous period, respectively, 13 and 7 percent. In terms of value, they represented 8 and 4 percent. Four other operations were partially canceled for UA 113 million. Cancelations were mainly due to delays in signing before the 180-day delay limit specified in the Bank’s cancelation guidelines.
AfDB databases; *Only full cancelations are reported. Partial cancelations are reported in ongoing operations.
3.2. Instruments
LOCs remained the main financing instrument, but the use of other instruments was more diversified during the FSDPS period. The proportion of LOCs in the amount approved decreased from 60 to 34 percent between 2011-14 and 2015-18 (Table 5). The amount approved for TFLOCs and their number during 2015-18 was 9 times that of the previous period. The number increased from 3 to 28. Guarantees recorded the second-largest increase (2.5 times). Risk participation, introduced in 2013, represented 5 percent of approvals in the 2015-18 period. PBOs and equity funds experienced the smallest increase after LOCs. Though both the 2003 and 2014 policy documents promised to support the whole FSD, their implementation shows that support through PBO lending and TA was very limited, yet many countries in Africa need interventions that explicitly foster FSD as an objective. The Annex 3 presents instruments used by the Bank.
![]()
Table 5. Financial sector operations by instruments for 2011-18 (UA million).
AfDB databases and project appraisal reports.
The analysis of Project Appraisal Reports (PARs) showed that one-third of operations benefited from a grant for TA. However, the rationale of these grants was not always clearly stated, and it did not necessarily align with FSD objectives. Overall, the number of operations comprising a grant for TA doubled from the period 2011-14 to the period 2015-18. Previously, private financial institutions were the main beneficiaries of these grants. However, the most recent period experienced a higher increase of grants to public entities, which corresponds to recent efforts to support public organizations (Table 6). In addition, their actual use is not always detailed in the appraisal report and most of supervision reports reviewed do not report on them. When mentioned, the use of most of the grants aimed to strengthen the clients’ capacity, including for improving social and environmental management systems, in some cases.
![]()
Table 6. Technical assistance to beneficiary institutions.
AfDB databases and project appraisal reports.
3.3. Geographic Coverage
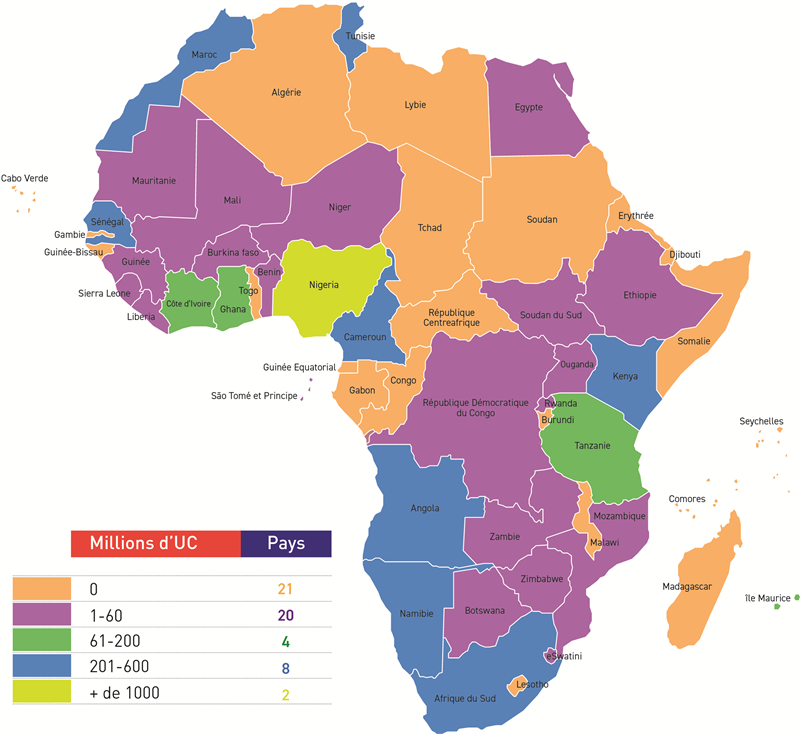
The number of countries in which AfDB extended financial sector operations increased from 19 during 2011-14 to 32 during 2015-18, implying a significant effort to expand access to finance to more countries, including low-income countries. Of the total of 54 African countries, AfDB approved financial sector operations in 33 countries during the entire period; 21 did not benefit from any operation and 18 countries have continuously received FSD operations (Table 7 and the figure below). There are several reasons for this geographical distribution, including the strategic choices of AfDB, the high risks for some countries, the size of markets, the quality of counterparts, the competitiveness of AfDB pricing, etc. However, it should be noticed that the number of countries reached
![]()
Table 7. Country coverage, 2011-18.
Elaborated by the authors from AfDB databases and project appraisal reports.
Geographic distribution of the approval, financial sector operations, 2011-18.
Elaborated by the authors from AfDB database with the technical support of Philippe Mutombo.
is actually higher than indicated in the above numbers, given that 44 percent of the operations are multinational extended to regional development financial institutions, funds and commercial banks. These operations are not included in the portfolio review of individual countries.
During 2011-14 and 2015-18, multinational operations received almost 44 percent of the amount approved in each period. Apart from multinational operations, Nigeria, Morocco and South Africa comprised 48.6 percent of the total amount approved in 2011-14, with Nigeria receiving 30.3 percent, Morocco 10.2 percent, and South Africa 8.1 percent. In accordance with the FSDPS, which promised to avoid the excessive concentration of its financial sector portfolio in a few countries, there was a much lower concentration of resources during 2015-18, with Nigeria receiving 8.5 percent, followed by Senegal (6.6 percent), Cameroon (6.5 percent), Angola (5.1 percent), Tunisia (4.8 percent), Namibia (4.4 percent), and Kenya (3.6 percent). The rank of Cameroon and Senegal is linked to the support extended to both countries to hedge the variation of the exchange between the US dollar and the euro for their eurobonds (in 2015 for Cameroon and 2018 for Senegal). While the resources remained concentrated in countries with a high GDP per capita, the number of low-income countries almost doubled, and the number of lower middle-income countries almost tripled during 2015-18 (BDEV, 2020c).
The share of West Africa was by far the highest among the regions, followed by Southern Africa and North Africa. The Central Africa region benefited the least from AfDB’s support but experienced the highest increase in funding during the FSDPS period (Table 8). However, this was mainly due to the risk participation agreement extended to Cameroon, mentioned previously.
![]()
Table 8. Regional coverage of the financial sector operations.
AfDB databases and project appraisal reports.
3.4. Type and Size of Recipient Institutions
AfDB has more than doubled the number of different categories of clients but the number of microfinance and insurance companies has decreased. The main clients remained commercial banks and equity funds, while AfDB decreased its support to microfinance and insurance companies (Table 9). The number of microfinance institutions decreased from 10 in the policy and strategy period to three during the post policy and strategy period. With regard to SOs, the number of government and central bank clients almost tripled, highlighting the Bank’s increasing support to public entities to support the development of the financial sector. These funds include those established or sponsored by the Bank (representing around 10 percent of the funds supported, such as the Africa Guarantee Fund, the Africa Domestic Fund, Africa 50) and other funds (mainly private equity funds).
![]()
Table 9. Number of financial sector operations by type of client institution.
AfDB databases and project appraisal reports. *Other financial institutions include specialized banks such as housing companies (4), commodity banks (4), and other non-banking financial institutions such as trade finance banks (4), soft commodity program (1), mortgage refinance (1), one regional economic community, etc.
3.5. Use of Local Currencies
An analysis of the AfDB database shows that the use of local currencies was marginal, but there was an increase in their use, which is in line with the FSDPS. In the first period, most operations were denominated in US dollars, euro, or units of account (UA). These represented 90 percent of the amount approved during 2011-18. So far, only four local currencies were used: South African rand, Nigerian naira, Botswanan pula and Zambian kwacha. During 2011-14, there were only two operations using South African rand. They represented 2.4 percent of the amount approved during that period. This number increased to 11, corresponding to 10 percent of the approved amount during 2015-18 (Table 10).
![]()
Table 10. Use of local currencies in financial sector development operations.
AfDB databases and project appraisal reports. Note: US$ = US dollar; EUR = euro; UA = unit of account; ZAR = South African rand; NGN = Nigerian naira; BWP = Botswanan pula; and ZMW = Zambian kwacha.
Reasons for marginal use of local currencies include constraints in the Bank’s local currency framework adopted in 2006 but are mainly due to the inefficiencies in most nascent local financial markets in Africa. Evaluations found that lending in a hard currency does not serve the SME market segment very well, because SMEs tend to have domestic markets and incomes denominated in the local currency, and hence have limited ability to bear the exchange rate risk. However, locally-denominated financing instruments are less attractive to FIs, which would then have to bear the currency exchange risk. Therefore, it is key to help client FIs manage the currency risk with appropriate instruments, so that the sub-loans can be delivered in local currencies (AfDB, 2006).
3.6. Alignment of the Portfolio to the FSDPS
There was no explicit reference to the FSDPS in the design of operations. More often than not, PARs referred to Country Strategy Papers (CSPs) and, for more recent operations, the High 5 strategies. A classification of operations from the stated objectives in PARs showed that most of the operations covered two or three pillars of the FSDPS at once without indicating resources allocated by pillars (Table 11). Pillar II, broadening and deepening the financial sector system, was the most frequently reported pillar. It pays special attention to long-term finance to support investments in the formal sector of the economy, as well as working capital and trade finance. It was followed by Pillar I, increasing access to financial services for the underserved, including SMEs. The policy focused on a universal access to basic financial services, with the poor economic actors from the informal sector as the main beneficiaries. However, the operations mainly served corporates and SMEs. Pillar III, covering stability and governance, was mainly addressed by PBOs, TAs, and grants provided to financial institutions to strengthen their capacity, in addition to the financing, whether provided to governments or other financial institutions.
![]()
Table 11. Alignment of the portfolio to the 2014 FSDPS.
Elaborated by the authors from the analysis of the appraisal reports.
Another noticeable feature of the portfolio is the increase of the support to capital markets since the approval of the FSDPS. From the end of 2014 to 2018, the operations approved to support financial market amounted to UA 1333.1 million. These comprised operations to strengthen market institutions through guarantees to local currency risk hedging, at 54 percent of the total volume, financial sector budget support at 36 percent, and TA to support regulatory reform, and the remaining 10 percent for strengthening market institutions, and financial infrastructure and payment systems development. AfDB also supported capital markets funds such as the African Domestic Bond Fund (ADBF), the African Local Currency Bond Fund (ALCB FUND) and the African Guarantee Funds (AGF), among others, and it worked with development partners in the framework of the African Bond Market Initiative.
There was an increase in the support to innovation that was consistent with the FSDPS call to “foster innovation and promote the scaling-up of breakthrough technologies, some pioneered in Africa”. As for the macro policy issues where AfDB did not play a significant role, there were a few operations supporting innovations, limiting opportunities for replicating and scaling up successes. Table 12 shows that there were a few operations in technology and renewable energy, but their number and amounts approved quadrupled during the FSDPS compared with the equivalent previous period. Nevertheless, these operations represented less than 2 percent of the amount approved during 2015-18. Operations also used innovative instruments with risk participations and partial credit guarantees. Adopting sectoral financial sector budget support in Tunisia and Morocco was also an innovative approach. However, given that innovation was defined as a priority in both Pillars I and II, and the increasing role it plays in the financial sector, it could have received more weight in the portfolio.
![]()
Table 12. Operations supporting innovations.
AfDB databases and project appraisal reports.
Overall, the structure and evolution of the portfolio had many positives. For instance, the number of countries reached grew from 19 to 32, the portfolio concentration declined with smaller average exposures, the amount approved, and the number of operations almost doubled, local currency operations grew from UA 2.4 to UA 9.8 million but remained only 2 percent of the amount approved. Innovative deals went from four to eight. The exposure to multinational operations remained steady at 44 percent of the amount approved. Public operations went from 19 to 32 percent of the amount approved. However, it was not possible to judge these achievements to a set of targets, as these had not been defined.
4. Performance of the Operations Evaluated
4.1. Detailed Operations Evaluation
This chapter relies on a triangulation of information from a desk review of FSD operations, interviews with managers and task managers, the responses of task managers to a survey carried out at an early stage of the evaluation, and on the results of the fieldwork covering 32 operations approved in seven African countries across the five African regions. These included 15 LOCs, five TFLOCs, three risk participation agreements (RPAs), six equity participation, two grants/TA, and one PBO. There were 15 operations during 2011-18 and 17 operations during 2015-18. Some operations were still ongoing and could not be rated for effectiveness, efficiency and sustainability. The sample represented 14.2 percent of the total number and 27.2 percent of the total amounts approved for the FSD operations and helps to identify good and less good practices, which is useful for improving the performance of the operations in terms of their relevance, quality of the design, effectiveness, efficiency, and sustainability. Given that there was no statistical difference in the percentage of satisfactory operations between the two periods, Table 13 provides a weighted average of the percentage of satisfactory operations.
![]()
Table 13. Percentage of at least satisfactory operations.
Elaborated by the authors from case studies.
4.2. Relevance
Relevance assessed whether the objectives of the operations were consistent with the FSDPS, with country, client and target group needs, and good practices in FSD.
From the analysis of the 32 PARs and interviews, all operations but one were found to be relevant with regard to the FSDPS objectives. The analysis of the PARs showed that most of the operations aimed to respond to more than one of the three pillars of the FSDPS: 1) Increasing access to financial services for the underserved; 2) Broadening and deepening Africa’s financial systems;and 3)Financial stability and governance. Most of the operations aimed at improving access to long-term funding corresponding to Pillar II. Increasing access to financial services for the underserved was the second pillar frequently mentioned. Financial stability and governance was the least frequently mentioned pillar. Policy-based operations, which supports policy reforms through a budgetary support, TA to countries and to financial institutions responded to this objective.
Operations were found relevant for clients’ needs. The operations aimed to address clients’ needs for long-term funding to on-lend to end-beneficiaries, to engage in new lending activities or expand their portfolios. The longer maturity of the Bank’s support constituted its additionality, as it contributed toward decreasing the maturity mismatches. RPA operations aimed to help FI beneficiaries to reduce their risk capital charge and freed up scarce capital to underwrite additional business. FIs also intended to benefit from the signaling effect of being an AfDB client by crowding in other investors. AfDB’s support aimed to provide TA to reinforce FIs’ capacity, particularly on aspects related to environmental, social and corporate governance (ESG). Almost all FIs visited underscored the role played by AfDB in introducing ESG principles in their business.
Operations were found to be relevant for country needs, particularly because access to long-term finance remains a challenge in Africa. In only a few cases, AfDB’s facilities aimed to support financial sector reforms, as was the case for Tunisia and Morocco (Morocco was not part of the case studies). In some other cases, support came as a countercyclical response to mitigate the impact of an economic or political crisis. For example, in Nigeria, there was scarcity of US dollars in the period 2015-17 due to a steep decline in the price of crude oil. Crude oil prices decreased from US$99 a barrel in 2014 to US$52 in 2015; US$44 in 2016 and US$54 in 2017. https://www.statista.com/statistics/409404/forecast-for-uk-brent-crude-oil-prices/. This led to an abrupt fall in US dollar earnings and a devaluation of the Nigerian naira, illustrating the importance of the LOCs in enhancing the long-term financing capabilities of the FIs. Likewise, the LOC provided to Namibia in 2015 came at a time when the economy was sliding into recession due to various domestic and global issues. In Tunisia the support of AfDB addressed the market failures during the post-revolution period of political instability after 2011. In some countries, AfDB’s interventions were designed to be complementary to governments’ initiatives to support SMEs, and export-led and import-led businesses. For instance, in Nigeria, AfDB’s interventions complemented the government’s initiatives to support indigenous SMEs and emerging corporates via direct funding through the MSME-Development Fund facility (a Central Bank of Nigeria intervention fund) and also complements the Central Bank of Nigeria (CBN) and Nigeria Export-Import’s creation of two trade finance support lines to export-led and import-led businesses. Through its equity investments, AfDB intended to contribute to the diversification of financial services, and to facilitate directly and indirectly access to finance, for example for SMEs and the agriculture sector (Tunisia-Bourse, FAFIN in Nigeria, Kenya). Given the significant shortage of long-term funding in most countries, the risk of market distortion or crowding out of other lenders was found to be low.
AfDB invested in institutions that played an important role in national and regional financial sectors. This was the case of FIs such as Afreximbank, PTA, and sub-regional and national development banks, including the Nigeria Development Bank, Namibia Development Bank, East Africa Development Bank, and the Eastern and Southern African Trade and Development Bank. For example, strengthening a reinsurer such as ZEP-RE in Kenya served many insurance providers and was an important support function for an insurance market to develop. ZEP-RE has also a training academy focused on developing the insurance and reinsurance sectors at a regional level. By strengthening such support functions, AfDB aimed to contribute to broadening and deepening Africa’s financial system, and to support regional integration, as well as financial stability and governance. The Bank also contributed to building funds to cater for specific needs (Africa 50, Africa Guarantee Fund, Boost Africa, etc.). These operations were intended to benefit the whole financial sector system.
Although the portfolio was considered relevant, the evaluation also found a lack of strategic clarity in appraisal reports for the following reasons:
· No business plan was prepared to identify the areas and countries where the Bank could bring the highest additionality: operations were selected on the basis of their viability, while their impact on the financial sector was rarely considered.
· Due to the wide financing gap for FSD in Africa, nearly any type of support would respond to the needs in most of the countries.
· Given the very broad scope of the policy objectives and the lack of concrete strategies and targets, almost any FSD operations would fall within the scope of the strategy without necessarily being the best option.
The Bank’s intervention rationale was not always clear. While the Bank’s intervention justification is mentioned in the PARs, the justification did not always explain the Bank’s comparative advantages: responding to market failures, counter cyclical support, support to national or regional development banks, support to large regional financial institutions, etc. The justification was particularly weak when partner institutions were likely to have access to other sources of funding: large established commercial banks, upper middle-income countries or large international banks. The reports rarely articulated why the intervention was considered to be the best option among several alternative investments.
There was no evidence of a thorough assessment of the root causes of weak or the lack of access to finance in PARs. Although the market challenges and the needs of target groups were mentioned in appraisal reports, most of them focused their assessment on the partner institution, rather than on the market conditions hindering the institution to better serve underserved target groups in order to justify the appropriateness of use of instruments. As a consequence, operations tended to bring temporary solutions to identified problems. For example, while liquidity shortage in a market justified the use of LOCs, these only provided a temporary supply of funding and did not address the binding constraints that restrict the availability of long-term funding in a market. Therefore, assessment of development outcomes can hardly go beyond clients served by partner institutions, as operations did not aim and were not designed to influence the broader financial sector. A similar observation was made in the 2003 financial policy on the use of LOCs in the following terms: “However, so far these interventions appear to have been employed in isolation, without taking into account their mutual and reinforcing relationship, and without a comprehensive framework for the [financial] sector’s development”. The lack of vision for FSD at the country level is also reflected by the fact that AfDB is not visible as a leader in FSD, and its engagement with other funders to develop a vision for the sector is limited.
While LOCs and TFLOCs were relevant to provide liquidity for on-lending to sub-borrowers, their contribution to access to finance for underserved and to FSD was not ascertained. Given both instruments represented a large share of AfDB’s FSD portfolio (65.3 percent between 2011 and 2014, and 60.5 percent between 2015 and 2018), other constraints that hinder FSD did not receive sufficient attention and funding, thereby limiting the contribution of AfDB to its stated objective to increase access to finance for underserved segments. Those constraints include weak payment systems, regulatory constraints, and a lack of innovation and informality, among others. An evaluation synthesis of LOCs found that “the impact of LOCs in promoting financial inclusion in terms of extending access to financial services to unbanked people still has to be demonstrated” (BDEV, 2018).
4.3. Quality of the Design
Quality of design looks at whether operations’ intervention logic was clearly presented, and comprised baseline data and targets with measurable indicators. It assessed whether the design was based on plausible hypotheses on how to attain intended outcomes.
Out of the 32 operations that were rated, 21 were rated satisfactory. Those operations were mainly: 1) policy-based operations; 2) operations of the Africa SME program; and 3) operations extended to development banks. For those operations, PARs presented a credible results chain indicating how the operation was likely to attain its objectives, a baseline and clear expected outcomes and/or impacts of the operations in access to finance or in strengthening the financial sector. Fortis Bank in Nigeria is an example of a good design of a LOC part of the Africa SME Program. The facility was in local currency and used a local definition of SME, clearly defined end-beneficiary targets and had an easy disbursement process. Another example of a good design was a TA in Tunisia, which aimed at facilitating SMEs’ access to capital markets, consisting of a triangular collaboration between the government of Tunisia, the Tunis stock exchange and entrepreneurs. It had a clear objective to support a portfolio of SMEs accessing capital market through a grant for training qualified SMEs. Some operations presented weaknesses in their intervention logic from a development point of view, even if they were satisfactory from a financial perspective. PARs of those operations did not convincingly explain how providing financial resources to a client financial institution would contribute to the intended development objectives. For example, for larger operations supporting commercial banks, PARs did not show how supporting these organizations would lead to impact on the financial sector. In Kenya, under the interest rate cap regime, while AfDB selected good performing financial institutions, these institutions had limited appetite to lend to the perceived riskier segments of the market, such as SMEs.
More often than not, operations were not designed to address the binding constraints in the financial sector. The design of operations was mainly demand-driven. For many operations, the Bank’s support was justified by the lack of long-term funding as an important barrier to business. However, operations were not designed to address the underlying causes of why there was a lack of long-term funding in target markets: they aimed to provide resources as a temporary solution without setting up sustainable conditions for partner institutions to access to long-term funding.
Expected outcomes were mainly defined in terms of economic development and were difficult to track. These indicators were often set in terms of GDP, job creation, revenue to government, etc., without demonstrating the results in terms of access to finance and/or FSD. This situation reflected weaknesses in developing the results framework with a confusion between private sector development and FSD. In addition, results on indicators such as job creation—while referred to in supervision reports—could be hardly attributed to an AfDB operation, given the fungibility of resources and the lack of results tracking by AfDB’s clients.
Intended results for end-beneficiaries were not clearly defined, which created conditions for the exclusion of underserved segments from accessing to finance. Often SMEs are defined as a target group, particularly for LOCs. However, the lack of clear definitions made targeting SMEs difficult—SMEs represent a broad and diverse range of enterprises in terms of size and access to finance. In these circumstances, operations are more likely to benefit mostly medium size to large companies, leaving behind smaller, less mature and informal SMEs. This was compounded by the pipeline approach in which the results of the operations were set based on the clients’ estimates on the basis of the list presented, which in reality changed following new opportunities and market dynamics.
The rationale of providing TA is not always clearly stated and rarely refers to the FSD objectives. TA was used to advance the integration of ESG principles but rarely for FSD objectives. PARs had an adequate assessment of clients’ needs and operations’ commercial viability. In some cases, TA needs were diagnosed during appraisals and AfDB took measures to address the issues identified. For example, ESG conditions were assessed during the appraisal of the operations and AfDB assisted clients to include ESG principles in their operations through TA measures. In other operations, the rationale for allocating TA was not always clearly defined and their use was not systematically mentioned in appraisal or supervision reports. BDEV’s synthesis evaluation of LOCs had already underscored that TA does not serve directly the objectives of AfDB in terms of developing and deepening FSD (BDEV, 2018).
Conditions, pricing and repayment schedule are not always adapted to client needs. In some cases, bullet repayment structure or financing tenor did not fully match the needs of the clients. In Nigeria and Kenya, clients lamented the high pricing of the TFLOC. In other cases, restrictions to provide local currency limited the relevance and applicability of some operations, as it led to unfavorable pricing compared with the local currency, or it limited the typology of end-beneficiaries. For example, for Access Bank in Nigeria, AfDB provided a LOC in hard currency, but SMEs often cannot prudently bear foreign exchange risks. Only 12 percent of the LOCs were on-lent strictly to SMEs, resulting in significant crowding-out of some SMEs from benefiting from this LOC. This was based on a central bank circular that restricted commercial banks from granting foreign-currency denominated loans to entities that had no capacity to generate foreign-currency proceeds.
4.4. Effectiveness
Effectiveness assessed whether the operations actually contributed to improving access to finance.
Out of 25 operations evaluated, 19 were rated satisfactory. These operations were effective in providing resources and services otherwise unavailable to client financial institutions. This was particularly true when countries suffered from a lack of liquidity because of the retrenchment of global banks from Africa further to more stringent regulatory conditions of Basel III and other new regulations around anti-money laundering and terrorism financing. Potential fines for breaching the rules are heavy and often very punitive, in some cases in the billions of US dollars, and most international banks feel they are more prone to such risks in emerging markets, especially Africa (conversation with Yaw Kuffour, Division Manager of Trade Finance at AfDB). TFLOC operations helped FIs to increase their capacity to support international trade. This was the case for operations supporting Afreximbank, or Banque de l’Habitat in Tunisia, Commercial Bank of Africa in Kenya and FSDH Merchant Bank Limited in Nigeria, which were part of the fieldwork for this evaluation. For example, the support to Afreximbank allowed to extend its trade finance commitments to hundreds of FIs, corporates and SMEs in 20 RMCs. The investment in ZEP-RE in Kenya helped the insurer increase insurance penetration in Africa in the region. Through its equity participations, AfDB could increase the capacity of FIs to support the real economy. These operations also led to a crowding-in effect thanks to the AAA status of AfDB. In addition, AfDB participated in the Board of the FIs and contributed to good governance of client institutions, which is in line with the cross-cutting pillar of the strategy. Policy-based and TA operations enabled to move the financial sector reform agenda forward. In many cases, AfDB’s operations contributed to crowding in capital from other IFIs.
The prevailing pipeline approach did not guarantee that resources would be extended to target groups, as defined in appraisal reports. First, the provision of resources to FIs to extend them to SMEs—a heterogenous group, gathering a wide range of institutions in terms of turnover, staff size, needs, access to funding, which may vary from country to country, does not necessarily mean allowing easier access to funding to underserved targets. Access to finance by underserved target groups would be more effective if those groups were specifically defined in the portfolio with clear baseline data and indicators to monitor over time. Assessing the contribution to FSD objectives was also challenging as the metrics were expressed in general economic terms, such as jobs created rather than the financial sector. This finding is in line with an earlier evaluation synthesis of LOCs stating that: “The effectiveness of LOCs is often questionable because information at the end-beneficiary level for analyzing the development results through the evaluation criteria are missing” (BDEV, 2018).
Development indicators were mostly defined with a focus on job creation and the number of enterprises funded, but remained vague on types and profiles of end-beneficiaries. This practice encourages clients to fund larger enterprises that are less risky. As a consequence, small enterprises and other underserved groups remained excluded. In some cases, there is a clear mismatch between the intention to enhance access to finance for women and the types of enterprises funded by clients (mostly sectors that employ men). Furthermore, the pipeline approach, which suggests that AfDB has control over end-beneficiaries, does not help improve targeting, as projects approved and actually implemented are often different. Some operations targeted specific excluded population segments, such as the rural population, women or youth. However, in many cases there was no information available on whether these target groups actually benefited from the operation due to weak internal reporting systems of clients. Some clients pointed out that reporting requirements had been discussed insufficiently or too late in the appraisal process.
Lack of operations restructuring during their implementation corresponded to lost opportunities for beneficiaries. This is true in two cases in Nigeria, where clients could not lend to the intended target businesses due to regulatory requirements, and where AfDB could have adjusted the terms of the operations or intended outcomes. Given the above-mentioned central bank circular that restricted commercial banks from granting loans in foreign currency to clients that could not bear foreing exchange risks, AfDB should have ensured that the pipeline for this operations comprised sufficient eligible SMEs or it should have explored the possibility to on-lend in local currency.
In these two cases, only a small share of the LOCs was on-lent to SMEs, following a central bank circular that restricted commercial banks from granting foreign currency-denominated loans to entities that had no capacity to generate foreign-currency proceeds. Another example is provided by an LOC extended to the Central Bank of Tunisia, which was difficult to access due to unrealistic eligibility criteria for participating financial institutions. Weak follow-up and lack of adjustments in the eligibility process led to a use of 70 percent of resources in July 2019, long after the planned completion date. An identical LOC provided in parallel by the World Bank was fully disbursed and an additional tranche was being implemented.
4.5. Efficiency
Efficiency looked at the respect of cost and time for design and implementation.
Thirteen operations over 25 operations evaluated were rated as being satisfactory. Once approved, implementation of the operations was efficient, especially for repeated operations. However, sometimes long and cumbersome approval processes limited the efficiency of the operations and led to missed lending opportunities for clients.
LOCs are an efficient mechanism to channel large amounts of funding to intended beneficiaries. However, the efficiency of seven out of 13 LOCs that were part of the fieldwork was unsatisfactory, mainly due to time overruns in the approval phase. Even LOCs where efficiency was satisfactory overall, clients stated that processes were long compared with other IFIs. Delays were caused both by AfDB and clients. Among the main factors that caused the delays was the failure to meet conditions prior to disbursement by clients, but also weak relevance of some AfDB’s conditions. For instance, some clients questioned the fact that AfDB required to present some ministerial approval whereas other IFIs had abandoned this practice, the imposition of lawyers during the appraisal phase paid at a high price, whereas the clients could find more competitive experts on the market (case of Burkina Faso), and the use of outdated procurement processes whereas other IFIs had embraced automated procurement (as in the case of Tunisia). In other cases, delays were caused by the lack of a clear lending pipeline, legal procedures or a high level of liquidity delaying the use of funding. In one case in Cameroon, the design of the operation was complex, lengthy and required mobilizing costly expertise.
The efficiency of TFLOCs was overall satisfactory. Some delays were experienced due to legal procedures in the case of the TFLOC to FSDH, Nigeria. Delays in the disbursement of the TFLOC to the Commercial Bank of Africa in Kenya were mostly due to internal matters, including high liquidity at the time of TFLOC disbursement and the lack of a clear lending pipeline.
The efficiency of providing RPAs extended to Afreximbank, part of a trade finance package, was satisfactory for the RPA of the first package and unsatisfactory for the RPA of the second package. This was due to the condition linked to the second RPA that Afreximbank should finance SMEs while it was involved in large deals. Hence, 40 percent of RPA of the second package was not used. In addition, there was no supervision for the second RPA, although there was a close interaction between the Bank and Afreximbank.
The partial risk guarantee for currency risk hedging in Cameroon was complex and inefficient. While the actual swap was set up efficiently, the negotiations and project management by AfDB’s team and Cameroonian counterparts were lengthy and required mobilizing costly expertise. The eurobond was finally issued with a five-month delay, resulting in a higher interest rate that constrained the government to limit the final amount of the eurobond issue.
Overall, the efficiency of equity operations was satisfactory. However, delays in the process for equity participations were noted in all cases. Some of these delays were due to legal agreements and delays in obtaining government approvals (e.g., the Development Bank of Nigeria), but a lack of clarity on which teams within AfDB should handle certain requests led to further delays (e.g., FAFIN). In Kenya, the turnaround time on the Bank’s decision to participate in ZEP-RE’s rights issue lasted close to one year, forcing ZEP-RE to delay some investment decisions, implying lost opportunities for the insurer.
Regarding grants and TA, the grant to the Tunisian Stock Exchange for the SME project has just started and, as a result, the efficiency of the operation could not be assessed. The approval and signature process for the TA to PACBA was efficient. However, there were some delays in disbursements because the Government of Burkina Faso failed to meet the conditions prior to disbursement.
Efficiency of disbursement and implementation of the budget support to the Tunisian Government was highly satisfactory. The PBO built on AfDB’s and other IFIs’ previous financial sector interventions, which contributed to its efficiency. In addition, the operation benefited from the consultations with key beneficiaries, under the coordination of the Tunisian authorities, as well as from the workshops organized over the two years preceding the approval of the PBO. The monitoring of development outcomes was also satisfactory.
4.6. Sustainability
The review scored the probability of continued long-term benefits based on the recipient’s financial sustainability, as well as the capacity and the commitment to continue providing the services supported after AfDB’s operations.
Most financial institutions that benefited from AfDB’s support improved their financial performance during the duration of the facilities. In some cases, the facilities helped attract funding from other sources, helping clients to grow and diversify their funding base. During the fieldwork, the signaling effect of being an AfDB client was often mentioned by clients as a positive effect. This was particularly the case for funds (equity, venture capital) and regional and pan-African FIs.
Whether AfDB’s clients will continue supporting access to finance by underserved segments is uncertain. The main instruments used by AfDB have a limited effect on clients’ incentives and capacities to serve specific underserved target groups. In Kenya, it is unlikely that supported FIs will continue serving small enterprises and other underserved groups post AfDB’s support, as the underlying constraints such as high transaction costs, informality and real or perceived risks have not been addressed. The information collected in seven countries shows that there was a significant risk that FIs will revert back to serving corporates and previously served creditworthy clients. This lack of alignment between AfDB’s development objectives and the strategic objectives of supported financial institutions raises questions about AfDB’s partner selection and the sustainability of results. In some cases, for example Burkina Faso and for the leasing company in Tunisia, there was sufficient evidence to suggest that the FIs will continue serving SMEs, which constitute a growing share of their portfolio and a strategic priority. In Nigeria, AfDB’s clients have a developmental mission and are therefore more likely to continue lending to the target segments.
While the FSDPS aimed to develop the financial sector, its resources were focused on FIs whose effects on FSD were not obvious. While the financial sector context was analyzed and the funding needs justified, PARs rarely explained how the operation would contribute to advance access to finance or FSD. The exceptions are operations that contributed to building large organizations in trade/import-export finance, leasing, and reinsurance markets. Not only did these benefit the entire sector, but they are also more likely to have a long-term impact. For example, the investment in ZEP-RE has helped grow the insurance sector and benefits multiple insurance providers in the region. Another example is policy-based operations focusing on the financial sector, such as in Morocco and Tunisia, which supported national regulation efforts in terms of strengthening the financial sector. For these cases, sector-level outcomes are impactful and likely to continue in the long term.
The lack of long-term funding is addressed only temporarily. While providing long-term financing is useful to on-lend to the real economy, its business model is limited in terms of supporting FSD. In fact, the model addresses the apparent manifestations of a lack of resources without addressing the causes. AfDB’s 2003 financial sector policy had arrived at the same observation. However, the introduction by AfDB of new instruments, such as risk participation and equity, are more likely to have long-term impact. Indeed, instruments such as risk participation encourage FIs to lend to riskier markets such as some categories of SMEs that they will not serve in normal businesses. This could facilitate access to finance for firms. As for equity investments, they provide a long-term support to the FIs and enable AfDB to have a voice on FIs’ strategy.
Despite their strong role in strengthening FSD, policy-based operations received only a marginal part of the resources. These operations enable the offering of budgetary support to countries or regions, combined with institution building, and provide a platform for continuous policy dialogue to support policy reforms. During the period under evaluation, PBOs dedicated to support financial sector reforms were implemented in Morocco and Tunisia. In the two countries, they contributed to move financial sector reforms forward in several aspects. However, PBOs represented only 8 percent of value of operations before 2015 and less than 6 percent since 2015. These were the few examples of operations serving Financial stability and governance, the cross-cutting theme of FSDPS, which was not often addressed by the operations. The review also highlighted weak engagement at policy level. PBOs and TA were extended to only seven countries, in North Africa, East Africa and West Africa. They addressed various aspects of the financial sector (payments infrastructure, financial inclusion, interoperability of digital financial services, etc.).
Enforcement of environmental and social issues in FIs operations. AfDB’s clients in the countries visited for this evaluation were unanimous on the important role played by AfDB in introducing Environmental and Social Management Systems (ESMSs) and the training to report on environmental and social (E & S) issues. However, this evaluation did not focus on evaluating the extent to which the standards were effectively respected by the operations, since this was already addressed in BDEV’s (2019) Evaluation of AfDB’s Integrated Safeguards System (ISS), which focused among other areas on (FIs). Among others, the evaluation highlighted the following:
· E & S safeguards performance at appraisal was found to be strong and significantly improved, compared with a 2011 review, but supervision of FI operations did not pay enough attention to E & S aspects. For 56 FI operations, the desk review found that AfDB was successful in supervising only two of the 37 evaluable FI operations at the implementation stage, echoing findings in other studies both by AfDB and other IFIs. The evaluation identified some good practices of AfDB’s E & S supervision reports of equity funds, which performed significantly better than the FIs with LOCs.
· Issues leading to such poor performance in supervision were due to lack of the following: 1) a specific reporting template; asking clients to submit reports on E & S performance, even in cases where this was included in the loan agreement; 2) evidence; 3) candor in the assessment; and 4) expert support during the supervision missions, and more generally, inadequate staffing with E & S experts.
· The Environmental and Social Assessment Procedures (ESAP) did not provide specific guidance about E & S reporting of NSOs, and FI operations in particular. The evaluation did not find any documented evidence that AfDB’s team had verified that FI portfolio considered at risk operations notified or submitted ESAP/Environmental and Social Management Plans on their high-risk sub-projects.
· AfDB efforts to strengthen borrowers’ safeguards systems and to develop their capacity to manage E & S risks progress were limited. While it continues to be a relevant objective, due to budget and staff shortages at the Bank’s E & S function the Bank has only managed to conduct a series of studies, right after the approval of the ISS. A 2015 assessment of the use of “country systems” found weak capacity in all case countries, with greater deficiencies for transition states and middle-income countries experiencing conflicts.
· The Bank provided comprehensive support to develop the E & S capacity of the FI sector at the beginning of the evaluation period, but this was not continued afterwards. From 2012 to 2015, AfDB ran a successful and thorough “Fund for African Private Sector Assistance (FAPA) Training and Consultancy on E & S Management in FIs and Microfinance Institutions in Africa project”, which included in-house internal training for the Bank’s staff and 10 regional workshops and in-company (FIs) coaching sessions that reached 160 people in 101 FIs. At that time, AfDB was the only multilateral bank to have such a comprehensive E & S capacity-building program for the FI sector. Since the end of the FAPA training, due to limited E & S staffing and budget, the Bank has provided relatively little TA to develop ESMSs for FIs.
4.7. AfDB’s Performance
Focused on clients’ satisfaction, procedures of AfDB and its collaboration with other stakeholders.
Nineteen of 25 operations evaluated were found to be satisfactory. In the seven countries visited, most stakeholders were satisfied working with AfDB. Clients considered that AfDB helped them crowd in other funders thanks to AfDB’s triple A rating. Interactions with AfDB staff were satisfactory from the clients’ perspective, which saw AfDB staff as being responsive and proactive in dealing with enquiries and requests. The technical capacity of staff was acknowledged. The relationship management, especially during transitions between staff, could have been better in some cases. An outlier situation was the case of the LOC in Support of Small and Medium-Sized Enterprises in Tunisia approved in 2011. The World Bank provided a similar LOC at the same time. The World Bank completed its operation and carried out a completion report in 2015 before providing a second LOC, which is currently ongoing. At the same time, the disbursement rate of the LOC provided by AfDB was only 70 percent as of July 2019. The Central Bank of Tunisia, which is the implementing agency, was dissatisfied with this situation.
Clients find AfDB procedures cumbersome compared with other IFIs. Clients noted that AfDB used unnecessary cumbersome procedures, which had been abandoned by other institutions. For instance, in Tunisia, private banks lamented that the Bank requires providing a non-objection letter from the Ministry of Finance before benefiting from a LOC. This is considered an unnecessary step given that the banks are regulated by the Central Bank of Tunisia in any case. It was also noticed that conditioning disbursement upon an audit in the case of the APEX facility was a practice that had been abandoned by the World Bank. Likewise, clients underscored some inefficiencies in procurement, as the Bank did not have an automated procurement system.
AfDB is not visible as an actor in FSD beyond providing financial resources. With the exception of Tunisia, where AfDB has played a strong role in supporting the government’s reform plans, in other visited countries AfDB had not systematically engaged in policy advocacy, which has been a missed opportunity in terms to having a greater impact. Even in Namibia, where the CSP envisaged AfDB support for business environment reforms, there is no evidence that AfDB was involved in policy advisory to influence the financial regulation. In Kenya, staff occasionally engaged in policy dialogue, but there was no evidence of a deliberate strategy for AfDB’s sector engagement on policy and regulatory dialogue. AfDB is mostly transaction-driven, which is misaligned with the development challenges that some of the divisions are meant to address, specifically, capital market development and financial inclusion.
Lack of a business plan led to discrepancies in country approach. From 2015, AfDB used new instruments and increased its support to public and private sectors, to try to address the challenges faced by the financial sector. The Bank also reinforced its policy dialogue in some countries through a wide consultation process with various actors of the financial sector. This was the case, for example, in Tunisia. However, the country approach showed discrepancies. In Tunisia, AfDB adopted an integrated approach for FSD, using a variety of instruments, targeting various beneficiaries and supporting various aspects of the financial sector. However, this was not the case in other countries, where the approach was more “opportunist”.
The Bank has been working closely with other international organizations for public sector operations, while its cooperation with the private sector remains limited. The analysis of the appraisal, supervision, and completion reports highlighted that collaboration with other international organizations materialized mainly in public sector operations. Policy-based and TA operations supporting financial sectors reforms showed a great level of experience-sharing and coordination to ensure efficiency and sustainability of operations. This collaboration also materialized in operations to support national developments banks (such as in Nigeria) or financing to SMEs through central banks (such as in Tunisia). In this particular case, AfDB collaborated closely with the World Bank during the preparation phase of a joint financing of a LOC in 2011. However, collaboration was insufficient during implementation, which resulted in AfDB finance being underused and the World Bank approving an additional tranche. The cooperation was limited and more on an opportunistic basis for private sector operations, with IFIs being seen mainly as competitors. It only appeared on: 1) co-financing for dedicated funds, where several IFIs would contribute depending on their appetite; and 2) equity investments for some microfinance investments. These ad-hoc engagements show the potential for greater cooperation with IFIs—a potential that was also recognized by AfDB’s staff in the questionnaire.
The evaluation highlighted that collaboration with other international organizations materialized mainly for public sector operations. Policy-based and TA operations supporting financial sector reforms showed a great level of experience-sharing and coordination to ensure efficiency and sustainability of the operations. For instance, the grant to facilitate SMEs’ access to non-banking financing in Tunisia benefited from strong coordination between various lenders. AfDB also participated in initiatives from other donors such as the Compact with Africa Initiative.
AfDB’s responsiveness during the implementation process was acknowledged by most clients. It was highlighted by clients that AfDB’s staff were quick to respond to challenges and issues brought to their notice during the appraisal and implementation periods, and that a good relationship existed with AfDB’s team, with the exception of an operation extended to the Central Bank in Tunisia, where issues were encountered during implementation that were not effectively or timely managed. In the case of PBOs, consultations with key beneficiaries, policy dialogue based on lessons learned from previous financial sector interventions at AfDB and at other IFIs’ contributed to the efficiency of the operations. The 2011 LOC in Tunisia remains an outlier which, in principle, would require management to take an appropriate decision.
5. Summary of the Main Findings
5.1. Structure and the Evolution of the Portfolio
The number and volume of FSD operations approved in 2015-18 were almost twice as high as those approved in 2011-14. The share of those operations in the total amount approved by AfDB increased from 17.4 to 21.6 percent from the pre-FSDPS period to the FSDPS period. NSOs had the largest share of FSD operations, albeit with an increasing share of SOs from 12 to 28%. This increase is explained by the increase in the level of support to a number of development banks with national and regional outreach.
LOCs remained the main instrument used but decreased from 60 to 34 percent of the total amount approved for the FSD during 2011-14 and 2015-18, respectively. The amount approved for TFLOCs during 2015-18 and the number were 9 times higher than in the previous period. Guarantees recorded the second-largest increase, at 2.5 times. The risk participation instrument introduced in 2013 represents 5 percent of the portfolio for the 2015-18 period. While the FSDPS intended to support whole FSD, PBOs and TA were very limited, although many countries need interventions that explicitly foster FSD as an objective.
The number of countries that received financial resources increased from 19 to 31 (not including multinational operations that represent almost 43.5 percent of the amount approved during each period considered). All operation sizes increased, but those ranging from UA 5 - 50 million increased the most (these more than doubled by number and size). There was a much lower concentration of resources by country in the period 2015-18 than in 2011-14.
AfDB has increased the number of most of the categories of its clients by at least 2 times, but the number of microfinance and insurance companies decreased significantly. The main clients remained commercial banks and equity funds. The number of microfinance institutions fell from 10 in 2011-14 to three in 2015-18, and that of insurance institutions from four to zero. Regarding SOs, the number of governments and central bank clients almost tripled, highlighting the Bank’s increasing support for public entities to support the development of the financial sector.
The evaluation found several other noticeable developments. First, operations in local currencies increased - from two during the pre-FSDPS period to 11 during its implementation. So far, only 4 local currencies have been used, with approval amounts increasing from just 2.4 percent during 2011-14 to 10 percent during 2015-18. Second, since the end of 2014 until 2018, the operations to support financial capital markets amounted to UA 1331 million, i.e. 14.3 percent of the total amount approved. Fifty-four percent of the amount of those operations was meant to provide guarantees to local currency risk hedging, while 36 percent were for financial sector budget support. The remaining 10 percent consisted of TA to support regulatory authorities, financial infrastructure and payment systems development. Third, while operations in technology and renewable energy were few, the approved number and amount during the FSDPS were 4 times and 4.5 times, respectively, compared with the previous period.
5.2. Performance of the Operations Evaluated
AfDB operations were in line with the FSDPS objectives, and relevant to their respective clients and country contexts, but did not necessarily serve the underserved. AfDB operations mostly focused on channeling long-term funding to FIs for on-lending to priority sectors of the real economy. Given the broad scope of the FSDPS and significant gaps in long-term FSD, the operations were in line with the FSDPS, and with client and country needs, but they mainly focused on providing resources to FIs for on-lending to the real economy. Furthermore, many other constraints mentioned in partner countries’ strategies and the FSDPS remain unaddressed, such as weak payment systems, regulatory constraints, a lack of innovation and informality, among others.
While the fieldwork focused on six countries in which AfDB had multiple financial sector operations (apart from Cameroon where there was only one operation), there was no evidence that these operations were part of a coherent Bank strategy toward FSD in these countries. The lack of thorough country financial sector diagnostics to understand the underlying constraints may have contributed to the weak strategic clarity and focus. Except for the operations in Tunisia and Morocco, AfDB’s financial sector operations were decided on their case-by-case viability and did not represent a coherent set of interventions that jointly contribute to achieving the FSDPS objectives. The lack of a Bank vision for FSD at the country level is also reflected by the fact that AfDB is not visible as a leader in policy dialogue on FSD.
Insufficient clear definition of target groups and intended development outcomes limited AfDB’s role in advancing access to finance for the underserved. Development outcomes and end-beneficiaries were not clearly defined in PARs and in reporting. Although LOCs often target specific underserved and excluded population segments, related information was missing in many cases or it showed that the intended targets represented only a small part of the portfolio of client institutions. LOC objectives loosely refer to access to finance, but without defining clear targets for reaching underserved target groups such as women and youth. Furthermore, the positioning of SME finance as a driver of growth and job creation led to a focus on high-growth SMEs, not the underserved. While the focus on strong SMEs makes sense from a private sector development perspective (for instance, to promote enterprises’ development for job creation), it risks insufficiently advancing access to finance for the underserved. The diverse financial needs of households and individuals, other than business needs are hardly considered in project designs.
The efficiency of AfDB’s FSD operations was partially satisfactory. Half of the evaluated operations were efficiently prepared and implemented. Others faced time overruns that, in some cases, led to additional costs for clients or missed lending opportunities. Even in operations with satisfactory efficiency, clients stated that processes were overly prolonged apart from those for repeat operations. Among the main reasons advanced to explain the situation were onerous AfDB conditions precedent to disbursement, inefficient communication, and the lack of an automated procurement system.
Although AfDB provides much needed long-term funding to its target markets and has often helped clients access additional funding from other IFIs, its operations tended to provide temporary solutions in addressing underlying constraints in FSD. AfDB supported regulated, financially sustainable institutions, but the likelihood that they will continue serving underserved target groups beyond the period of AfDB support is questionable. This is because most operations did not address the underlying constraints that prevent financial institutions from serving the underserved segments of the population and the economy, including SMEs. Such constraints include insufficient capacity and willingness to serve certain segments of the market, weak regulation and supervision, a lack of competition, information asymmetries, and high transaction costs and risks. These factors contribute to the high interest rates prevailing in African financial sectors (Beck et al., 2011).
A reflection on innovative ways to increase access to finance through digital and other alternative delivery channels is largely absent from the evaluated portfolio, despite the disrupting role that technology plays in a number of African financial sectors. More recently, however, AfDB has become more active in supporting the development of capital markets and digital financial services.
6. Recommandations
1) Clarify AfDB’s role in FSD: Priority areas of action include:
· Focus the Bank’s strategic priorities, which are broadly defined in the current FSDPS document. Develop a clear theory of change of how FSD contributes to economic growth and inclusion. Prepare a business plan to be approved by the Senior Management detailing realistic actions to be undertaken in the short, medium and longer term, by type of country.
· Conduct sector diagnostics that identify barriers to access to finance at the country and regional levels. The selection of the appropriate instruments and partners should be based on thorough financial sector diagnostics to address market failures and systemic constraints. Diagnostics should also consider how existing financial service providers and their offerings meet the needs of different segments of MSMEs and the population. Financial sector experts should work closely with in-country and regional economists, not only when carrying out country diagnostics but also when preparing country and regional notes and strategy papers.
· Be more explicit on how operations contribute to FSD. When applicable, CSPs and Regional Integration Strategy Paper (RISPs) should lay out the development objectives for the financial sector, and outline a plan to achieve them. Each strategy should include: 1) an allocation of resources between projects—NSOs and SOs, and explain how these are linked in the development plan of the country and/or the region; 2) the types of instruments to be used and their justification; 3) specifically address innovation, technology, payments, remittances, digital channels, regulations, competition, financial transaction costs, risks, supporting infrastructure, anti-money laundering (AML) and de-risking; and 4) a resource plan—skills, headcount, capital deployed, costs and revenues to meet the plan. Likewise, PARs should articulate how supporting specific operations, institutions, and the use of instruments will contribute to advancing FSD in the country. A more diverse range of instruments and potential measures (e.g., capital market development, investing in financial infrastructure, use of local currencies, etc.) to increase the availability of long-term funding should be considered. Each operation should formulate a theory of change.
2) Position AfDB as a key player in FSD. Priority areas of action include:
· Step up AfDB’s engagement in policy and regulatory dialogue aimed at strengthening the financial sector environment. This should include working in close cooperation with, or leveraging initiatives by, other development partners such as the World Bank Group, the IMF, and local advocacy and industry associations.
· Formalize the coordination of the departments involved in the financial sector activities and institute a Bank-wide system of information on financial sector activities to facilitate evaluation and decision-making. Also, improve the skills mix to include non-transactional staff to cover engagements by RMCs in reforms and diagnostics.
· Improve outreach and the depth of relationships with sector stakeholders, including clients. AfDB should inform stakeholders of the financial sector policy and strategy, maintain channels of communication with the clients, and organize regular follow-up meetings to improve the efficiency and effectiveness of operations. Likewise, AfDB could periodically organize an open day to present its strategy and operations, and its instruments and partnership opportunities to the private sector at the country and regional levels.
· Consider increasing the resources for operations aimed at fostering regional financial integration. Given the increasing role played by cross-border, regional or continental banks in Africa, it is of paramount importance to support operations aimed at fostering regional integration, which could help harmonize rules and procedures at the regional level, especially in francophone and anglophone countries. This will require active engagement with regulators in each country and region supported by clear strategies.
3) Improve benefits for the intended target groups. Priority areas of action include:
· Better define and measure the project development outcomes and benefits for target groups. A robust results framework and functioning monitoring and evaluation system focusing on results, and aligned with the corporate results measurement framework, is critical. It should be an integral part of the financial sector strategy. PARs should include specific, measurable FSD indicators in their results frameworks, including indicators that measure access to finance for the underserved. Indicators need to be defined at all levels: financial sector, client and end-beneficiary. Monitoring requirements and indicators should be discussed with partners upfront and be tracked during supervision missions. For further reflection on impact management systems, AfDB could consider applying the Operating Principles for Impact Management to ensure that impact considerations are integrated throughout the investment lifecycle. This is an emerging practice for development finance institutions and impact investors alike (see https://www.impactprinciples.org/9-principles).
· Include a clear definition of what constitutes an SME in PARs and CSPs. Definitions used by operations are often not clarified in the PARs, making it difficult to assess the contribution of AfDB to SMEs. AfDB should identify and target firms that require its support and for which it has a comparative advantage in supporting. If AfDB uses the definitions of RMC governments, partner FIs or other IFIs, it should define a methodology for measuring and aggregating impacts at the portfolio level. The strategic review of AfDB’s SME support operations (Genesis Analytics, 2018) provides a detailed analysis, together with suggestions on how to tackle the challenge of defining SMEs. The Africa SME Program’s working definition and practice of verifying if applied definitions can be considered an SME target group in a specific context is a step in the right direction.
· Build on effective approaches to support SME finance. Supporting SMEs to contribute to growth and inclusive economic development requires addressing financial and non-financial barriers, which is best done by a dedicated team that can aggregate all SME-related initiatives. Having a dedicated team helps attract the right expertise and is more likely to set the right incentives for SME finance, which can be skewed toward larger transactions if SME finance is bundled together with other operations that tend to require larger ticket sizes. Further increasing the capacity of AfDB’s 2013 Africa SME Program could be a positive step.
· Move from a pipeline approach to a portfolio approach, focusing on increasing the relevant target portfolio. AfDB should improve its focus on intended target beneficiaries. Instead of determining a list of projects (pipeline approach) for guiding the on-lending to the intended target groups, AfDB should define targets at the portfolio level (portfolio approach). Combined with tighter and strengthened M & E capacity of partners, portfolio-level targets (e.g., the number, volume and percentage of SME loans in the overall lending portfolio) might lead to better results. However, at the strategic level, there needs to be a reflection on how to reconcile objectives such as maximizing financial inclusion of the underserved and job creation. Along the same lines, clearer strategic objectives for on-lending to companies in fragile states could help increase AfDB’s impact in some of the countries that are most in need. Once a portfolio approach is adopted, it would be possible to use a representative sample to measure the results at the end-beneficiaries: jobs, sales, etc. Digital platforms could be used and AfDB should be willing to support FIs in adopting the portfolio approach and to help them increase their level of digitization.
· Use of a more deliberate approach to narrow the gender gap in access to finance. So far, women are mentioned alongside other population groups as intended end-beneficiaries of FSD operations. However, the PARs tend to lack specific considerations of how operations help reduce the gender gap in access to finance. There is broad evidence that women face multiple regulatory, cultural, social and economic barriers that hinder their access to formal financial services, and their participation in the economy more broadly (Morsy, 2020). These barriers cannot be addressed through targeted lending only, but require a gender-transformative approach toward financial inclusion. Aligned with other efforts in the Bank, such as the Affirmative Finance Action for Women in Africa (AFAWA) approved in April 2020, AfDB should reflect on how it can advance women’s financial and economic inclusion through its different instruments, and how it can become more gender-sensitive as an institution. This will require developing a credible results chain on how an operation is likely to address the barriers. It also implies obtaining more gender-disaggregated data on access to finance for women, with a baseline, targets and effective monitoring.
Acknowledgements
We acknowledge the guidance provided by Roland Michelitsch (Evaluator General) and Rufael Fassil (Division Manager) while preparing the evaluation reports on the African Development Bank’s Role in Increasing Access to Finance in Africa.The reports benefitted from a throughout review by Barbara Scola, Stephany Griffith-Jones and William C. Haworth. Special thanks are due to the evaluation Reference Group composed of Stefan Nalletamby, Emmanuel Akinwumi, Cecile Ambert, Dennis Ansah, David Ashiagbor, Suraj Ballogun, Victor Chando, Soumendra K. Dash, Emmanuel Diarra, Lamin Drammeh, Mohamed Kalif, Zoumana Kone, Alain Niyubahwe, Akane Sanankoua Zoupko, Omar Said Sy; the Financial sector development and private sector development managers and staff; the regional and country offices managers and their respective financial sector experts; the managers and the staff of the financial intermediaries as well as end-beneficiaries met during the fieldwork. Gratitude is also due to Bourenane Naceur, Henry Bagazonzya, Paul Derreumaux, John Sande Kanyarubona, Sandrine Alissoutin, Philippe Mutombo, Stéphanie Yoboue, Benjamin Camara, who shared their respective expertise. The contribution of the consultants for the fieldwork was highly useful. They are: Corinne Riquet-Bamba and Moussa Tassembedo for Burkina Faso, Corinne Riquet-Bamba and Justin Bomda for Cameroon, Doha Abdelhamid for Afreximbank based in Egypt, Moses Ochieng, Eric Wanyama and Christine Wangui for Kenya, Marcelina Gaoses for Namibia, Chidinma Lawanson and Godswill Egbe for Nigeria, Zahra Khimdjee for Tunisia. We finally are grateful to insightful comments of anonymous referees. The findings, interpretations and conclusions presented in this paper are the responsibility of the authors.
Annex 1. Acronyms and Abbreviations
AFAWA Affirmative Finance Action for Women in Africa
AfDB African Development Bank
AML/CFT Anti-Money Laundering and Combating the Financing of Terrorism
BDEV Independent Development Evaluation
CPDE Committee of Development Effectiveness
CSP Country Strategy Paper
DFI Development Finance Institution
E & S Environmental and Social
ERG Evaluation Reference Group
ESMS Environmental and Social Management System
ESAP Environmental and Social Assessment Procedures
FSD Financial Sector Development
FSDPS Financial Sector Development Policy and Strategy
IFIs International Financial Institutions
IFC International Finance Corporation
ISS Integrated Safeguards System
LoCs Lines of Credit
MSMEs Micro, Small and Medium Enterprises
NBFI Non-Bank Financial Institution
NSO Non-Sovereign Operation
OECD-DAC Organization for Economic Cooperation & Development – Development Assistance Committee
OSHD Human Development Department
OPSM Private Sector and Microfinance Department
OSGE Governance, Economic/Financial Sector Reform Department
PAR Project Appraisal Report
PIFD Financial Sector Development Department, previously OFSD
PBOs Program Based Operations
RISP Regional Integration Strategy Paper
RPA Risk Participation Agreement
SO Sovereign Operation
UA Unit of Account
Annex 2. Reconstruction of the Theory of Change of the FSDPS

Annex 3. Glossary of AfDB’s Financial Instruments
Elaborated by the authors from AfDB documents.