Effect of Different Raw Materials with Poultry Manure on Composting for Rubber Nursery Production ()

1. Introduction
Expanding the agricultural sector enlarges the disposal of agro-industrial waste in different ways. In many developing countries, removing this waste becomes a problem, and most scientists consider recycling these wastes as an effective way to control environmental pollution. Likely, rubber production in Myanmar requires recycling locally available waste materials as compost for nursery production [1].
Composting is the conversion process of raw organic materials like plant and animal residues into humus-stabilized forms [2]. In this process, locally available waste materials can reuse, and the nutrients contained in those residues can support living plants [3] [4]. Generally, rubber nursery production in Myanmar uses composts as a constituent of the growing medium. Practically, plant waste materials such as lawn clippings, hedges, trees, shrubs, by-products from municipal & domestic parks and gardens, husks, stubble, etc., are used for composting [5]. Under the appropriate composting processes, green garden wastes are excellent sources for growing media. The other waste materials such as clean cardboard, wood wastes, food processing wastes, domestic and commercial kitchen and catering wastes, manures, etc. can be used as compost also. However, materials such as sewage sludge, post-consumer wood waste contaminated with metal, glass, plastic, and potentially toxic preservative materials are not permitted as certified composts [6].
There are variously and widely applied composting methods for industries, namely open static piles, turned windrows & piles, aerated static piles, and in-vessel systems [7]. Different processing methods take one month to several months for composting [8]. The choice of composting technology relies on several local parameters, such as availability of organic waste disposal, the cost of raw materials, the location of the composting facility, the type of compost required by available markets, and environmental legislation [9].
Among different systems of composting, the in-vessel system has many advantages; it requires less space and provides better control for agitation, aeration, and mixing of the compost materials [10]. In-vessel systems, four methods are subdivided. These are the bin method, the rectangular agitated bed method, the silo method, and the rotating tube method [11]. In literature, composting period of an in-vessel composting system can last for 6 to 12 weeks. Among the in-vessel composting systems, the bin method is the simplest, and it can reduce labor requirements, weatherproofing, effective process control, faster composting, reducing land requirements, and qualify output [8].
In the composting process, compost is the end product, and the ratio of carbon and nitrogen (C:N) on the raw materials is a major influent factor [12]. For an effective composting process, raw materials should mix in the C:N ratio of 30:1. pH, moisture content, organic carbon, and electrical conductivity (EC) can also use as indicators for composting [13]. The standards of compost vary across countries. In India, the compost standard for C:N ratio is less than 20, that of pH ranges from 6.5 to 7.5, and total N, P2O5, and K2O content are 0.8%, 0.4%, and 0.4% respectively [14]. Those composts (decaying organic matter) can mix with soils and apply as garden media and potting soils [15].
In Myanmar, Mon State mainly produce paddy, rubber, and oil palm, a large amount of disposal from those industries, such as rice husk, rubber sawdust, twigs and dry leaves from oil palm, etc. are locally available for composting [16]. Also, poultry manure (PM) is one of the locally available raw materials, and it has a C:N ratio of about 5 to 15 [17]. Poultry manure can support as a nitrogen (N) source for the decomposable microorganisms in composting. The addition of PM helps to increase soil moisture, nutrient holding capacity, and to reduce the composting time [18].
Currently, most of rubber nurseries located in Mon State, from where most seedlings are distributed over the country. For successive cultivation of rubber and yearly extension of rubber growing area in Myanmar, the requirement of rubber seedlings is increased [19]. Most rubber growers for nurseries usually use soil as a growing medium. However, loss of the upper soil layer in Mon state is a locally serious problem for growing medium. In addition, using compost in growing media is too costly and not readily available [20]. Local farmers in Mon state want to develop composting methods and effective use of locally available waste materials [1]. Therefore, we conducted this study to investigate the qualities of the different composts made from locally available raw materials in the rubber’s nursery production.
2. Materials and Methods
In this experiment, various composts obtained from locally available different raw materials were examined by using an in-vessel composting system and the bin method. The perforated bamboo baskets known as a conventional local design, were used as composting bins in this experiment. The diameter of the basket was 72 cm and it was 72 cm in height.
2.1. Collection and Preparation of Raw Materials
Composting is made by mixing the locally available raw materials with poultry manure (PM). The raw materials used in this experiment were oil palm frond (OPF), rice husk (RH), rice straw (RS), sawdust (SD), and yard waste (a mixture of grass and dry leaves, YW). All raw materials were by-products of agro-industrial wastes and collected from the paddy fields, rubber wood factories, and poultry farms near the Perennial Crops Research and Development Center-PCRDC, Mawlamyine. After collecting, OPF, RS, and YW were chopped and shredded into small pieces of less than 50 mm before composting [21]. Preparation of raw materials is an important factor because the greater surface area, the slower the decomposition rate.
2.2. Preparation for Composting
For composting, each of the collected raw materials of OPF, RH, RS, SD, and YW were homogeneously mixed with PM to obtain a C:N ratio of 30:1. The amount of materials needed to mix was based on the C:N ratio of composting materials and calculated by using the following equations [11]:
(1)
(2)
where;
XC = Carbon content of material X
YC = Carbon content of material Y
a = Mix content of material X
b = Mix content of material Y
XN = Nitrogen content of material X
YN = Nitrogen content of material Y
C = Carbon content of mix
N = Nitrogen content of mix
2.3. Experimental Design and Treatments
The composting experiment was conducted at the Perennial Crops Research and Development Center (PCRDC), Mawlamyine Township, Mon State, from March to May during 2019. The experimental design was a randomized complete block design with four replications. The spacing was 1.7 m × 1.7 m. The total experimental plot was 20. The experiment contained five treatments:
T1 = Oil palm frond (31.04 kg) + Poultry manure (22.96 kg)
T2 = Rice husk (40.78 kg) + Poultry manure (13.22 kg)
T3 = Rice straw (41.00 kg) + Poultry manure (13.00 kg)
T4 = Sawdust (29.88 kg) + Poultry manure (24.12 kg)
T5 = Yard waste (42.07 kg) + Poultry manure (11.93 kg)
2.4. Composting
While mixing the raw materials, water is usually added to maintain the moisture content about 50%. The moisture content of each material was calculated by using the following equation [22]:
(3)
In which:
Mn = Moisture content (%) of material n
Ww = Wet weight of the sample, and
Wd = Weight of the sample after drying
Firstly, the mixtures were placed in the perforated polythene bag, which was inserted into the bamboo basket and shown in Plate 1(a). Perforated polythene bags were drilled with regular spacing of 32 holes (diameter in 5 mm) at the side of the bag for ventilation and 6 holes at the bottom for drainage. Then, the mixers were turned up and down for aeration at a weekly interval.
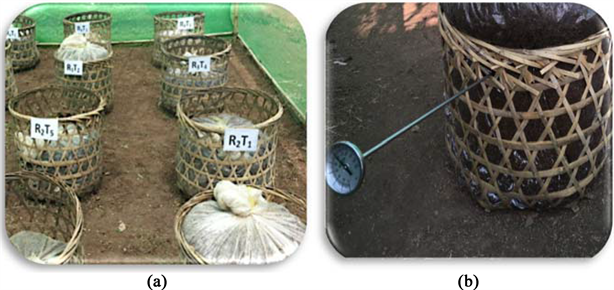
Plate 1. (a) Composting by using bamboo basket and (b) Measurement of temperature.
2.5. Data Collection
The daily temperature inside of the composts was monitored from three sampling points by using a thermometer, as shown in Plate 1(b). The pH and volume reduction (%) were collected weekly. To identify the completion of composting, indicator pH ≥ 7.0 was used [23]. Moreover, the stable volume showed one of the characteristics of well-compost. Then, the samples were air-dried, grounded, sieved with <5 mm mesh, and stored for analysis of the physico-chemical characteristics of the compost, such as bulk density, pH, EC, N, P, K, Ca, and Mg.
2.6. Analysis of Raw Materials and Composts
Before composting and ten weeks after composting, the different raw materials and output composts were analyzed for some characteristics such as pH, EC, organic carbon (OC), total nitrogen (N), phosphorus (P), potassium (K), calcium (Ca), magnesium (Mg) using respective methods [24] [25] [26] [27] [28].
2.7. Statistical Analysis
Analysis of Variance (ANOVA) was performed by the linear model procedure of Statistix (Version 8.0). Mean comparisons were done at the Least Significant Difference (LSD) at a 5% probability level of significance.
3. Results and Discussion
3.1. The Characteristics of Raw Materials
The collected raw materials before composting were sampled and analyzed for their characteristics. The characteristics of raw materials are shown in Table 1. The organic matter content of the composting materials varied from 31.26% to 135.04%. The OPF contained maximum organic matter content (135.04%) and that of PM showed the minimum (31.26%). The greatest C:N ratio (192.03) was observed in sawdust and was followed by oil palm frond (OPF), rice husk (RH),
![]()
Table 1. Some characteristics of raw materials used in this experiment.
OPF―Oil palm frond, RH―Rice husk, RS―Rice straw, SD―Sawdust, YW―Yard waste, PM―Poultry manure, BD―Bulk density, OM―Organic matter, N―Nitrogen, P―Phosphorus, K―Potassium, Ca―Calcium, Mg―Magnesium, C:N ratio―Carbon: Nitrogen ratio.
yard waste (YW), rice straw (RS), and poultry manure (PM) with 100.42, 93.37, 58.07, 51.21, and 5.89, respectively. The highest value of total N content (3.08%) was observed in PM and the lowest was found in sawdust with 0.37%. According to the analysis results, the highest P, K, Ca, and Mg content were observed in PM with values of 2.07%, 1.24%, 6.55%, and 0.70%, respectively. Among the different raw materials, PM had the highest value of bulk density (372.48 kg∙m−3). The bulk densities of OPF, SD, YW, RH, and RS were 194.75 kg∙m−3, 198.7 kg∙m−3, 154.41 kg∙m−3, 144.84 kg∙m−3, and 116.11 kg∙m−3, respectively.
3.2. Changes in Temperature by Using Different Raw Materials during Composting
Changes in temperature of the different composts’ piles were shown in Figure 1. In composting, the initial temperature of all composts with PM was kept near the ambient temperature 27˚C (81˚F). Then, all treatments rose from ambient to higher levels within 24 hours of composting. However, the increase in temperature of the different raw mixtures varied at different composting stages was shown in Table 2. Such a drastic increase in temperature was due to the rapid decomposition of organic raw materials accompanied by various microbial activities [29].
Among the treatments, T5 (YW + PM) reached the thermophilic stage (40˚C to 70˚C) within a short period. For T4 (SD + PM), T2 (RH + PM), T1 (OPF + PM), and T3 (RS + PM), the thermophilic stage started at 3 (days after composting, DAC) and continued through 35 DAC, 39 DAC, 40 DAC, and 50 DAC, respectively. And then the temperature gradually decreases to the ambient temperature at 70 DAC. The temperatures of this thermophilic stage assumed as the most effective and efficient for composting [30]. In the active thermophilic stage of all treatments, a temperature of above 55˚C is sufficient to kill pathogens and
![]() T1 = OPF + PM, T2 = RH + PM, T3 = RS + PM, T4 = SD + PM, T5 = YW + PM, Ambient=Ambient temperature. OPF―Oil palm frond, RH―Rice husk, RS―Rice straw, SD―Sawdust, YW―Yard waste, PM―Poultry manure.
T1 = OPF + PM, T2 = RH + PM, T3 = RS + PM, T4 = SD + PM, T5 = YW + PM, Ambient=Ambient temperature. OPF―Oil palm frond, RH―Rice husk, RS―Rice straw, SD―Sawdust, YW―Yard waste, PM―Poultry manure.
Figure 1. Changes in weekly temperature by different raw materials used during composting compared with ambient temperature.
![]()
Table 2. ANOVA of changes in weekly temperature (˚C) due to the effect of different raw materials with poultry manure on composting.
In a column, means having the same letter are not significantly different at the 5% level. OPF―Oil palm frond, RH―Rice husk, RS―Rice straw, SD―Sawdust, YW―Yard waste, PM―Poultry manure. ANOVA―Analysis of Variance.
weed seeds. In this experiment, T1 (OPF + PM) reached 55˚C at 16 DAC and was maintained the similar temperature for three days. T2 (RH + PM), T3 (RS + PM), T4 (SD + PM), and T5 (YW + PM) reached 55˚C at 9 DAC, 6 DAC, 15 DAC, and 5 DAC and maintained until 14 DAC, 9 DAC, 18 DAC, and 13 DAC, respectively. Compared to maintaining a temperature at 55˚C for two days, all treatments were sufficient for maximum sanitation [31]. During composting, changes in the temperature at the thermophilic stage were significantly different due to different raw material used (Table 1) but for the different com posting process, our results were as similar as [32].
3.3. Changes in pH by Using Different Raw Materials during Composting
The initial pH of the different raw material mixtures varied from 6.17 to 6.67 and the suitable pH for composting different organic wastes has a range of 5 to 12 [33]. Changes in pH from initial to 10 weeks after composting (WAC) are shown in Figure 2. All treatments showed decreasing trends of changes in pH within a week. The reason was due to the decomposition of organic matter by microbial activities and production of organic acids [34]. Then, the pH of all treatments reached neutral after 3 weeks of composting.
This increase in pH to neutral is caused by the conversion of organic acids to CO2 with the help of microbial activities during the composting process [35]. Ten weeks after composting, the pH of all treatments reached above 7. The pH range of 6.9 to 8.3 indicated the end of composting and the end-product recognized as the standard compost [36] [37] [38]. These pH values were significantly different among the treatments. Maximum pH value (7.94) was observed in sawdust compost, T4 (SD + PM) at ten weeks after composting (WAC). That of minimum (7.6) occurred in T1 (YW + PM)-OPF compost.
3.4. Physico-Chemical Properties of the Different Composts
3.4.1. Volume Reduction (%)
Table 3 shows the volume reduction (%) by using different raw materials during composting. The volume reduction was one of the advantages of composting output [23]. All treatments showed a sharply decrease in volume from 1 WAC to 4 WAC. It was related to the thermophilic temperature range (above 45˚C) and
![]() T1 = OPF + PM, T2 = RH + PM, T3 = RS + PM, T4 = SD + PM, T5 = YW + PM. OPF―Oil palm frond, RH―Rice husk, RS―Rice straw, SD―Sawdust, YW―Yard waste, PM―Poultry manure.
T1 = OPF + PM, T2 = RH + PM, T3 = RS + PM, T4 = SD + PM, T5 = YW + PM. OPF―Oil palm frond, RH―Rice husk, RS―Rice straw, SD―Sawdust, YW―Yard waste, PM―Poultry manure.
Figure 2. Changes in weeklypH due to the effect of different raw materials used during composting.
this temperature ensured effective and efficient for composting. Then, the volume reduction (%) was slightly decreased until 8 weeks. This condition was also related to slowly decrease in temperature change and that caused low rate in decomposition of organic matter. At 10 weeks after composting, there was no significant difference among the treatments. However, the lowest volume reduction was observed in T1 (OPF + PM) at zero percent. The highest reduction of 0.91% occurred in T3 (RS + PM). However, the total reduction percent varied with different raw materials from 58.86% to 22.18% as shown in Table 4. Similarly, it was observed by [20] and the actual reduction of the different composts could
![]()
Table 3. ANOVA of volume reduction (%) in weekly interval due to the effect of different raw materials with PM on composting.
In a column, means having the same letter are not significantly different at the 5% level. OPF―Oil palm frond, RH―Rice husk, RS―Rice straw, SD―Sawdust, YW―Yard waste, PM―Poultry manure ANOVA―Analysis of Variance.
![]()
Table 4. Total volume reduction (%) in weekly interval of the effect of different raw materials with PM on composting.
In a column, means having the same letter are not significantly different at the 5% level. OPF―Oil palm frond, RH―Rice husk, RS―Rice straw, SD―Sawdust, YW―Yard waste, PM―Poultry manure.
vary with the different materials used, weather conditions, and the size of the reduction prior to composting. In this study, maximum reduction (58.86%) found in T3 (RS + PM) and that of minimum (22.18%) was in T4 (SD + PM). In the observation of [30], manure could reduce the compost’s volume by 30 to 50%.
3.4.2. Weight Reduction
At the end of decomposition (10 WAC), weight losses from all treatments were significantly different (P < 0.01) at (in Table 5). Maximum reduction (44.18%) occurred in T3 (RS + PM) and that of minimum (31.13%) was in T4 (SD + PM). Similar finding was observed by [39].
3.4.3. Bulk Density
In Table 5, there was a significant difference among different composts at 10 WAC (P < 0.01). Among different treatments, T3 (RS + PM) had the maximum value of bulk density (442.56 kg∙m−3) and that T2 (RH + PM) had the minimum (296.23 kg∙m−3). All values from these treatments were under the standard rate of compost of less than 1000 kg∙m−3 [14].
3.4.4. Electrical Conductivity (EC)
Among the treatments, EC of T1 (OPF + PM) was the maximum value (2.33 dS∙m−1). That of minimum (1.53 dS∙m−1) was observed in T3 (RS + PM) and T5 (YW + PM) (in Table 5). All results in this study reached the standard EC value (<3.5) [36]. As the end product of EC values were related to different salt contents, higher contents of K, Ca, and Mg in T3 were the reason of maximum EC value (in Table 5).
![]()
Table 5. Weight reduction (%), bulk density (BD), electrical conductivity (EC), organic matter (OM), nitrogen (N) and carbon: nitrogen ratio (C:N) of different composts of the effect of different raw materials with poultry manure on composting.
In a column, means having the same letter are not significantly different at the 5% level. OPF―Oil palm frond, RH―Rice husk, RS―Rice straw, SD―Sawdust, YW―Yard waste, PM―Poultry manure.
3.4.5. Organic Matter
At 10 WAC, the organic matter contents of all composts were highly significant (P < 0.01) in Table 5. The largest amount of OM (60.58%) observed in T5 (YW + PM), then followed by T3 (RS + PM), T1 (OPF + PM), T4 (SD + PM) and T2 (RH + PM) with values of 59.08%, 58.27%, 58.17% and 51.02% respectively. Due to the recommended value (≥35%), all composts were in the range [36]. When compared to the reduction percentage before and after composting, the greatest loss of OM (35.9%) occurred in T1 (OPF + PM) and T2 (RH + PM) lost at least (5.25%) as shown in Table 6.
3.4.6. Some Nutritional Contents and Their Variations
Some nutritional contents such as total nitrogen (N), phosphorus (P), potassium (K), calcium (Ca) and magnesium (Mg) and their variations (differences before & after composting) were shown in Tables 5-7.
![]()
Table 6. Variation of physico-chemical properties of different composts as affected by different raw materials with PM on composting over the initial stage of mixture of raw materials.
OPF―Oil palm frond, RH―Rice husk, RS―Rice straw, SD―Sawdust, YW―Yard waste, PM―Poultry manure OM―Organic matter, N―Nitrogen, P―Phosphorus, K―Potassium, Ca―Calcium, Mg―Magnesium.
![]()
Table 7. Total P, K, Ca and Mg of different composts at 10 WAC.
In a column, means having the same letter are not significantly different at the 5% level. OPF―Oil palm frond, RH―Rice husk, RS―Rice straw, SD―Sawdust, YW―Yard waste, PM―Poultry manure P―Phosphorus, K―Potassium, Ca―Calcium, Mg―Magnesium.
Nitrogen content (N) in different composts was highly significant at P < 0.01 (Table 5). Maximum content of N (2.66%) showed in T5 (YW + PM) which variation was increased to 111.11% (Table 6). The minimum N content (1.51%) was in T2 (RH + PM) and this value occurred under the standard rate of N (≥1.0%) for compost [36]. The reason was that available nutrients released during composting [34]. Statistically, T3 (RS + PM) showed the significant difference in P, K, Ca contents among the treatments at P < 0.01. Wherein T2 had the lowest contents in all measured nutrients. Other three composts showed the proper amount of nutrients (Table 7). When compared in increment of P, T5 (YW + PM) showed the maximum value of 275.54%. In the increment of Ca & Mg, T3 (RS + PM) showed the largest 177.72% and 269.38%. In potassium, the largest increase occurred in T4 (SD + PM) (in Table 6).
Although the initial C:N ratios of all treatments were the same as 30:1, those of the final products from different composts at 10 WAC were significantly different at P < 0.01 (Table 5). C:N ratios of four composts except T2 (RH + PM) were lower than 15 which was described as the maturity index [40]. Among them, T5 (YW + PM) provided the lowest C:N ratio of 13.2. The reason for lower C:N ratios after composting was that microorganisms utilized carbon as an energy source and as a basic building block, and they were making up about 50% of the mass of microbial cells during composting [30]. The reason of high C:N ratio in T2 (RH + PM) was that RH contained high content of silica and lignin. It was difficult to degraded [41].
4. Conclusion
The present study conducted to fulfill one of the demands for local growers in the rubber nursery production in Mon State. According to changes in temperature and pH, the local raw materials adding poultry manure were composted completely after eight weeks. Although the volume of all composts did not change after 8 weeks, some nutrient contents of tested composts with the bin method showed differently at 10 weeks. Composts from the yard waste, rice straw, and sawdust with proper C:N ratios had maximum P, K, and Ca, respectively. Wherein, rice husk compost contained the lowest N, P, K, Ca, and Mg with the maximum C:N. Thus, composts from yard waste, rice straw, and sawdust could be selected as a constituent of potting medium for raising the nursery seedlings. This study also suggested to compare the growth of nursery seedlings and to investigate further agronomic characters & micro-organisms application in rubber production.
Acknowledgements
My thanks are extended to all of my teachers at Yezin Agricultural University for their guidance during my studies. I would like to extend my sincere gratitude to U Tun Tun Htwe, Director, and Head, Perennial Crops Division (PCD), DOA, for his administrative and financial support. My thanks are extended to the staff of the Soil and Plant Nutrition Department, PCRDC, Mawlamyine, for their eagerly help in analytical processes.