Effects of Institutional Quality on Environmental Protection in CEMAC Countries ()
1. Introduction
Over the last thirty years, there has been renewed interest in the issue of the quality of institutions for environmental conservation in developing countries in general and in countries belonging to the CEMAC1 in particular. The reason is that this area has a potential of more than 240 million hectares of forest cover (De Wasseige et al., 2016) , which is necessary to reduce carbon dioxide (CO2) emissions. This forest cover constitutes a resource that can be exploited for development needs and a resource for the protection of the environment. Thus, reconciling these two objectives (development and environmental protection) requires the involvement of institutions. According to North (1994) , institutions are human-designed constraints that structure political, economic and social interactions. The quality of institutions is likely to affect various development objectives, hence the need to examine its effects on environmental protection. The problem of the effects of institutional quality and environmental protection remains a major challenge in terms of both the literature and factual evidence.
In the literature, there are two opposing arguments. On the one hand, there is work (Paehlke, 1996; Olson, 1993; Welsch, 2004; Bhattarai & Hamrnig, 2001) that argues that institutions play an important role in preserving the environment. In this regard, Iheonu et al. (2017) find that institutions are likely to ensure a good-quality environment, arguing that nondemocratic regimes or autocracies are less likely to provide public goods such as environmental protection (Hughes & Lipscy, 2013) . On the other hand, there are works (Dryzek, 1987; Dessai, 1998; Fredriksson et al., 2004; Pellegrini & Gerlagh, 2006; Biswas et al., 2012) that postulate that the effect of institutions on environmental preservation is marginal or even negative or neutral.
From a factual point of view, CEMAC member countries constitute a particularly interesting field of investigation for examining the relationship between the quality of institutions and the environment. Indeed, most CEMAC member countries are characterized by a low level of governance (World Bank, 2019) . To illustrate, statistics related to the Corruption Perception Index (CPI) published annually by Transparency International indicate that more than two-thirds of African countries in general and of CEMAC member countries in particular have a CPI of less than 3.5 on a scale of 1 to 10.
In addition, Transparency International’s publications on the CPI in 2014 show that, on average, 4 to 5 African countries are among the 10 most corrupt countries in the world. These statistics are indicative of institutional failures (unsustainable forest management, the installation of polluting industries) that can contribute to environmental degradation. On the institutional level, these countries are also characterized by a low level of freedom of expression and accountability, which inhibits any constructive discussion on environmental conservation; indicators of institutional quality are very low, and their level (−2.5) is far below the African average of 3.5.
One bright spot in this bleak picture is that CEMAC member countries have committed to political pluralism to improve their governance, among other things. This new orientation to the detriment of singlepartyism has also required economic and financial reforms to strengthen institutional structures, which should provide incentives for better environmental regulation (Tamazian et al., 2009) . Therefore, with regard to the institutional reforms implemented by CEMAC member countries, the problem of this paper can be summarized by the following central question: what are the effects of the quality of institutions on environmental protection in the CEMAC region?
The answer to this question highlights the effects of the quality of institutions on environmental protection in the CEMAC zone. Despite the low level of institutional quality in this zone, it is argued in this paper that institutional quality has positive and significant effects on environmental protection in the CEMAC zone.
The remainder of this paper is organized as follows: the second section reviews the literature; the third section presents methodological aspects; the fourth section deals with the estimation of the model and the interpretation of the results; and, finally, the fifth section is devoted to the conclusion and policy implications.
2. Review of the Literature
The effects of the quality of institutions on environmental protection have been the subject of abundant theoretical and empirical studies.
On the theoretical level, it is possible to divide this literature into two groups. On the one hand, there are works (Paehlke, 1996; Olson, 1993; Welsch, 2004; Bhattarai & Hamrnig, 2001) that argue that institutions are an asset for environmental protection. On the other hand, there is work (Dryzek, 1987; Dessai, 1998; Fredriksson et al., 2004; Pellegrini & Gerlagh, 2006; Biswas et al., 2012) that relativizes this point of view by highlighting the braking effect of institutions on environmental protection.
Regarding the first group, researchers such as Paehlke (1996) , Olson (1993) and Welsch (2004) have supported the idea that institutions are not detrimental to the preservation of the environment. Indeed, it has been found that good governance goes hand in hand with better environmental protection. Therefore, Olson (1993) and Welsch (2004) justify this finding by the fact that quality institutions such as the rule of law, the absence of corruption and quality democracy have positive and significant effects on environmental protection. The analyses of Bhattarai and Hamrnig (2001) and Iheonu et al. (2017) note that political rights and civil liberties lead to a reduction in the rate of environmental degradation. The same authors (Bhattarai & Hamrnig, 2001) realize that good governance and democracy have positive effects on environmental protection. Similarly, in theoretical analyses, Culas (2007) realizes that a good implementation of contracts by governments reduces the rate of environmental degradation.
Regarding the second group of works, some authors, such as Dryzek (1987) , have already pointed out that democracies or the quality of institutions is a component of economies in which pressure groups are important. According to this author, democracies are still not protective of the environment because they are supposed to satisfy the preferences of pressure groups and those of the market, which are not always compatible with the objectives of sustainable development. Similarly, Dessai (1998) and Fredriksson et al. (2004) realize that the quality of institutions, such as political stability, democracy and the rule of law, do not promote environmental protection, as these factors favor economic growth and development that can be detrimental to environmental preservation. Authors such as Dessai (1998) and Pellegrini and Gerlagh (2006) note that institutional frameworks affect how policy makers respond to environmental concerns. In this regard, they argue that by promoting the unsustainable exploitation of natural resources, corruption contributes to environmental degradation. In the informal sector, which is riddled with corruption, Dutt-Lahiri (2004) and Biswas et al. (2012) show that polluting firms evade environmental regulations, thus contributing to environmental degradation.
The theoretical literature shows that it is difficult to predict the effects of institutional quality on environmental conservation. Therefore, this work has given rise to highly controversial empirical conclusions. We thus distinguish between works that highlight the negative effects of institutional quality on environmental protection, on the one hand, and works that show the opposite, on the other hand.
Regarding the empirical findings that support the existence of negative effects of institutions on the environment, many authors, such as Panayotou (1997) , Bernauer and Koubi (2009) , Kinda (2011) and Nkengfack et al. (2020) , realize that the quality of institutions has negative effects on environmental protection. Thus, using a sample of 30 developed countries for the period 1982-1994 and a set of five indicators of institutional quality obtained from Knack and Keefer (1995) , Panayotou (1997) finds that, all other things being equal, a 10% improvement in institutional quality leads to a 15% reduction in CO2 emissions.
However, the quality of a country’s economic policies and the quality of its institutions can significantly reduce environmental degradation. Using a large sample of 105 - 143 countries, Li and Reuveny (2006) show that the quality of institutions (democracy) has negative effects on environmental degradation. Similarly, testing the effects of political institutions on environmental protection in 42 countries over the period 1971-1996, Bernauer and Koubi (2009) find three results: first, democracy has a positive effect on environmental protection; second, presidential regimes favor environmental protection more than parliamentary regimes; and, third, the strength of trade unions reduces environmental degradation. In the same vein, using panel date in their various analyses, Apergis and Ozturk (2015) find that democracy, control of corruption, and political and civil liberties reduce CO2 emissions. In a study carried out in theEconomic Community of Central African States (ECCAS) zone using generalized least squares (GCM) and double least squares with instrumental variables (DMC-IV), Nkengfack et al. (2020) find two results: first, GHG emissions follow a sinusoidal or cyclical trend in the ECCAS zone; second, improved governance significantly mitigates pollution emissions in the countries considered. Therefore, strengthening governance programs and improving the quality of institutions will contribute to reducing global GHG emission levels.
Moreover, it is fair to say that for several authors (Bernauer & Koubi, 2009; Apergis & Ozturk, 2015; Nkengfack et al., 2020) , the quality of institutions is conducive to environmental preservation, while other authors believe that it is not (Dessai, 1998; Midlarsky, 1998; Barrett & Graddy, 2000) . For example, Dessai’s (1998) results, obtained in the case of ten developing countries, show that corruption is a major source of environmental degradation. In the same framework of ideas, Midlarsky (1998) , who uses dynamic ordinary least squares (DOLS) regressions, finds that democracy increases CO2 emissions. In the same vein, in the case of the USA, Torras and Boyce (1998) , who use the same methodology as Midlarsky (1998) , show that the quality of institutions (political and civil liberties) has positive effects on environmental protection. Finally, using the instrumental variable technique on a sample of 94 countries over the period 1987-2000, Cole (2007) shows that corruption has positive effects on environmental protection.
Two lessons can be drawn from the theoretical and empirical literature. The first lesson lies in the fact that work on the CEMAC zone is almost absent outside the work of Nkengfack et al. (2020) . In this respect, this work contributes to the literature on the effects of institutional quality on environmental protection.
Finally, the second lesson drawn from this literature review is the nonexistence of a linearity of results. Some authors (Dessai, 1998; Midlarsky, 1998; Cole, 2007) believe that the quality of institutions has positive effects on environmental protection, while others (Panayotou, 1997; Bernauer & Koubi, 2009; Nkengfack et al., 2020) realize that it has negative effects. The nonlinearity of these results may be due to several reasons, such as the field of investigation, differences in methodologies, the choice of control variables, and the type of data used to approximate the different variables.
3. Methodologies and Data
The analysis of the effects of the quality of institutions on environmental protection in the CEMAC zone mostly implies researching either the nature or the magnitude of these effects. The aim here is to determine whether the quality of institutions contributes to the preservation of the environment. For this purpose, the first part of this section presents the specification of the model, and the second part presents the interpretation of the results.
3.1. Specification of the Empirical Model
In this paper, we use the IPAT/STIRPAT model in the multiplicative form of the accounting identity originally developed by Ehrlich and Holden in 1971 . This model assumes that I represent total carbon dioxide emission, measured in tons; P represents the total population; and C and T represent consumption and technology, respectively. Thus, this relationship can be written as follows:
(1)
where α, β and γ represent elasticities.
With reference to a number of works, such as those by Grossman and Krueger (1991, 1995) , the quality of institutions (IQ) is of paramount importance in explaining environmental protection in that it guarantees the application of legislation (which deters bad practices) and defines property rights. Doing so creates a sense of ownership and prevents the misuse of environmental resources. Thus, Kaya (1990) expands this IPAT model, adding a number of variables such as energy intensity and dependence on fossil resources instead of technology, while in this work, technology is replaced, after manipulation of the IPAT model, by a product X, which is composed of the institutional quality (IQ) variable, with investment and agriculture as control variables. Thus, Equation (1) is transformed as follows:
(2)
where I = EQ represents CO2 and P = CPT is the indicator of population dynamics (e.g., population growth) and C is energy consumption (EC). Thus, Equation (2) can be rewritten as follows:
(3)
Based on the empirical form, which thus includes the constant and the error term, Equation (3) will be linearized in semilogarithmic form (Kaya, 1990) . Hence, Equation (3) can be written as follows:
(4)
where:
i is a country, t is time, λ0 is the constant, and ε is the term error.
is a proxy that captures the environmental quality of country i at time t. This gas is the main greenhouse gas.
is the structure of the economy of country i in period t. It is represented by the six governance indicators of Kaufmann et al. (2010) : voice and accountability, political stability, government effectiveness, the quality of regulation, the rule of law and control of corruption.
is the growth of the total population of country i in period t.
is the gross fixed capital formation of country i in period t. It is used as a proxy for national investment in the development of CEMAC countries and is responsible for environmental degradation.
is the agricultural value added, which is used to examine its influence on the environmental degradation of country i in period t.
represents the energy consumption of country i in period t, which captures the average propensity to consume energy of CEMAC member countries.
For the purpose of this analysis, the estimation of the model specified above will be performed using the OLS technique. This technique leads to nonconvergent estimators due to the asymptotically biased distribution associated with the presence of autocorrelation in the data (Kao & Chen, 1995; Pedroni, 2000; Kao & Chiang, 2000) . These problems, which also exist in the case of models specified in the form of time series, are also observed to be very acute in the case of panel models, particularly in the presence of heterogeneity (Kao & Chen, 1995) . As is the case for the CEMAC zone, other methods can be used, namely, the FM-OLS (fully modified ordinary least squares) method proposed by Phillips and Hansen (1990) and the dynamic ordinary least squares (DOLS) method of Saikkonen (1991) and Stock and Watson (1993) . The FM-OLS method allows us to deal with the biases of the endogeneity of exogenous variables, autocorrelation and heteroskedasticity.
In addition, in small finite samples, by examining the properties of the OLS, FM-OLS and DOLS estimators, Kao and Chiang (2000) show that OLS estimators are biased and that FM-OLS estimators do not provide substantial improvements. They conclude that the DOLS estimator provides better results than the other two estimators. Indeed, the DOLS approach is appropriate in the case of CEMAC member countries for the following reasons: the small number of individuals (06 countries) and the short study period (1996-2017). Finally, the specificity of this method resides in the introduction of the lagged values of theexogenous values in the model to resolve the correlation problem between the error term and the explanatory variables.
3.2. Data and Estimation Procedure
3.2.1. Source of Data
The data used covers the six (06) CEMAC countries, namely, Cameroon, Gabon, Equatorial Guinea, Central African Republic, Republic of Congo, and Chad. They cover the period from 1996-2017. All these data are extracted from the World Bank’s World Development Indicators database.
3.2.2. Evolution of the Quality of Institutions and That of Environmental Protection in CEMAC Member Countries
To better understand the importance of the issue addressed in this work, it is essential to take stock of the evolution of the relationship between the quality of institutions and environmental protection in the CEMAC countries. This relationship is shown in Figure 1 below.
This figure shows that, on average, the deterioration of institutional quality indicators is accompanied by the deterioration of the environment in CEMAC member countries. Thus, there is a wide disparity between Gabon and the rest of the CEMAC member countries. While the majority of CEMAC member countries show a low correlation intensity (between 0 and 1), Gabon shows a high correlation intensity between 3 and 4. This result could be because, on average, the quality of institutions in Gabon is much lower than that in the rest of the CEMAC member countries.
3.2.3. Estimation Procedure
In this work, the approach leading to the estimation is based on the following three points: 1) the descriptive statistics (Annexes) of the variables to see the trends and dispersions of the variables under study, 2) unit root tests to know the order of integration of the selected variables, and 3) cointegration tests to know whether these variables have a long-term relationship. The descriptive statistics of the variables are presented in Table 1 below:
![]()
Table 1. Descriptive statistics of the variables.
Source: Author based on results obtained from EViews 9.
![]()
Figure 1. Evolution of institutional quality and CO2 indicators from 1996 to 2017. Source: Author based on World Bank data.
Table 1 highlights the results of the descriptive statistics of the central tendency (mean, maximum, and minimum) and dispersion (standard deviation) of the variables under study. According to these results, the averages were 1.431964, −1.32 × 10⁻⁹, 2.896307, 30.87345, 20.27906 and 4.742632 for CO2, the institutional quality index, population growth, gross fixed capital formation, value added and energy consumption, respectively. With regard to the dispersion of the variables around their respective averages, these results reveal the existence of a low dispersion of the variables around the average overall. This dispersion is all the more justified in view of the values of the standard deviations of the variables, which are very far from their averages.
1) Unit root test
To determine whether our different series are stable in the period from 1996 to 2017, we used the first-generation tests of Levin, Li and Chu (2002) and Im, Pesaran and Shin (2003) , which are based on the hypothesis of independence of individuals. The application of these tests led to the results summarized in Table 2:
![]()
Table 2. Stationarity test results.
Source: Author based on results obtained from EViews 9. Notes: The significance thresholds used are 1% (***), 5% (**) and 10% (*).
In the first difference, considering the LLC, IPS and Hadri tests, all the variables are stationary and are therefore integrated of order one [1]. This observation allows us to continue the study of the dynamic properties of the variables with the cointegration test.
2) Cointegration test
To avoid estimating a spurious relationship between the quality of institutions and environmental protection in the CEMAC zone, we conducted Pedroni’s (1999) cointegration test, which assumes the absence of interindividual dynamics. The application of this test gives the results recorded in the following Table 3.
From the results of Pedroni’s (2000) cointegration tests, we see that all the statistics in a within panel within (panel: Rho, PP and ADF) and in a between panel (group: Rho, PP and ADF) are lower than the critical value of the normal distribution,and these results are significant at the 1% level. Thus, all these tests confirm the existence of a cointegrating relationship. Therefore, the statistics of Pedroni’scointegration test allow us to conclude whether or not there exists a long-term relationship between the variables; they do not provide an estimation using the VECM.
To obtain these results, we proceeded by searching for the existence of a cointegrating relationship between the quality of institutions and the preservation of the environment, population growth, gross fixed capital formation, agricultural value added and per capita energy consumption. We used Pedroni’s (2000) test based on a method similar to Engle and Granger’s (1987) method based on time series with the following data-generating process:
,
Avec N = 138, T = 6,
is the explained variable (QE), i represents a fixed effect taking into account unobserved heterogeneity, and
is considered a vector of size K, i.e.,
, where K is the number of explanatory variables, N is the number of observations, and T is the number of countries.
![]()
Table 3. Results of panel cointegration tests for CEMAC.
Source: Author based on results obtained on Stata 14.
Hence, having found the existence of the long-term relationship from Pedroni’s (2000) test, it is now essential to apply an efficient method to estimate systems of cointegrated variables based on panel data. To do so, several techniques can be distinguished: the FMOLS (fully modified ordinary least squares) method proposed by Phillips and Hansen (1990) and used by Pedroni; the DOLS (dynamic ordinary least squares) method of Saikkonen (1991) ; the generalized method of moments (GMM); and the error-correction estimators (ECM) of Pesaran and Shin (1999) , namely, the pooled mean group (PMG), the mean group (MG), the dynamic fixed effect (DFE) and the static fixed effect (SFE) estimators.
Out of all these methods, we retain the DOLS method because it is appropriate for estimates of small numbers of individuals (6 countries) and a small number of observations (34 years). It implies an arbitrary choice of lags.
4. Presentation and Interpretation of the Results
We present, in a first step, the results of the estimation and, in a second step, the interpretation of the results.
4.1. Presentation of the Results of the Dynamic Model of the Effects of the Quality of Institutions on Environmental Protection
Since environmental degradation is a long-term phenomenon, we consider only the long-term results. The results obtained by applying this method within the framework of this work are recorded in Table 4 below:
The results obtained suggest that the variation in exogenous variables explains 90% of the variation in environmental quality (CO2). This R2 value is justified by the fact that the model is specified as a panel based on a sample of 178 observations. To take into account the dynamic evolution of these different factors that influence CO2, this number of observations is obviously important. The results obtained realize that when the quality of institutions increases by 1 point, CO2 decreases by 0.38 metric tons per capita. Indeed, the results obtained show that
Source: Author based on result obtained from STATA 2014.
the control variables (population growth, per capita energy consumption) have positive effects that are significant at the 1% level, which rules out the possibility of a carry-over effect on the variable of interest. The results obtained due to the quality of institutions in the CEMAC zone are likely to strengthen environmental protection. These results corroborate those obtained by Apergis and Ozturk, 2015 and Nkengfack et al., 2020 . On the other hand, these results contradict those of Dessai, 1998 ; Midlarsky, 1998 and Cole, 2007 .
4.2. Interpretation of the Results
The results obtained make it possible to draw a lesson: the quality of institutions is a factor in improving environmental protection in CEMAC member countries. Indeed, improving environmental protection in CEMAC member countries is highly dependent on the commitment of public authorities to international legal mechanisms and the hundreds of international conventions on environmental protection to which CEMAC countries are party. All of these texts (conventions, treaties, protocols, international agreements, etc.) constitute the corpus of environmental legal texts that help give substance to environmental protection. Their proliferation undoubtedly reflects the strong will of the public authorities of CEMAC member countries to use legal tools to resolve environmental issues.
Similarly, the quality of institutions in CEMAC member countries is low, and a series of factors could explain why CEMAC member countries, at an early stage of governance quality, often comply with the various texts required for environmental protection. In addition, most countries in this subregion adjust their behavior based on the requirements of public authorities and international conventions for environmental protection. These trends further justify the interest in the low quality of institutions for preserving the environment in this subregion.
However, following the example of the public institutions that these CEMAC member countries have put in place, the recognition of environmental nongovernmental organizations (NGOs), which are part of the national and international institutions in the implementation of environmental preservation and which are actors in environmental protection, has not had the expected effects.
Indeed, several political, social and environmental crises have favored the emergence and consolidation of such organizations in an international context favorable to the consideration of all social actors in environmental protection. Likewise, the framework law on the environment does not expressly specify the place and role of NGOs in the environmental protection undertaking.
Furthermore, according to the provision of this law, all private institutions are required, within the framework of their competence, to raise awareness of environmental problems among the population as a whole. This is what environmental NGOs strive to do on a daily basis to contribute to the proper management of environmental protection in CEMAC member countries.
5. Conclusion and Policy Implications
The objective of this article was to highlight the effects of institutional quality on environmental protection in CEMAC member countries. To achieve this objective, we conducted econometric analysis based on panel data covering the period 1996 to 2017 and used the dynamic ordinary least squares (DOLS) technique. The results obtained suggest that the quality of institutions is a factor in improving environmental protection in CEMAC member countries.
From these results, some policy implications can be suggested. On the one hand, it is essential for countries to reform their institutional setup by improving anti-corruption mechanisms, compliance with regulations and government efficiency. On the other hand, these countries need to put in place reforms of their legal and institutional framework so that they are equipped with strong institutions to deal with environmental problems in this geographical area.
The main limitation of this paper is the lack of financial resources, which did not allow for a field survey of households or public administrations in the six CEMAC countries. This would allow the use of qualitative data models to better capture the real effects of institutional quality on environmental degradation. This weakness is an avenue to explore for future work, if the data ever allow it.
Annexes
Graph A1 and Graph A2 represent the machine outputs of the estimation of the model (dynamic ordinary least squares technique) of the relationship between institutional quality and environmental protection in the CEMAC countries.
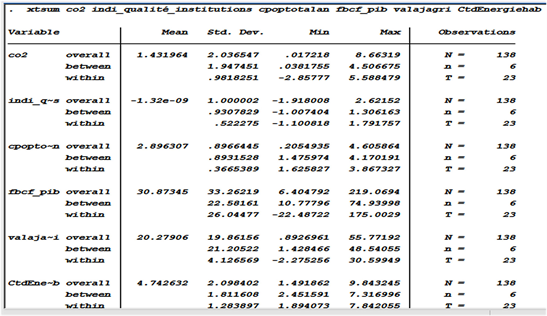
Graph A1. Descriptive statistics of variables. Source: Author, based on results from Stata 14.

Graph A2. Results table. Source: Author, based on results from Stata 14.
NOTES
1Cameroon, Gabon, Equatorial Guinea, the Central African Republic, the Republic of Congo, and Chad.