The Effects of Mergers & Acquisitions on Financial Performance: Case Study of Acquisition of BG Group by Royal Dutch Shell ()

1. Introduction
Mergers and Acquisitions have always faced strategic managers and financial analysts who have dramatically contributed to a situation where companies increasingly find it difficult to stay competitive due to the high competition emerging from the rapidly evolving global market. In order to counter the impact of mergers and acquisition on corporate financial results, a range of research has been performed in developed and developing countries. A researcher [1] was carried out a study on a manufacturing business; in Japan, [2] in Greece manufacturing industry, [3] in Hong Kong’s production companies, and a researcher [4] conducted a study in Philippines on banks. Most previous studies on fusions and acquisitions use financial variables such as returns on investment, gross profit margin, capital returns, business growth, the overall ratio of assets, net value returns, and operating profit margin as study variables. The resulting costs and benefits of merger and acquisition, according to a study [5], are indeed a corporate problem, and can have a positive or negative effect on the company’s results. The business shareholders and their agents therefore face problems to decide that strategic actions and choices would boost the financial performance of the company [6]. While it has always been considered as a very challenging topic for business leaders to consider the problem of merge and procurement. As many Merger and Acquisition literature and economic theories demonstrate, fusion and acquisition shareholders do not have a positive impact on their income as a result of their expected post-fusion value development [7]. The value of shareholders will increase as a result of the acquisition activities. Besides another study [8], explained that the valuation of the acquired business would also increase other than to work individually. Another researcher [9] has also found that restructuring operational practices typically used by moderately successful start-ups and this operation also contributes to a significant loss of the business in the face of fusions and acquisitions problems.
1.1. Oil and Gas Industry
The global petroleum and gas industry were and still remained affected by world economic and political developments. The industry has emerged from a series of political and economic breakthroughs in its current oligarchic competitive structure, continuously pushing it to restructure.
At the beginning of the 1950’s, the Iran Government’s decision to nationalize the English-Irish petroleum corporation reorganized the industry with the advent of a US pressure-led cartel of oil firms to replenish the plentiful supply of Iranian oil on the world market to regulate oil prices. This 7-man cartel was strong enough to push relatively weak companies out of the market because they were not able to keep profits at their current rate of production. For a number of decades, this cartel dominated the global oil industry before OPEC was formed in the 1960s. The OPEC was an intergovernmental organization consisting of 13 countries which, collectively, controlled 73% of the world’s oil. The organization is founded with the objective of a (stated) mission “to coordinate and harmonize its Member States’ petroleum policies and ensure the stability of the petroleum markets in order to secure effective, economic and periodic supplies.” This control of the oil supply made them completely strong over the industry and counteracted the domination of the US, which led to the creation of the dominant state owned oil companies, mainly owned by OPEC Member States. The predominance of state-owned oil companies that control the oil industry formed the present oligarchic structure of the industry. Initially not big corporations were merged together into industrial giants that could compete with certain state-owned enterprises. As a result, a few giant multinationals are formed which currently dominate the global oil and gas industry.
1.2. Impact of the Global Economy
The worldwide economic crisis of the financial markets in 2008-2009 changed the structure of many sectors around the world significantly. A boom in commodity prices has affected the global recession since this crash. Since the beginning of the decade, gasoline prices had risen to a record high of $150 when the crisis began in 2008. This was possibly because of a rapid growth of demand as investors fought to “secure” their holdings by transferring them to the commodity market. Demand growth outpaced oil supply inflation and led to a “boom” in oil prices. This lucrative opportunity could also have served as an indication to “cash” oil companies by explores new ways of reacting to this demand. The boom did not last long and when the dust settled, investment moved from commodities, causing a shock in the price of oil in 2009 that dropped to a low of 40 dollars per barrel. This put increased pressure on oil manufacturers to look for economical production methods.
In its entry into the current decade, the global economy can be defined by four characteristics: Round crude oil demand in the slowed-down economic growth of the recession, A Middle East political instability, which increased the risk of investment in oil, US production of oil, which was hit by the finding of shale oil extraction methods, and finally “The inactivity of the industry, i.e. The management of oil supply by Saudi and Russia.” Both of these factors resulted in the current global oil price crisis. In 2015, the cost of 90 - 100 dollars per barrel, which seemed to be “normal,” fell by as low as 40 dollars per barrel. The world oil and gas industry was affected by this crisis.
1.3. Royal-Dutch Multinational Shell PLC
Shell is an oil and Gas Company, which is also known as Shell is the fifth-largest company globally, and headquarter is in Netherland and also incorporated in the United Kingdom. The main company is primarily has listed on London Stock Exchange. In February 2016, it had secondary listings on Euronext Amsterdam and the New York Stock Exchange as it has the largest global activity around the world. Shell Group one of the top six supervisors in the petroleum and gas industry was formed in 1907. It was founded in the United Kingdom as a subsidiary of the Royal Dutch Shell Plc, but, thanks to its Dutch roots. It now operates in over 70 countries with an average staff base of 93,000 to justify its position among the world’s seven largest corporations based on revenues. Shell is classified into three categories: upstream, integrated gas and downstream. The top-level category includes the exploitation, recovery and transportation of crude oil and gas to the refineries and ultimately customers from its extraction points. The division contains both the operations of deep water and the Shale. The Integrated Gas Division focuses primarily on manufacturing and distribution of Liquefied natural gas (LNG) products and other gas-to-liquid products, as well as their marketing, production and control. Downstream focuses on its refining operations management and on the global distribution of its broad variety of oil and chemical products. A significant part of Shell’s sector is focused on oil extraction, boiling, refining and transportation. The company is fundamentally engaged in almost all stages of the production of oil and gas; from its exploration and growth through to the processing, transport and distribution of a variety of goods. The shareholding of the corporation is divided into two groups of common shares; A&B. The former is traded mainly on the Euronext Amsterdam Bourses while the latter is listed on the London Bourses. Its equities are also exchanged in the form of US depositary receipts (ADS’s) at the New York stock exchange. The market capitalization is around £168.6 billion on 26 October 2016. Shell manages the upstream business outside of North and South America by focusing on manufacturing, distribution, and marketing activities for oil products and chemicals. Also, manufacturing and supply oil includes a refinery, supply, and shipping of crude oil has done by Shell. They are also focusing on renewable energy from early 2000 and investments in solar power, wind power, hydrogen, and forestry, which are renewable energy.
1.4. BG Group PLC
BG Group is a multinational corporation, originally British, mainly engaged in the discovery and manufacturing of LNG products. It was originally formed in 1997 when it was a precautionary company; British Gas was split into two companies: BG plc and Centrica plc. The former acquired British Gas exploration and downstream operations while the Latter was responsible for retail business. BG plc, which was again demerged in 2000, formed the Transco trans-commercial firm BG Group plc and Lattice Group plc. As a result of this emergence, BG Group plc has gained only the exploration and manufacturing potential for LNG that BG plc had previously introduced. Since then the company has gained a foothold in Liquefied Natural Gas production and exploration. With more than 5000 staff, the organization has increased to extend its activities, currently in more than 20 countries. To turn its existence from the first offshoot into a global producer of LNG.
BG Group plc’s business activities concentrate strategically on two areas: successful resource discovery and LNG development. By consistently demonstrating the successful management of its primary operations, the organization has built a strong footprint in the industry. On the scene of the exploration, BG Group Plc has demonstrated exceptional success because of the strategic emphasis on discovering and exploiting LNG sources worldwide. Driven by a combination of an elaborate and lean infrastructure base and a concentrated growth of its geological and technical skills, exploratory operations are carried out. Flexibility to supply and extract natural gas resources around the globe characterizes development activities of the company. A diverse base of supply sources worldwide has also been a significant factor in reducing the company’s risk and costs.
BG Group plc’s equity structure is focused primarily on the production of common share capital exchanged mainly on the London Stock Exchange. ADR listed under OTCQX International Premiere will also extend its shareholder base to the US (Over-the-counter market). The Company’s equity ownership was quite simplistic, due to Candidate Companies’ 81 percent equity shareholdings, which showed the company’s strategic decision to have leverage over their investors.
The company had operation around 25 countries across Africa, Asia, Australasia, Europe, North America and South America. They can produce around 680,000 barrels of oil per day. Beside oil they had Liquefied Natural Gas (LNG) business and United States was the main customer of LNG. BG group was listed under London Stock Exchange. BG Group owned its gas pipelines and also focusing on power generation project.
2. Merger and Acquisition of Royal-Dutch Multinational Shell PLC and BG Group PLC
In this analysis a Merger and Acquisition event happened between Royal-Dutch multinational Shell plc and BG Group plc. The core businesses of those two companies are same as they involved in oil and gas. Shell is the largest oil and gas company. Basically they search for oil by using technical and commercial expertise, transport the crude oil, refine it and finally establish marketing all over the world. They also focused on the same way of natural gas. They have vast operation on globally, so that their business has been diversified on domestic as well as international. They have done their operation over 100 countries with 40,000 patrol stations over the world and 47 refineries which help them to boost growth on global economic condition and capture significant market share. The targeted company is BG group which also focused on exploring and extracting oil and gas and also production of liquefied natural gas. They sell these products to the wholesale market and various retail gas or electricity suppliers. They had operation around 27 countries in the world and mainly they have two segments of operation. The gas segment only focused on exploring and developing natural gas and the other one is to explore, extract and develop the crude oil. The key date and event of the Merger and Acquisition are as below [10]:
・ 7 April, 2015: Royal-Dutch multinational Shell plc and BG Group plc. Officially declared that Shell director board will acquire BG group and will pay shareholders around £1350 per share, which was around 50% premium on BG Group’s share price.
・ 11 April, 2015: Both Royal-Dutch multinational Shell plc and BG Group plc. Held a meeting to state the transection call and setting up the clause. They also decide the expected date for fulfill the regulation process and completely acquire the targeted company in 2015 of last quarter.
・ 11 June-19 November, 2015:
a) They reviewed the Merger Process Guidelines under ACCC commenced.
b) The Former acquisition in 3 September 2015 was delayed by ACCC to analyze the whole structure and regulation.
c) Finally on 19 November 2015 ACCC announced they will not opposed to the acquisition.
・ 15 February, 2016: Shell acquired BG group which boost their oil and gas reserved by 25% and capabilities of production increased by 20%.
2.1. Reasons for Acquisition
The following could be the possible reasons for acquisition of BG Group PLC by Royal Dutch Shell:
1) Diversification (Tapping into LNG Market): Shell currently has a 75% oil output and retail portfolio (Shell Financials). In the case of BG, Natural Gas (BG’s Financials) represented 70% of the overall output. Royal Dutch Shell Plc, a leading player in global deep-water and LNG, said it would result in the merger of two firms to draw on the two potential business lines of British gas. In the LNG market, the Royal Dutch Shell will gain access to the strength of BG. Royal Dutch Shell’s businesses must be: Australian Liquefied National Gas (LNG) and offshore deep water production in Brazil. Shell anticipates that in conjunction with BG, its market profile as Europe’s largest oil and gas firm will be improved and its plan to expand in these fields will be strengthened and risked.
However, some financial analysts predicted that British Gas targeted the Asian LNG market. Nevertheless, as Japan is currently restarting its nuclear power stations, as reported by the Japanese Nuclear Energy Institute and as Gasprom reports Russia is working to provide China with large-scale supplies of cheaper piped natural gas by 2018, Shell’s acquisition of BG to LNG in the short to medium term became questionable [11]. Another consideration is the lifting of sanctions against Iran, the third largest natural gas reserves. All of the above would lead to a substantial rise in natural gas supplies which would reduce LNG costs and therefore challenge and threaten investments in the natural gas industry. A big presence of British Gas on the Brazilian off-shore market will improve and grow in South American countries with the combined company anticipating an increase of 55,000 barrels per day in its oil and gas production.
2) Economies of Scale: Royal Dutch Shell thinks it will save “$3.5 billion in annual expenditures and enable the company to increase overall oil & gas output by 20 per 100.” The cost savings in shipments and logistics would also include the cost of procurement and providing in Brazil. In addition, the company expects substantial cost economies in the area of oil and gas plants for drilling, exploration and maintenance.
In addition, some analysts assume that British Gas has world-class reserves but it could not make full use of them [12]. Shell could combine this to bring business experience to the table and further leverage and improve it through the merged group.
2.1.1. Valuation by the Market Perspective
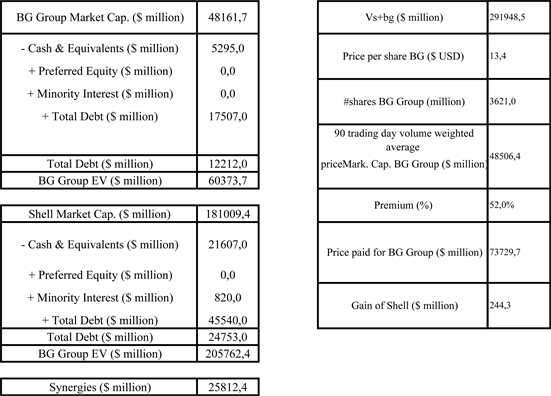
Considering the proper functioning of the market and the formula to quantify the value of a merged company [13]:
The value of the BG Group on April 7th of 2015 was $48.16 billion dollars and the value of the synergies for the merge is approximately $25.81 billion dollars value obtained. Based on the 90 trading day volume weighted average price, the BG Group had a price per share of approximately $13.395 dollars and, since, Royal Dutch Shell paid a premium of 52% that gives a total amount of $73.73 billion dollars. By considering the difference between the total values of the BG Group with the total amount paid, we conclude that, by the current market valuation, Royal Dutch Shell has paid approximately the maximum premium in order to obtain benefits from this acquisition. The gain that Royal Dutch Shell will incur is $244.3 million dollars. It’s understandable that Royal Dutch Shell does not agree with the market perspective and is counting with the oil’s price turnover, as well as with other factors that allow it to obtain greater gains from this acquisition (Appendix 1).
2.1.2. Discounting Cash Flow Analysis
The Discounted Cash Flow main valuation method to appraise the attractiveness of the investment opportunity. DCF analysis uses future free cash flow projections and discounts them to reach at a present value estimate, which is used to assess the potential for the investment [14] (Appendix 2).
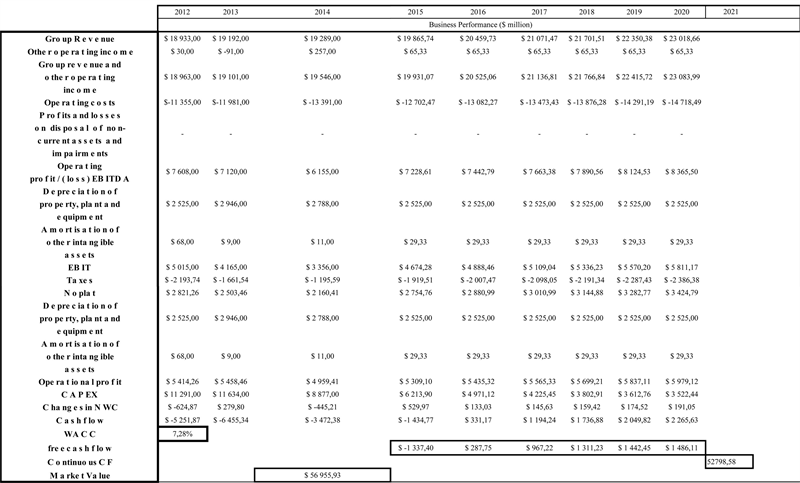
・ The study assumed a growth rate equal of 2.99% which is the growth rate obtained by considering a development of a $62.5 billion (cash flow) amount by 2020 combined company vs. sum of the present companies.
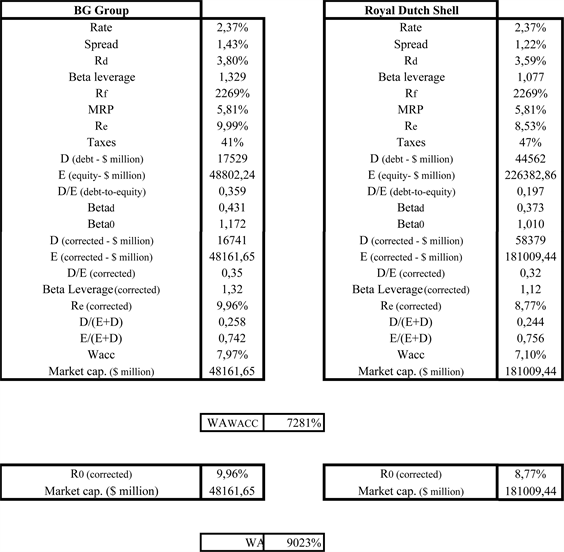
・ The discounting cash flow analysis is based on the weighted average cost of capital method (WACC), which means, the study considers the capital structure approximately constant over time.
・ It is expected a reduction of 30% for 2015’s capital expenditures, in relation to 2014, but also that this reduction continues for years to come.
・ The value obtained for the BG Group’s standalone valuation was $56.96 billion dollars, approximately a premium of 18.26% (Appendix 3).
2.2. Pertinent Strategy Rationale
Shell’s corporate strategy behind BG’s acquisition can be closely connected with what Mintzberg defines as strategy as a place among the five Ps strategy established by [15]. The theory behind strategy, as a position, is that an organisation, independently from direct or indirect competition, should take a niche position amongst rivals on the market to reach its business goals. As mentioned above, in the new millennium, petroleum majors have been transformed from mainly oil to natural gas firms. In an address to shareholders on the acquisition of BG, Shell clarified that the Shell and BG combined reserves will produce close to 50 million tons (MTPA) of natural gas per year in 2018 as a result of the agreement.
2.3. Growth Opportunity
2.3.1. Capital Asset Pricing Model (CAPM)
The financial analysts use CAPM for the purpose of assessment of the relationship that exists between systematic risk and the rate of expected returns concerning the stocks of a company [15]. The CAPM calculations for Shell Global and BG Group are presented as Table 1:
Risk free Return (Rf) = The risk-free rate is typically the government bond return rate. 10-year bonds are typically used since they are most quoted and liquid. The selection of bonds which have a maturity close to the investment the study evaluated. The Risk free Return (Rf) of Shell Global and BG Group is accordingly 0.32% and 0.35%.
Beta (b): Beta is a measure of the risk to our portfolio, which is a measure of the uncertainty of its return. It displays price changes relative to the market as a whole. If the beta is above 1.0, it means the investment is riskier than the market average. In the analysis it is showing that the investment for Shell Global is riskier than the market average value. On the other hand for BG Group investment is less risky than the market average and will decrease the overall risk of our portfolio.
Expected Rate of Return (Er): The ER is an investment benefit foreseen by
![]()
Table 1. Capital asset pricing model calculation (Yahoo Finance, 2016) [16] [17].
an investor. The returns of a portfolio are the sum of each potential return multiplied by the probability of occurrence or weight. The analysis estimated 7.86% and 6.16% for Shell Global and BG Group.
Cost of Capital (k): Cost of Capital is the rate of return the firm expects to earn from its investment in order to increase the value of the firm in the market place. The analysis shows the Cost of Capital (k) is accordingly to 8.50% and 2.49%, which indicates the level of expenditure of resources and Investments are worth the risk in relation to return.
2.3.2. Return on Stock
The return on stock shows in Table 2. Where it is clearly explained that the new price for Shell Global and BG Group has decreased from 22.44 to 21.73 to and 98.55 to 85.83.
The analysis in the study brief that the new price for Shell Global and BG Group has decreased from 22.44 to 21.73 to and 98.55 to 85.83. The possible reason might be:
1) The sale of the company’s share reaches stock market demand, it might be sold at a lower price, so that it had affected the price share price of Shell Group and BG Group.
2) Stock price can be affected by trends within the company’s industry. If investors expect an entire industry to expand rapidly, they are more likely to bid up the price of stocks of companies within the industry.
3) Changes to interest rates are commonly believed to influence the stock market mainly due to their impacts on the costs of borrowing by businesses. Investments that have an interest rival the inventory for the money of investors. Investors prefer fixed income securities protection to inventory volatility when interest rates are high. Maybe the levels of interest rates of Shell Global and BG Group are poor, stock is more desirable than investment that carries interest.
2.3.3. Dividend Growth Model
It must be noted that valuation of equity requires an in-depth analysis full of complexities, to enable the provision of an accurate forecast of the business performance. The intrinsic value of the stock options of a company is calculated by using the dividend growth model, as it does not incorporate any prevailing market conditions during the valuation [18]. The calculation of intrinsic value for
![]()
Table 2. Return on stock (Yahoo Finance, 2016) [16] [17].
Shell Global and BG Group is presented as below:
It can be observed from Table 3, that the shares of the two companies are over-valued since the intrinsic value is comparatively lower than the actual stock prices before acquisition. The dividend payout of Shell Global and BG Group has increase 6.27 and 0.42 after acquisition. The expected growth of Shell Global had forecasted at 4%.
2.3.4. Price-Earnings Growth
The evaluation of price-earnings growth is used by the financial analysts to evaluate the value of a company’s stock options while accounting for the growth percentage of the company’s growth, so as to present more complete valuation than the P/E ratio [19]:
It can be observed from Table 4, that the values obtained from price-earnings growth model differ from the actual stock prices.
![]()
Table 3. Dividend growth model (Yahoo Finance, 2016) [16] [17].
![]()
Table 4. Price-earnings growth (Yahoo Finance, 20160 [16] [17].
2.3.5. Free Cash Flow Model
This model is used by the financial analysts to examine a company’s financial performance and is calculated by deducting all capital expenses from the operating cash flow [20].
Table 5 reflects unrealistic prices, as a result of which, it may be stated that the use of free cash flow model for the purpose of examining the two companies’ financial performance is inappropriate.
2.3.6. Book Value Analysis
This analysis (Table 6) is used to determine the relationship between the share price and book-value of a company [21]. Shell Global has a lower price to book value ratio, which indicates that it is in a better position than BG Group before the initiation of acquisition.
2.4. Acquisition Impact on Royal-Dutch Multinational Shell PLC and BG Group PLC
The Acquisition deal between Shell Global and BG Group indicates corresponding business as both company doing business in same industry. In the early of April 2015 the President Charles O. Holliday and Chief Executive Officer, Ben van Beurden announced the acquiring of BG Group as to enhance the existing business portfolio and extend the business. The share price affected before and after when announcement done by both two companies are stated here (Figure 1 and Figure 2):
![]()
Table 5. Free cash flow method (Yahoo Finance, 2016) [16] [17].
![]()
Table 6. Book value analysis (Yahoo Finance, 2016) [16] [17].
![]()
Figure 1. Price impact of M&A on shell group [21].
![]()
Figure 2. Share price impact of M&A on BG group [23].
・ The mentioned Figure 1 explained the share price fluctuation of Shell Group (shown in orange line) and market index represented by S & P 500 (shown in blue line) and in addition it also shows S & P Global 1200 Energy level (red line).
・ The analysis had conducted from July 2014 to Jan 16 to understand the impact before and after of announcing acquisition.
・ The figure shows that after the announcement the next two months the market index price increase around 15% and obtained the position from April to August 2015.
・ After the announcement of the deal, the share value suddenly increases at $64.96. It closed at $33.89 in the previous day of announcement which represents a 22% increasing index.
・ For better understanding of the share price movements reflect insights of has to be compared to the share price movements of market, represented by S&P 500 indices [22].
・ In BG Group Figure 2 the share and market (S&P 500) were conducted for the same period of time.
・ The announcement of the proposed M & A impacted huge in share price as it was increased tremendously after announced. The Shares jumped at 3.2 per cent to £1062.5 on the announcement. The day ended at 1.76 per cent higher at £1047.65 per share.
・ Efficient trading strategy for the investors would have been approach to buy the shares of BG Group before the official announcement of acquiring the company by Shell and book profits one day after the announcement when share price movement stabilises.
2.5. Event Analysis on EMH of Royal-Dutch Multinational Shell PLC and BG Group PLC
In this task event study has identified for Shell Group and BG Group (Table 7). To assess the impact of M&A announcement on the share price fluctuation of the company’s event study helps a lot which observe regularly. The main model of event model based on the company’s share which comparing with a bench mark. The bench mark is represented by NYSE (New York Stock Exchange) which consider as the perimeter of share price. The model has described here:
R-Squared: R-squared determined of a company stock price movement. This is a statistical measurement where the movement could be explained by comparing the movement of NYSE. In this M&A report Shell group and BG Group can be predicted accurately by judging NYSE. The range of identifying the r-squared rate is between 0 and 1 where if the result shows more than 70% then it will show the better performance [24].
Slope: The slope will explain the significant correlation between two or more variables and also rate of changes between dependent and independent variables. A straight line method will help to identify the movement of share price.
Intercept: To predict movement of a stock of a company Intercept explains the mean value of the related variables.
Steyx: To estimated standard error in the stock exchange Steyx has used for
![]()
Table 7. Determinants of event window analysis [16] [17].
presenting suitable line to the price movements for relative share.
2.6. Analysis of Trading Strategy
Shell identified the acquisition of BG Group will create notable value for the shareholder. Long term portfolio, more assets sales and increasing capital investment should increase in the cash flow. This will also impact the capex cover and dividend of the company. The trading strategy involves with various activity. Shell Global expected for the M&A will reduce operation cost, capital expenditure over time, and change in market structures which reduce the breakeven of Shell. Shell Group stated for intention to pay dividends of at least $1.88 per share in 2016. Shell disclose the fourth-quarter profit of $1.6 - $1.9 billion (£1.1 - £1.3 billion) which is compared $3.3 billion it made a year ago before acquiring BG Group. Moreover the Shell’s production is about $0.4 - $0.5 billion which is least expected, but the downstream division refining and processing unable to fulfil the expectation of $1.4 - $1.6 billion. From 2015 to 2016 $1.88 a share has been dropped at 9.4% dividend yield which is recovering from last week’s global market sell-off. When the event happened on 8th April 2015 Shell offered around 50% premium over closing rate of BG Group’s share. Shell offered around $70 billion cash off to BG Group and suddenly the share price gets high as before it was $33.89 billion but the closing rate of that date was $64.96 billion, it shows that 22% rise compared from the past 12 years. So if an investor buys 100 shares of the company at $33.89 per share before the event and books profit when share prices reach $64.96 then there will be net profit of $31.07 per share.
3. Analysis of the Industrial and Economic Factors Surrounding the Merger
Shell’s decision to acquire BG group plc was a drastic one, to say the least. However, studying the historically unpredictable existence of the oil and gas industry exposes the fact that surviving in this industry’s competitive environment requires businesses to be fast and agile to retain a role. Therefore we must examine the circumstances surrounding this fusion that engulfed the oil and gas industry in order to analyse the Shell plc decision to acquire the BG Group during this period.
3.1. Estimation Window and Event Window of Royal-Dutch Multinational Shell PLC and BG Group PLC
The global petroleum and gas industry is now over $1340 billion worth of markets. But it’s extremely volatile, as huge as it can be. This instability is attributed to a precarious relationship with the Global Economic Perspective and international political system as well as to an increasingly competitive industrial structure. So we must weigh both of these considerations in order to assess the value of the circumstances surrounding this merger.
The model determines the cutoff time is one month from the event occurred in 7th April 2015. The end date is 1 month so it will be 7th May 2015. To analyze the opportunity of the investor in the company and also disclose profitability position [25].
There is a movement price analysis which is suggesting adopt some strategy to control the share price (Figure 3 and Figure 4). The trading strategy for the investor that they can able to get profit within a short period [26]. The share price increase from £1005 per share to £1398, in 7th April 2015 to 7th May 2015. Here are the trading strategies recommended for the investor to follow:
Step 1: The first strategy before event
The investors should purchase a number of shares to conquer market price. The company may assume the investors may buy at least 100 shares which is £1005 per share.
![]()
Figure 3. Event analysis to test EMH for SHELL GROUP before and after announcement [16] [17], (Appendix 4).
![]()
Figure 4. Event analysis to test EMH for BG GROUP before and after announcement [16] [17], (Appendix 4).
Step 2: Strategy on the date of event
The date of the event very much crucial the price of the share will be increased due to long market position of Shell Global or vice versa it can be decreased for effect of short market.
Step 3: Strategy after the event
The investor can get profit when the share price reaches£1398 p.
3.2. Synergies and Valuation after Acquisition
Using DCF approach based on similar methodology and assumptions, the valuation of merged firm turned out to be $449 Billion [27].
・ Synergies are expected to spread oddly throughout the years and are dependent upon the cash flows of the merged firm.
・ The revenue and cost synergy factors have been formulated using prospective synergies in the domain of revenue increase and cost reduction. i.e. Table 8.
・ The synergy factor is the average of revenue and cost synergy factors. i.e. Table 8.
・ In order to value the merged firm, Cash Flows of Shell and BG Group have been combined and have been increased by the synergy factor.
・ The terminal growth rate of the merged firm has been calculated as the average of the cash flow growth rate for the next five years. i.e. 1.79%.
・ WACC of the merged firm has been calculated as the average of Shell’s and BG’s WACC and turned out to be 9.38%.
1) Synergies in terms of Cash Flows: With the factors of the aforementioned synergies being obtained, cumulative factor of synergy was obtained. The cumulative factor was used to forecast cash flows of the merged firm. In addition to summing up the forecasted cash flows of Royal Dutch Shell and BG Group, the resultant cash flows were increased by the synergy factor. With the forecasting of cash flows in this way, the terminal growth rate of cash flows of 1.79% was obtained as the average of the growth rate of year end cash flows over the course of next five years [28]. Discounted Cash flow Model was used to value the incremental cash flows of the merged firm. With WACC being the average of the two firms as 9.38% the difference between the combined cash flows of both firms,
![]()
Table 8. Synergies and valuation after acquisition [16] [17].
without introducing the synergy factor and the cash flows increased by the synergy factor turned out to be $30 Billion over the course of five years, translating into additional cash flows of approximately $6 Billion per year, in today’s value [29].
2) Synergies in terms of Valuation: According to the model, the value of Royal Dutch Shell and BG Group was $323 Billion and $69 Billion respectively. The value of combined firm turned out to be $449 Billion. Hence, synergies, in terms of increased in the enterprise value turned out to be $57 Billion over the course of five years, translating into $11.4 Billion per year.
3) Optimal Offer Price: Owing to the value of BG Group PLC and expected synergies, the maximum price Shell can pay for acquisition should be $99 Billion (BG’s Value + Expected Synergies). The offer price by Shell should lie between $69 Billion and $99 Billion.
4) Alternate Investments: The study tried to analyse the possible merger of Royal Dutch Shell and different oil exploration companies with which Shell could form similar synergies.
4. Conclusion
While both the price of crude oil and LNG will drop over the next five years, based on various economic and political factors, both of these predictions are expected to be. The valuation of the combined firms would, however, surpass the sum of the two businesses by $56 trillion, which means synergies with performance. In addition, on the basis of cash flows, sales and primarily operating cost synergies are projected to be $30 trillion and thus theoretically generate value through fusion. Royal Dutch Shell undoubtedly should attempt to diversify from being highly dependent on oil to natural gas. But, as previously stated, some experts expected a very long-term disappearance of the fossil fuels industry. Even the geopolitical reports of Shell predicted that 80% of oil reserves will be exhausted by 2075. It could not be a strategy change to move dependency from one declining fossil fuel to another. A rapid increase in renewable energy sources such as solar, wind and tidal has been expected by the European Research Council. Unlike the petroleum and gas industries, the risk of renewable energy sources is low. Therefore, investment in renewables could prove to be a strategic step in the long-term horizon, according to some analysts with a lower risk and high potential returns. Thus, the quantitative element is dependent on short term. The acquisition is optimistic in Synergy’s NPV, but it becomes doubtful in thirty or fifty years. The main limitation of the study is the lesser information and article deficiency. Only a few researches had explored the financial analysis of the acquisition process of BG Group by Shell Global [30].
Appendix
Appendix 1 Calculations for the market perspective.
Appendix 2 Financial data from BG group and royal dutch shell.
Appendix 3 Standalone valuation for BG group.
Appendix 4 Estimation window & event window of shell group and BG group.
