The Status of Canopy Density and above Ground Biomass along the Northern Coastal Forest Zone of Tanzania ()
1. Introduction
Canopy density and forest biomass estimation are critical for understanding the carbon cycle and detecting health status of the forest ecosystems. The biomass estimation is highly appreciated as it provides reliable information needed for monitoring climate change mitigation efforts including carbon sequestration (Zhang et al., 2017). Climate change and variability have the potential to reduce above-ground biomass storage and, in the longer term, alter forest composition and canopy density. Droughts associated with climate change and variability affect the function of forest ecosystems and ultimately lead to poor supply of forest goods and services (Hassan et al., 2014).
Recent studies on climate change and variability show an increase of droughts and unreliable rainfall in Tanzania (Harrison et al., 2019, Mkonda & He, 2018, Sewando et al., 2016; Hassan et al., 2014). It is likely that these climate changes and variability might be responsible for the negative change of forest vegetation including forest cover and biomass along the coastal zone of Tanzania in addition to anthropogenic forest losses estimated at 470,000 ha per year (Gizachew et al., 2020). The forest destruction has also been acknowledged by Kideghesho (2015) as a major cause for loss of forest cover, biomass and biodiversity in Tanzania. Knowing that droughts have been directly linked as a new major threat to tropical forests causing higher mortality rates of forest trees (Brodribb et al., 2020, Zhang et al., 2017), it is worthwhile to have forest canopy density and forest biomass information for monitoring their changes due to climate change and variability such as droughts. However, the coastal forests of Tanzania lack reliable time series forest information making difficult to monitor the effects of climatic condition on forest variables.
This study assessed the forest canopy density and above ground biomass with relative carbon stock of forest classes under baseline conditions along with the coastal forest ecosystem in Zanzibar and Tanzania mainland. The assessment aimed at generating baseline information on canopy density and above ground biomass which can be used to make comparison with forest stocks estimated through indirect approaches such as remote sensing. Available ground measurements of canopy density and above ground biomass at different periods can be correlated with remote sensed derived data to generate trends of biomass and canopy density in the region. Further, analysis on the influence of precipitation change or drought patterns to the dynamics of canopy density and forest biomass relies on existence of data on forest stocks.
2. Methods
2.1. Site Description
The study focused on four sites which include Pugu and Kazimzumbwi Forest Reserves (PKFR) located in Kisarawe, Coast Region, Ngezi Nature Reserve (NNR) found in northern part of Pemba Island and Jozani-Chwaka Bay National Park (JCBNP) located at southern part of Unguja Island (Figure 1). These four sites lies within 0 - 200 m above sea level (masl) with exception of Pugu hill of the Kisarawe forest which lies between 200 - 500 m (masl). The study areas are characterized by the bimodal rainfall regimes with the long rain season (Masika) experienced between March and May (MAM) and the short rain season (Vuli) occurring between October and December (OND).
2.2. Methodology
2.2.1. Approach and Sampling Design
Forest inventory was conducted to collect forest biophysical data for canopy density and forest biomass estimation. Using diameter tape or caliper, Diameter at Breast Height (DBH) and count number of tree in each plot for estimation of biomass was measured. Forest canopy density from unobstructed sighting positions in each plot was measured using a spherical densiometer. To reduce the influence of human disturbances in measured plots, forests were stratified and the most forested patches with less human impacts were measured. Out of 2179 and 4887 hectares covered by Pugu and Kazimzumbwi forests respectively, the study measured total forest areas of about 1400 ha for Pugu and 1750 ha for Kazimzumbwi as closed forest patches (Figure 2). On the other hand, out of 5000 and 1975 hectares covered by JCBNP and NNR forests respectively, the study measured total forest areas of 712 ha for Jozani forest and 1917.85 ha for Ngezi forest (Figure 3).
The number of sample plots and the distance between plots were determined based on Equation (1).
![]()
Figure 1. Location of the study areas (Pugu and Kazimzumbwi forests) and Unguja (Jozani forest) and Pemba (Ngezi forest).
![]()
Figure 2. Enumerated plots (dotted within green shaded on orange background) in Pugu and Kazimzumbwi forests.
![]()
Figure 3. Enumerated plots in Ngezi and core area of the Jozani-Chwaka Bay National Park.
(1)
where N = number of sample plots, TA = Total area of the forest, Ps = Plot size and Si = Sampling Intensity. The distance between plots was determined by Equation (2):
(2)
where D = inter plots distance (m), Af = Area of the forest (ha) and N = number of plots.
A total of 110 temporary sample plots in all study sites were established. The distribution of the sample plots was 20 and 25 for Pugu and Kazimumbwi (Figure 2) and 18 and 47 for Jozani and Ngezi (Figure 3). A systematic sampling design was used to collect forest variables after the stratification of forests. The stratification was aimed at avoiding human influences on collected data. At Pugu and Kazimzumbwi forests, temporary circular plots with radius of 15 m (area = 0.07 ha) with concentric subplots of radius 10, 5 and 2 m were used. In Jozani and Ngezi temporary circular plots of 0.08 ha plot size with sub-plot radius of 1 m, 5 m, 10 m and 16 m were used.
Measurements were taken at various radius. At the radius of 1 m, all trees with dbh < 2 cm and >1 cm were recorded while at the radius of 5 m, all trees with dbh ≥ 2 cm and <10 cm were recorded. At the radius of 10 m, all trees with dbh ≥ 10 and <20 cm were recorded; and at the radius 16 m, all trees with dbh ≥ 20 cm were recorded. A botanist and local people were engaged for the identification of botanical names and local names of trees respectively.
2.2.2. Data Analysis
In each plot, canopy density was determined right in the field by finding average of all 5 readings of the spherical densiometer from plot centre; and North, East, South and West of the plot. The result was then multiplied by a constant of 4.17 (NAFORMA, 2015) to obtain the canopy cover (Equation (3))
(3)
Tree above ground biomass (AGB) was computed as a product of total tree volume and wood basic density. The average wood density of 0.58 g/cm3 for natural forest was used (Munishi, 2004; Kashaigili et al., 2013). The volumes of trees were estimated according to Zahabu, (2008) and Kashaigili et al., (2013) (Equation (4)). The obtained amount of AGB was converted to carbon using a biomass-carbon ratio of 0.49 (MacDicken, 1997; Munishi, 2004; Kashaigili et al., 2013).
(4)
where, Vi = Volume of the ith tree (m3), g = the tree basal area (m2), 0.5 = tree form factor.
The biomass and carbon per tree species and dbh classes for the whole forest were obtained by averaging carbon density from each individual species and class. Carbon stock was obtained by summing the products of plots’ carbon density and their corresponding cover area. Physical observations and photo-shooting were conducted along transects in order to record human activities around study areas.
3. Results
3.1. Canopy Density
1Class 0 embedded open canopy area (zero density).
Class 1 is covered by canopy density between 1% and 20% in which few trees are scattered in open area.
Class 2 is covered by mixture of low to high thickets and some high forest patches with canopy density ranging between 21% and 40%.
Class 3 is covered by mixture of high thickets and high forest patches with canopy density ranging between 41% and 60%.
Class 4 is covered by high forests having some gaps in between and with canopy density ranging between 61% and 80%.
Class 5 is closed canopy and highly forested areas and with canopy density ranging between 81% and 100%.
JCBNP showed higher dominance in canopy density1 compared to other sites under study areas. JCBNP forests had the average canopy densities of 63% followed by Ngezi (46%), Pugu forests (26%) and Kazimzumbwi (16%) (Table 1). The highest canopy density in JCBNP was found in class 5 (81% - 100%) which enclose about 316 ha (44% of the total area). It was followed by 4 and 0 classes each coveringan area of 119 ha (17%). Thus about 17% of the total area has no canopy (open area) in JCBNP (Figure 4).
Class 4 (61% - 80%) covering 571 ha (30% of the total area) had the highest canopy density in Ngezi forest. It was followed by classes 3 and 1 with 530 ha (28%) and 367 ha (19%) respectively (Figure 4). During the survey in Ngezi forest, it was identified that plots located close to forest edges, near settlements, roads and water bodies, had lower canopy density than interior plots. In pugu, the highest canopy density was found in class 2 (21% - 40%) which covered 45% of the total area of 630 ha. Second highest was class 1 with 420 ha (30%). About 70 ha had 0% canopy density and class 5 canopy density (81% - 100%) did not exist in the Pugu forest area. The highest canopy density in Kazimzumbwi forest was found in class 1 (1% - 20%) which covered 56% of the total area of 980 ha. Class 2 with 32% of the forest coverage had the second highest canopy density. (Figure 4). In Kazimzumbwi forest, canopy density of classes 4 and 5 did not exist while about 140 ha had zero canopy density (Figure 4).
![]()
Table 1. AGB, carbon stocks and Canopy density of the study forests.
![]()
Figure 4. Canopy Densities for North Coastal Zone forest areas (a) JCBNP, (b) Ngezi, (c) Pugu and (d) Kazimzumbwi coastal forest reserves.
The study revealed that within closed forest patches there were anthropogenic activities which contributed to existance of open canopy areas. The level of human activities in the Pugu and Kazimzumbwi forests were higher to the extent of degenerating the status of forest reserve under protection. Activities such charcoal making, quarry of stones and timber felling and sawing were witnessed for three or more days in the same location (Plate 1). These activities contributed to severe degradation of the Kazimzumbwi forest in which large amount of forest disturbances were found compared to Pugu. Few areas within Pugu and Kazimuzumbwi which were still intact and supplied ecosystem services such as edible fruits, water, wetlands and watershed areas, good habitat for wildlife and amelioration of climate (Plate 2).
3.2. Distribution of AGB and Relative Carbon Stocks
3.2.1. Species-Wise Distribution of AGB and Relative Carbon Stocks
Each forest has distinct tree species in the enumerated plots both in Zanzibar and Tanzania mainland except for Bersama abyssinica which occured in Pugu and Kazimuzumbwi (Table 2). Tree species in Ngezi and JCBNP had higher AGB and carbon stocks than species in Pugu and Kazimuzumbwi reflecting higher canopy density and less disturbance from anthropogenic activities in the former than the later. Overall, Bombax rhodognaphala in Ngezi produced the highest tAGB and carbon stock of all the sampled tree species in the four forests. Both above ground biomass and carbon stocks corresponded to cannopy density whereby forest with higher cannopy density had corresponding higher above ground biomass and carbon stocks.
![]()
Table 2. Distribution of AGB and relative carbon stocks in percentage for various species in JCBNP, Ngezi, Pugu and Kazimzumbwi coastal forest reserves.
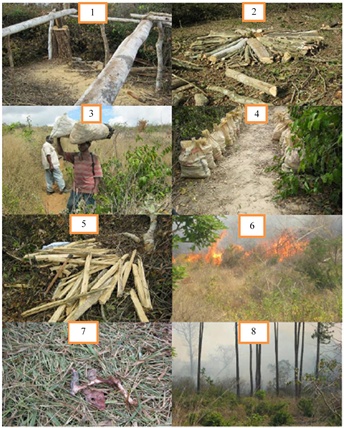
Plate 1. Represented by photos 1 - 8 are anthropogenic activities around Pugu and Kazimzumbwi Forest Reserves at Kisarawe. Photo1 is a platform for pit sawing of logs in Pugu forest; photo 2 is preparation ground for charcoal making at Kazimzumbwi forest; photo 3 The surveyor team member witnessing transportation of charcoal from Kazimzumbwi forest; photo 4 quarry stones mining is going on at Pugu forest; photo 5 fuelwood from Pugu forest ready for transportation; photo 6 show forest fire incidence burning forest vegetation at Kazimzumbwi forest; photo 7 remnant of animal kill left behind by hunters at Pugu forest; and photo 8 forest fires intruding forest patches having big trees around Pugu forest.
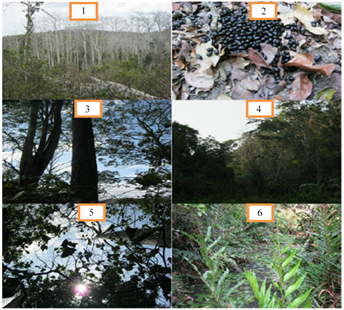
Plate 2. Represented by photos 1 - 6 PKFR still has many forest goods and services justifying for the conservation programme. Photo 1 scene of healthy forest patches within Pugu forest; photo 2 edible wild fruits within Kazimzumbwi forest; photo 3 remained forest patch having straight trunk trees around Pugu forest; photo 4 beauty scene of closed patch of woods around Pugu forest; photo 5 closed canopy scene around Pugu forest; and photo 6 water catchment around Kazimzumbwi forest.
3.2.2. Distribution of AGB and Relative Carbon Stocks Per DBH Classes
The above ground biomass and carbon stock in JCBNP was normally distributed in the forest with highest biomass accumulations in six classes of DBH at middle, from 35 to 59.9 cm. These six DBH classes in the distribution contained about 60% of the total biomass in JCBNP forest. No biomass was found between 85 and 99.9 cm DBH classes, but the study found existence of biomass above 100 cm DBH. In Ngezi forest, biomass was distributed in all DBH classes. There were three peaks with the highest values being found between 85 and above 100 cm which accumulated 38.59% of the total biomass. Other peaks were found at the 30 - 34.9 cm DBH class which accumulated 32.04% of the biomass and the 70 - 74.9 cm DBH class accumulating 29.37% of the total biomass in the forest (Figure 5).
![]()
Figure 5. Distribution of AGB and carbon in individual DBH Classes (a) JCBNP, (b) Ngezi, (c) Pugu and (d) Kazimzumbwi coastal forest reserves.
The topmost above ground biomass and carbon stock in Pugu were found at 25 - 29.9 cm DBH class which attained 79.45 tAGB equivalent to 38.9 tC/ha (Figure 5). The DBH classes of 35 - 39.9 cm, 30 - 34.9 cm and 15 - 19.9 cm accumulated 18.5%, 15.5% and 12.2% of the total biomass respectively. There were no tree species that qualified to be in the DBH classes from 40 - 44.9 cm to ≥60 cm in this forest (Figure 5). Similar pattern was observed in Kazimzumbwi forest, in which there were no tree species for DBH classes of 45 - 49.9 cm, 50 - 54.9 cm and ≥60 cm. However, during the survey we found stumps with the DBH classes between 40 and 60 cm indicating anthropogenic activities as the driver for the disappearance of higher DBH classes in Pugu and Kazimzumbwi forests.
Higher biomass values in Kazimzumbwi were also found at lower DBH classes, peaking at the low DBH class of 25 - 29.9 cm with accumulated 24 tAGB equivalent to 11.7 tC/ha of the total biomass. DBH classes of 15 - 19.9 cm, 30 - 34.9 cm and 20 - 24.9 cm accumulated 15.0%, 13.3% and 13.0% of the total biomass respectively. The DBH class of 45 - 49.9 cm contained about the lowest biomass of 1.9 tAGB equivalent to 0.9 tC/ha of the total biomass (Figure 5).
4. Discussions
JCBNP and Ngezi forest are formed with higher canopy density than Pugu and Kazimzumbwi forests. JCBNP forest had the highest density (63%), followed by Ngezi (46%), Pugu (26%) and Kazimzumbwi (16%). About 44% of the JCBNP forest, equivalent to 316 ha, was covered by class 5, i.e. 81% - 100%. About 571 ha, which is 30% of the total area of Ngezi forest, was covered by class 4 (61% - 80%). In Ngezi forests, most plots close to roads, settlements and water bodies are characterized by more open canopy cover than interior plots. Thus JCBNP forest cover consist of more uniform trees and specific spacing, having higher crown cover than in Ngezi, Pugu and Kazimzumbwi forests in which trees are found mostly in less disturbed forest patches. During the survey, the researcher was informed by station incharge of JCBNP that the forest was planted to fill gaps mostly with Callophyllum inophylum in the 1980s after heavy clear-felling between 1942 and 1950.
Pugu and Kazimzumbwi are charicterized by more open canopy densities (CD) as indicated by higher percentages of lower and medium canopy classes. However, Pugu had higher CCD than Kazimzumbwi. The coverage of lower canopy density for the total closed forest patches at Pugu FR accounted to 35% or 490 ha of the forest area. The Pugu FR was, characterized by medium canopy density classes 2 and 3 ((21% - 60% of CD) which accounted to 60% of the forest area (840 ha). Kazimzumbwi FR was dominated by lower canopy density which covered 64% of the total forest area (1750 ha). The canopy density consisted of lower to medium forest thickets interrupted with a few closed canopy trees that are distributed at distance in forest land due to continuous forest destruction which include forest harvesting, hunting, stones quaries, charcoaling and other human activities.
The study found that Pugu and Kazimzumbwi forests of Kisarawe are more threatened by the presence of anthropogenic activities than in JCBNP and Ngezi of Zanzibar Islands. The activities were the main drivers of deforestation and open canopy density scenes in both forests and as result, important plant and animal species in the forests have disappeared and suggested that Degraded forest areas with lower canopy densities change the surroundings air humidity, temperature and soil moisture, resulting in less natural floral and faunal organisms seeking refuge in the forest area (Jennings et al., 1999). In the absence of additional anthropogenic activities, these degraded areas may follow an alternative succession pathway, being dominated by lianas or palms and remain in a low-canopy state for many years (Schnitzer et al., 2000).
Regarding biomass accrual, Ngezi forest was found to have higher accumulation of biomass above ground (138 t/ha) than forests in JCBNP (124 tAGB/ha), Pugu (18.14 tAGB/ha) and Kazimzumbwi (4.36 tAGB/ha). The differences in biomass distributions between study sites are well demonstrated. The results for biomass accumulation in Ngezi and JCBNP are in good agreement with the woody biomass survey study conducted in Zanzibar in 2013. The woody biomass suvey report show that JCBNP and Ngezi contain more than 100 t/ha biomass an indication of higher mean carbon stocks possession than other coastal forests ecosystems such as Arabuko-Sokoke in Kenya with 58 - 94 tC/ha (Julia, 2008; Kashaigili et al., 2013) and Kitulangalo forest reserve with 16.5 tC/ha (Malimbwi et al., 1994). The higher carbon stocks in Zanzibar forests were a reflection of higher conservation protocols under national parks (JCBNP) and nature reserves (Ngezi).
The obtained mean AGB and carbon stock for Pugu (18.14 AGB t/ha and 9 Ct/ha) and Kazimzumbwi (4.36 AGB t/ha and 2.14 Ct/ha) forests were close to values reported in Kashaigili et al. (2013). These results in Pugu and Kazimzumbwi forests show lower mean carbon stocks than the 58 - 94 tC/ha for Arabuko-Sokoke Coastal Forest of Kenya (Julia, 2008; Kashaigili et al., 2013), 20.5 - 43.6 tC/ha for Zanzibar coastal forests (RGZ, 2013), and 16.5 tC/ha for Kitulangalo forest reserve (Malimbwi et al., 1994). The lower carbon stocks in PKFR is linked to significant anthropogenic activities in the forests while low carbon densities were attributed to decline in area under closed forest in the two forest reserves (Kashaigili et al., 2013).
The study found that about 60% and 47% of total carbon stocks in Kazimzumbwi and Pugu FR are distributed among five species (Figure 5). This implies that the rest of the species had little contribution to the biomass in the forests due to degradation (Kashaigili et al., 2013). The low percentage of carbon stock (0.1%) found in Meliciaexcelsa, Julbernadia globiflora, Tamarindus indica and Grewia bicolor in Kazimzumbwi forest reserve suggested that people opted and targeted to cut existing specific tree species for various purposes. Selective cutting of specific or matured trees left out few stunted and genetically poor individuals and contributed to population decline (Lyaruu et al., 2000). The top five species in Ngezi and JCBNP accumulated 52% and 82% respectively of the total biomass. The accumulated biomass was dominated by few planted species of Callophyllum inophylum.
5. Conclusion
Ngezi and JCBNP forests were found to have higher canopy density and biomass accumulation. However, during the inventories, the signs of some disturbances due to anthropogenic activities were observed. The Pugu and Kazimzumbwi forests are extremely degraded by anthropogenic related activities. The degradation contributed to the disappearance of important tree species that determine the structural composition and biomass of PKFR. As a result, lower biomass and carbon stocks were recorded for these forests. Persitent anthropogenic activities will potentially further deter the forests’ ability to provide ecosystem services and goods to the surrounding communities and the forest will disappear faster. Weak enforcement of forest protection measures due to inadequate human, financial and material resources plays the major contribution to the curent existing levels of forest degradation. If rehabilitated and effectively protected, both Pugu and Kazimzumbwi forests represent a viable potential to increase canopy density, biomass and carbon stocks and other ecosystem services. Therefore immediate conservation efforts such as preparation and implementation of forest protection enforcement plan and restoration of vegetation, are needed to secure these important remaining coastal forests patches in the zone.
Acknowledgements
This research was supported by a NORAD funded research programme: Climate Change Impacts, Adaptation and Mitigation (CCIAM) of the Sokoine University of Agriculture through Analysis of the Impacts of Urban Land Use and Climate Change on Coastal Forest Eco-system and Management research project.