A Product Analysis and Evaluation Method Based on the “False-Green-Design” ()

With the society’s understanding of the environment and resources more profoundly, in the development of modern design concepts, green design and sustainable design exhibitions have taken very big rate. Green concept can offer a useful guide as how to realize the green design, and comprehensively consider the environmental impact and resource utilization efficiency in the process of product manufacturing, use and recycle under the premise of ensuring the function and quality of the product [1].
1. Research Background and Significance
At present, directed at design and development of green design, “3R principle” is gradually becoming the mainstream thinking of it, which includes the principle of Reduce; the principle of Recycle; the principle of Reuse. However, due to the cognitive biases of the 3R principle by designers, the existing energy-saving and emission-reducing products have fallen into the category of “false-green-design”. At the same time, most of the “green products” in the existing market come from the firm’s promotional and packaging, their purpose, in essence, is to heed the country’s call while pandering to consumers, which makes their products have little difference essentially from the original products. But only because of its packaging effect, it has increased the price of the product and even received the “Special Industrial Design-Funded” by the government.
Secondly, consumers’ ambiguous judgment of discriminating the “green products” is also one of the reasons why green design cannot develop indeed. Consumers with green consumption concepts will also buy “false-green” products a large percentage of the shopping because it’s ambiguous when a company tries to position its green product. Through the case study, we found that consumers will firstly consider whether the product will directly harm to themselves during using; secondly, whether the product’s functionality is user-friendly for easy operation as well as the aesthetic issues; and finally turns to the social value of the product: Its environmental and sustainable attributes. Therefore, it is very necessary to develop a green design evaluation system.
2. Research Methods for Green Design
2.1. Research Objective
The purpose of product green design is to maximize the using of parts’ material resources and energy, and to minimize environmental pollution. In the early stage of product design, companies need to have a comprehensivly consideration and to analyze the lifecycle of the product it produces, and fully consider the possibility of recycling various parts an well as materials of the product, and how easy the recycling is, the value to recycling, the recycling processing method, and a series of problems related to recyclability, such as the processability of parts structure [2]. However, in the fierce market competition, from a personal perspective, there is almost no motivation for the future or the benefit of the whole society to restrict one’s natural resource extraction and waste discharge with the goal of sustainable development. At the same time, in reality. The competitiveness of recycled products in the existing market in terms of brand, marketing, and price cannot be comparable to that of original materials, so the value of recycled products is difficult to reflect and accepted by consumers. In addition, some recycled products are not as mature as original products in terms of material technology and technology, and individual quality problems will cause general acceptance of recycled products. In different economic development regions, with the changes in values and consumption concepts, consumers’ acceptance of recycled products is different, which will affect the company’s marketing strategies and methods in the region, thereby changing the way of product’s green design
Above this background, this research topic analyzes the key factors affecting the “green value” of the product at the source, discussing the theoretical model of the product’s “green-value” with the analytic hierarchy process (AHP), and analyzes What kind of connection are there between the green design of the product and the green consumption behavior of consumers objectivly. Studying the different appeals among the government, enterprises and consumers for green design. From the perspective of product itself, exploring green design methods design on that basis; from the perspective of the enterprise, exploring how to allocate its own market resources under the premise of market rules scientifically; from the perspective of the government, exploring how to guide or restrict relevant corporate behaviors under the condition of respecting market rules.
2.2. Current Research Methods
The evaluation of one stuff often involves multiple factors or goals. When the evaluation indicators of one stuff are higher than another’s, the pros and cons of it will be obvious; but when the distinction between advantages and disadvantages of evaluation indicators is not obvious, it’s rather to make a comprehensive evaluation of the stuff, than just evaluate the stuff from a single way. The evaluation of green products must adopt a comprehensive evaluation method. For now, there are many primary methods for various evaluations, for instance: weighted average method, fuzzy comprehensive evaluation method, analytic hierarchy process, value engineering method, etc., and these can be considered in the evaluation of green products [3].
1) Weighted average method
Since many factors and indicators have different positions and roles in the evaluation, it is possible to assign a “weight” to each factor to reflect this difference, which can be expressed as:
(1)
In this formula: E―Weighted total score;
―Score of evaluation factor i;
―Weight of evaluation factor i.
In general,
.
2) Value engineering method
Created by Lawrence Miles in 1947, the value engineering method later spread rapidly in various industrial sectors in the U.S. In the 1960s, it was also widely adopted in Western Europe, Japan, and Eastern Europe, with remarkable results, and was recognized as a fairly mature management technique.
The essence of the value engineering method lies in the correct treatment of the interrelationship of product functions and costs in order to maximize the value of the product, and the basic principle of the method can be used in the following formula [4]:
(2)
In this formula: V―Value;
F―Function;
C―Cost.
It can be seen that value is directly proportional to function and inversely proportional to cost. In other words, if the product has good function and low cost, the value is high. Therefore, to improve the value of a product shall start from improving function and reducing cost. The basic principle of the value engineering method is how to correctly handle the relationship between product function and cost in order to maximize the product value.
3) Gray correlation analysis
The basic idea of gray correlation analysis is to determine whether the correlation is close by the similarity of the geometry of the sequence curves. If the closer the curves are, the greater the correlation between the corresponding sequences. The method is relatively small in computational volume and avoids the discrepancy between qualitative and quantitative analysis results. However, the method cannot identify pollution factors that have a significant impact on subjective perception and thus cannot adjust the evaluation criteria series.
4) Analytic hierarchy process
In 1970, Analytic Hierarchy Process (AHP) was formally proposed by the American management professor Thomas L. Saaty of the University of Pittsburgh. As a hierarchical weighting decision analysis method, it decomposes the elements that are always relevant to decision making into levels such as solutions, objectives, and guidelines, and then analyzes quantitative and qualitative respectively on the basis of each level.
3. Evaluation Technology Route of Green Product
1) Design an effective research questionnaire
The research questionnaire should cover the selection of materials, processing technology, packaging and transportation, waste recycling, etc. In addition, in order to ensure the design and manufacture of “green products,” the research users should be divided into different groups, as shown in Table 1.
2) Set up an interpretive structural modelling of the product evaluation system Based on the above research results, it is possible to analyze the questionnaires, draw a directional diagram according to the questionnaires to establish the adjacency matrix and accessibility matrix, and finally obtain the green design system element correlation diagram of the product by dividing the relationships at all levels.
a) Based on the questionnaire, the relevant influencing factors can be numbered and a directed graph can be mapped just as shown in Figure 1 [5]:
b) Based on the questionnaire, the relevant influencing factors can be numbered and a directed graph can be mapped just as follows: Based on the directed graph, it is possible to create an adjacency matrix and calculate the accessibility matrix [6].
The matrix A is used to represent the direct connection state between the units in the diagram. Suppose the system S has a total of n units
, then:
Find the accessibility matrix through Boolean Product: The accessibility matrix identifies whether the units of S have an accessible path to each other. If D is a relationship graph of a system
consisting of n units, then the n × n matrix M with element
![]()
Figure 1. The directed graph of influencing factors.
is called the accessibility matrix for D.
Calculation of the accessibility matrix:
It is possible to calculate the
to the power of 2i
If
,
c) The level distribution of each element.
Basis matrix M, find out the elements of the Set
, the first collection of
, and a collection of
,
, I. Relationship
.
・ relational division
;
・ regional division
;
・ level classification
;
・ Strong connection unit division
;
・ Strongly connected subset division
;
d) Generating hierarchical structure diagram.
3) Determine the weights of related factors through the analytic hierarchy process (AHP).
a) Stratify the factors and construct a judgment matrix.
You can directly use the structural hierarchy diagram obtained in the above steps for level identification, which are: Target layer (A)―criteria layer (C1, C2, ∙∙∙, Cn)―program layer (P1, P2, ∙∙∙, Pn); construct a judgment matrix for each level, the scale definition table is as shown in Table 2 [7].
b) To determine the weight factors coefficients and validate the consistency test, each layer should be sorted in single-layer.
・ Find the eigenvector (W) and maximum eigenvalue (λmax) of each index―Take Asymptotic Normalization Coefficient and Squareroot Method as examples:
![]()
Table 2. Scale definition table of judgment matrix.
Asymptotic Normalization Coefficient:
The each column of the judgment matrix should be normalized:
,
(3)
The normalized column judgment matrix should be added by row:
(4)
The eigenvectors will be get through normalizing the vectors
:
(5)
The maximum eigenvalue of the judgment matrix will be calculated:
(6)
Squareroot Method:
The elements of the judgment matrix B by rows should be multiplied :
(7)
The obtained products’s nth power should be calculated respectively:
(8)
The eigenvectors W will be gotten through normalizing the squareroot vectors:
(9)
The maximum eigenvalue will be calculated:
(10)
・ Check the consistency of judgment matrix
the mean random consistency index R.I. should be compared with C.I., the table of R.I. is as shown in Table 3:
(11)
Only when random proportion of consistency in line with:
(12)
the judgment matrix has satisfactory consistency, otherwise it needs to adjust the judgment matrix.
c) The weight indicators of each layer are defined and sorted in terms of their indexes.
In the process of using the analytic hierarchy process to analyze the case, it is necessary to compare the elements of each layer from various angles. Among them, the opinion survey of experts can be used for scoring these elements, or the fuzzy comprehensive evaluation method can be used for scoring the values. (AHP’s program is in the attachment)
4) An example analysis of kitchen household products
Take the kitchen-household small products of the cleaning brand in Sichuan Province as an example, if you want to measure the “green indicators” of several similar products, you can briefly evaluate the weight from the following directions:
・ Disposal and recycling;
・ Material selection;
・ Packing and transportation.
Based on the above three aspects, the “Kitchen-Household Small Product Rating Survey Questionnaire” is set up, and the average value of each scoring index of the 20 valid questionnaires is taken to construct the judgment matrix as shown in Table 4.
According to the calculation by the program, the following results can be obtained as shown in Figure 2 (the program is included as an attachment at the end of the paper):
Therefore we can say that such products meet the green design standards.
Furthermore, to make more detailed green index judgments for products, you can make a deeper level division according to Figure 3 [8].
![]()
Table 3. Table of Mean random Consistency index (R.I.).
![]()
Table 4. Table of Mean random Consistency index (R.I.).
![]()
Figure 3. Green design plan evaluation factors.
4. Conclusions and Prospects
In this article, we propose a comprehensive green value evaluation system based on the various stages in the product life cycle process, so as to be able to comprehensively consider the producing-processing-transporting-using-recycling the product in the design and development stage. The cost-profitability of the produce is compared to determine the design and development method on the basis of the highest green value. Compared with the existing evaluation methods, the comprehensive application of multiple evaluation methods can more comprehensively consider the product’s entire life cycle (such as the user positioning of green product, material preparation stage, recycling stage, etc.) to design and evaluate the engineering scheme of the product.
Although this article has constructed a technical plan for the evaluation indicators of green design, due to the large amount of data that needs to be investigated and statistics during the entire life cycle of the product, and the influencing factors such as region and energy are cumbersome to evaluate, so it’s not easy to apply the data in the comprehensive process analysis. Some of the processes still need to involve statistical analysis models in other industries (for instance, the calculation relationship model between the transportation mode and carbon emissions in the material or product transportation during transport), which system is relatively complex and specialization. However, as far as the current research results of this study, our evaluation model still cannot solve this problem. Therefore, we strive to find a more concise application model to simplify the quantification process of green value in subsequent research. So, in the next stage of work, we mainly involved three aspects of work:
1) Try to collect the data at each stage of the product life cycle process, which includes the resource consumption and waste discharge value of each stage of the product, forming a systematic product life cycle database;
2) Simplify the calculation models at each stage to form a more systematic and simple evaluation model;
3) Try to increase the degree of objectivity of the evaluation model; use modeling methods to further quantify empirical evaluation indicators to form standardized comparison results.
Acknowledgements
Thanks to Guangzhu Chen for his suggestions on the theoretical guidance and Shuai Li for his helps on the processing of distribute survey questionnaires and statistics in this article.
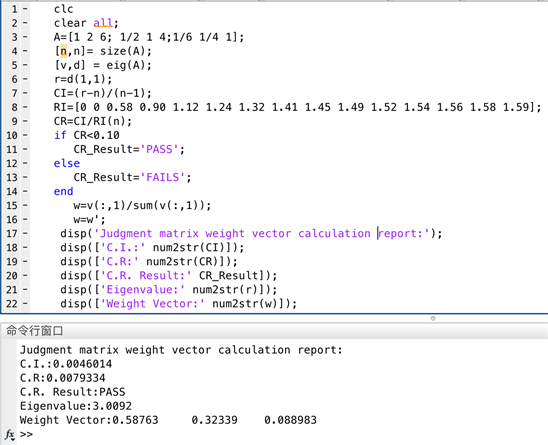
Attachment
clc
clear all;
A=[1 2 6; 1/2 1 4;1/6 1/4 1];
[n,n]= size(A);
[v,d] = eig(A);
r=d(1,1);
CI=(r-n)/(n-1);
RI=[0 0 0.58 0.90 1.12 1.24 1.32 1.41 1.45 1.49 1.52 1.54 1.56 1.58 1.59];
CR=CI/RI(n);
if CR<0.10
CR_Result='PASS';
else
CR_Result='FAILS';
end
w=v(:,1)/sum(v(:,1));
w=w';
disp('Judgment matrix weight vector calculation report:');
disp(['C.I.:' num2str(CI)]);
disp(['C.R:' num2str(CR)]);
disp(['C.R. Result:' CR_Result]);
disp(['Eigenvalue:' num2str(r)]);
disp(['Weight Vector:' num2str(w)]);