Egyptian Macroeconomic Status with Reference to the Shadow Economy during the Period 1991-2018 ()

1. Introduction
To provide better review for the Egyptian economy, this paper briefly examines the Egyptian economy since 1991 till 2018, whereby the country passed through several phases, embarked on various stages of development, whereas the public and private sectors had significant roles. In addition, this study sheds light on the macroeconomic policies that Egypt adopted: Fiscal Policy, Exchange Rate Policy, Monetary Policy, Debt Policy and Regional Integration & Trade Policy.
This study focuses explicitly on the Egyptian economy and assesses the determinants of the shadow economy and its impact on major macroeconomic indicators in Egypt during the past three decades, whereby the shadow economy considers the legitimate economic activities that, if registered, should contribute to the country’s GDP. The research concludes that, the average size of the shadow economy to GDP in Egypt is estimated at 28.29% during the period 1991 to 2017 using the MIMIC approach.
2. The Period (1991-2007)―Economic Reform
During the period 1991-2007, Egypt had applied a structural economic reform program supported by the World Bank and IMF. In this regard, more incentives were granted to the private sector in various economic activities, whereby new business legislations have been introduced & trade and investments have been partially liberalized. Moreover, Egypt had launched the privatization program in several industries with close attention towards heavy industries. In 2004/2005 a new tax law was applied targeting improving the tax system by eliminating its complexity, offering a reduced unified tax burden for all entities without exception or deviation, hence encouraging tax compliance and limiting the tax evasion.
As a result, tax fillings had increased by 50%, as many people preferred to avoid tax evasion and to participate in the formal economy. Accordingly, the reform program had strengthened the annual GDP growth rate with an average of 5.7% during the period 2004-2009 (IMF, 2010), also the size of the shadow economy witnessed a tangible reduction.
Chart 1 demonstrates that during the period 1991-2007 Egypt’s GDP Growth Rate had reached its peak in 2007 recording 7.09%, while the lowest growth rate registered 1.13% in 1991, thus yielding an average GDP growth rate of 4.54% during the aforementioned period. In addition, the inflation rate reached its peak in 1992 recording 18.35%, while the lowest rate registered 0.92% in 1999, thus yielding an average rate of 8.04%. Moreover, the unemployment rate reached its peak in 2005 recording 11.20%, while the lowest rate registered 7.95% in 1999, thus yielding an average rate of 9.68%. Furthermore, current account balance (% of GDP) had reached its peak in 1991 recording 9.01% OF GDP, while the lowest growth rate registered −1.80% of GDP in 1999, thus yielding an average of 1.75% of GDP.
Table 1 & Chart 2 illustrate the size of the shadow economy in Egypt during the period 1991 to 2007, revealing an average size of the shadow economy to GDP recording 39.68% using the MIMIC model.
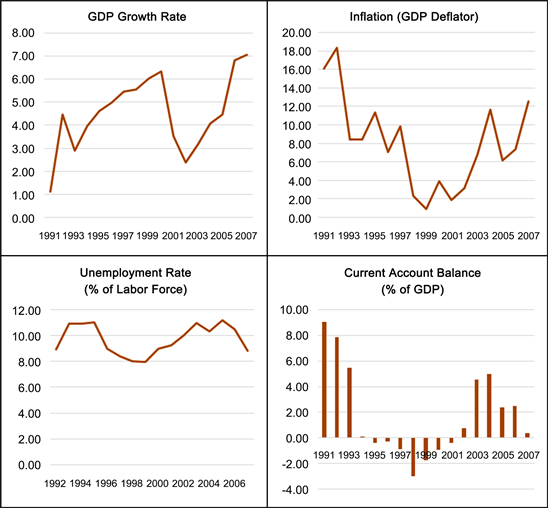
Chart 1. Source: World Bank Data (2020), charts are demonstrated by the authors.
![]()
Table 1. The size of the shadow economy in Egypt during the period 1991 to 2007.
Source: Hassan and Schneider, 2016. Chart 2 is demonstrated by the authors.
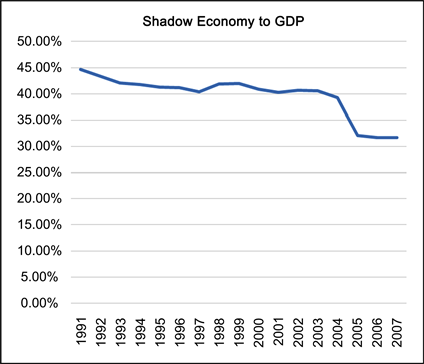
Chart 2. Source: Hassan and Schneider, 2016. Chart is demonstrated by the authors.
3. The Period (2008-2013)―The Global Financial Crisis and January 25th Revolution
The rise of the global financial crisis resulted in Egypt’s application for a set of fiscal-monetary policy decisions in order to offset its negative repercussions on the Egyptian economy. The impact of price shock regarding food, several primary commodities and energy was a threat to the middle- and lower-income people, as their spending on food items contributed 45% of their income and reached 60% for the lowest quintile (Egyptian Ministry of Finance, 2009). This required a governmental quick action to mitigate such negative impact and to preserve social and economic stability. Consequently, the government launched its “first” fiscal stimulus package of LE 15.5 billion (1.5% of GDP) in 2008/2009, mainly to finance the accelerated investments in public utilities (Egyptian Ministry of Finance, 2009). Moreover, energy subsidies were reduced coupled with imposing higher sales tax on cigarettes, as well as eliminating selected income tax exemptions [1].
Such measurements took place in order to finance the additional burden associated with adjusting the employees base-wage scheme within the governmental sector including, raising the minimum wages and pensions. Meanwhile, the global financial crisis resulted in a global inflationary wave during 2007/2008, as a result and in order to mitigate such negative impacts, Central Bank of Egypt applied a contractionary monetary policy [2]. In addition, CBE encouraged Small and Medium Enterprises (SMEs) via exempting banks’ deposits, equivalent to the size of the SME’s loan portfolio from the 14% legal reserve requirements. Such action was mainly due to the SME’s nature of being labor intensive, hence supporting the economic activity and employment (Egyptian Ministry of Finance, 2009).
After 2011 revolution, Egypt had encountered political instability, security disorder and severe economic turmoil, a matter that negatively affected many economic indicators as: escalated unemployment rate, hike in inflation rates, deterioration in foreign investments and tangible decline in foreign reserves that fell from USD 36 billion in December 2010 to register only USD 13.6 billion at the end of January 2013 being a minimum critical balance covering less than 3 months of imports (Central Bank of Egypt, 2013).
Chart 3 demonstrates that during the period 2008-2013 Egypt’s GDP Growth Rate had reached its peak in 2008 recording 7.16%, while the lowest growth rate registered 1.76% in 2011, thus yielding an average GDP growth rate of 3.86% during the aforementioned period. In addition, the inflation rate reached its peak in 2012 recording 19.48%, while the lowest rate registered 8.71% in 2013, thus yielding an average rate of 12.23%. Moreover, the unemployment rate reached its peak in 2013 recording 13.15%, while the lowest rate registered 8.52% in 2008, thus yielding an average rate of 12.23%. Furthermore, current account balance (% of GDP) had remarkably deteriorated to register an average of −1.79% of GDP.
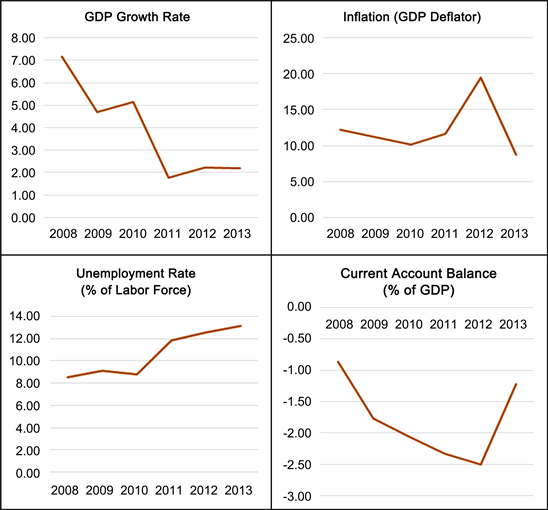
Chart 3. Source: World Bank Data (2020), charts are demonstrated by the authors.
Table 2 & Chart 4 illustrates the size of the shadow economy during the period 2008 to 2013, revealing an average size of the shadow economy to GDP recording 20.48% using the MIMIC model.
![]()
Table 2. The size of the shadow economy in Egypt during the period 2008 to 2013.
Source: Author’s calculations.
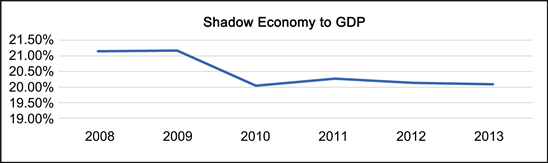
Chart 4. Source: Author’s calculations.
4. The Period (2014-2018)―Adapting Transformational Economic Reform Program
In 2014, Egypt started implementing a major bold and transformational reform program backed by the IMF, for the purpose of boosting the economy, improving the state’s business environment and achieving a balanced and inclusive economic growth. The first phase of the program paid great attention towards rebalancing the macroeconomic indicators. Accordingly, tough procedures and hard economic decisions have been adopted including; liberalization of the Egyptian pound in November 2016, reducing energy subsidies, applying the value added tax (VAT), reducing the wage bill, enhancing the business climate and financing small and medium-size enterprises [3].
The second phase of the reform program focused on governance and creating an efficient investment climate through introducing several rules and decrees to eliminate investment barriers and attracting local and foreign investments, such rules included the Civil Service Reform Law, that was passed in late 2016, in addition to attracting local and foreign investments, via the Industrial Licensing Law, the Investment Law and the Company Law.
Egypt’s economic reform program gets its credibility by being endorsed by budget support and financial aids from international entities including; USD 6.69 billion from the World Bank to finance 16 projects in various fields in Egypt (World Bank, 2017), USD 12 billion from The International Monetary Fund “IMF” to proceed with the economic reform program (IMF Country Report No. 18/213, July 2018) and USD 1.5 billion from the African Development Bank covering the fiscal years 2015-2016 to 2017-2018 for energy support program and the economic governance (African Development Bank, 2018). Such international support conveyed a message of trust.
The Egyptian government tried to offset the negative impact of the economic reform program by presenting food smart cards and replacing the generalized energy and food subsidies by more poverty targeted programs. Nevertheless, social conditions were still difficult as a result of high level of inflation, a decrease in real income and the escalated rate of unemployment. In this concern, the private sector was viewed important in providing job opportunities, accordingly the government introduced several key legislative reforms including: introducing the new investment law, the new industrial licensing law, bankruptcy law and capital market law.
On November 3rd, 2016, the Central Bank of Egypt “CBE” had freely floated the Egyptian Pound in order to mitigate the shortage in the US dollar, ban the parallel market, enhance Egypt’s external accounts and stabilize the economy. As a result, the Egyptian Pound was devalued by almost 48% recording EGP 13 per US dollar up from EGP 8.78 previously (CBE foreign exchange rates as of November 3rd, 2016, 1 PM). The currency floatation enhanced the competitiveness of Egypt’s exports and supported the private sector activity that was negatively affected by the lack of foreign exchange availability.
In addition, Real GDP growth rate was remarkably increased to register 4.37%, 4.34% and 4.18% in 2015, 2016 and 2017 respectively compared to 2.22%, 2.18% and 2.91% in 2012, 2013 and 2014 respectively (World Bank, 2014). Both the construction and energy sectors were the main drivers of growth on the supply side, whereby GDP growth is mainly driven by private consumption, public investments, partial recovery of tourism, exports of commodities and services, as well as the tangible dynamic growth witnessed in, Information Communication Technology (ICT), telecom, gas and construction sectors.
The main limitation to growth was high inflation as it negatively affected the low-income people as well as the returns on investment, especially that many inputs were imported. The real interest rate was negative, CPI inflation registered 29.5% in 2017 up from 13.8% in 2016 (World Bank, 2016). Hence, the monetary policy remained tight in order to support the local currency and reduce inflation. In this regard, after a consecutive increase in interest rates by 700 basis points (bp) to hedge against inflation, in February 2018, the Central Bank of Egypt (CBE) decreased the key rates by 100 bp, which was followed in March 2018 by a further reduction of 100 bp in order to support the economic growth and lending to the private sector. On May 11, 2018, Standard & Poor’s had raised Egypt’s credit rating to stand at B up from B- with stable outlook, indicating that the transformational economic reform program restored confidence in the economy.
Chart 5 demonstrates that during the period 2014-2018 Egypt’s GDP Growth Rate had reached its peak in 2018 recording 5.31%, while the lowest growth rate registered 2.92% in 2014, thus yielding an average GDP growth rate of 4.23% during the aforementioned period. In addition, the inflation rate reached its peak in 2018 recording 21.43%, while the lowest rate registered 6.25% in 2016, thus yielding an average rate of 14.36%. Moreover, the unemployment rate reached its peak in 2014 recording 13.10%, while the lowest rate registered 11.59% in 2018, thus yielding an average rate of 12.38%. Furthermore, current account balance (% of GDP) continued its deterioration to register an average of −3.95% of GDP.
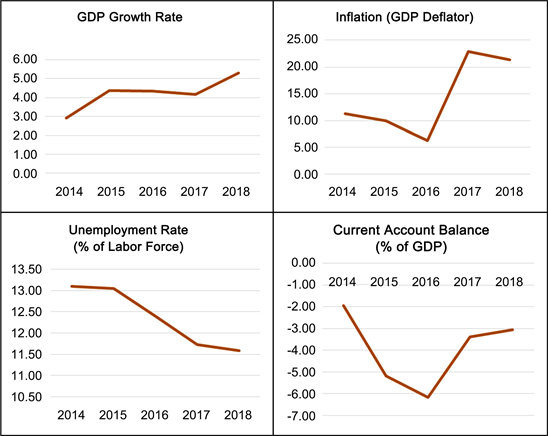
Chart 5. Source: World Bank Data (2020), charts are demonstrated by the authors.
Table 3 & Chart 6 illustrates the size of the shadow economy during the period 2014 to 2017, revealing an average size of the shadow economy to GDP recording 19.71% using the MIMIC model.
![]()
Table 3. The size of the shadow economy in Egypt during the period 2014 to 2017.
Source: Author’s calculations.
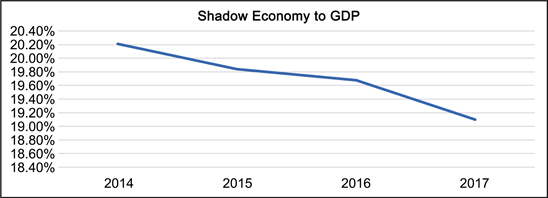
Chart 6. Source: Author’s calculations.
5. Macro-Economic Policies
This sub-section addresses the macroeconomic policies that Egypt recently adopted including: Fiscal Policy, Exchange Rate Policy, Monetary Policy, Debt Policy and Regional Integration & Trade Policy.
5.1. Fiscal Policy
Egypt’s economic reform program supported by IMF aims to improve the fiscal policy in terms of reducing the public deficit to 10% of GDP through cutting expenditures and increasing revenues. In this matter, Value Added Tax (VAT) at a rate of 13% was introduced in September 2016 and was raised to reach 14% in FY 2017/2018. The VAT was coupled with widening the tax base especially regarding salaries, industrial and commercial profits. Moreover, Egypt is looking forward to boosting non-tax revenue through a forthcoming offer of shares in the stock market regarding some partly state-owned companies in the field of refining and petrochemical sectors. As for expenditures, the Government reduced fuel and electricity subsidies in June 2017, followed by applying bread subsidy program in July 2017. In addition, the Government is planning to restructure the labor force within the public sector aiming to shrink the public sector’s wage bill and boost the efficiency of workers [3].
Furthermore, the government will direct 1% of the GDP in fiscal saving towards rising food subsidies and cash transfers for the sake of the low-income people covered by the social protection measures applied in the economic reform program. Consequently, the total budget deficit declined to register 1.5% of GDP in Q1 FY 2018/2019 as compared to an average of 2.3% over the last three years (Ministry of Finance, 2018). However, the government debt to GDP contributed 101.2% in 2017 up from 85% and 92.3% in 2015 and 2016 respectively (Central Bank of Egypt, 2017), and that mainly resulted from borrowing either from the local or foreign entities, in addition to the high interest repayment bill.
5.2. Exchange Rate Policy
Since the 1950s, the exchange rate was pegged to the US dollar. In this regard, Egypt adopted several regimes including initially the conventional peg in the 1960’s, followed by regular crawling peg in the 1970’s and 1980’s and the crawling bands that were adapted in the 1990’s. Over these periods, exchange rate markets took place within the official markets as well as the parallel market. Starting January 31st, 2002, Egypt had applied the managed float regime and unified the Egyptian Pound exchange rate versus foreign currencies. In December 2004, the government accomplished the transition towards the unified exchange rate regime. On January 2nd, 2005, Egypt accepted the obligations of Article VIII, Section 2, 3, and 4 of the IMF Articles of Agreement. Whereby, the obligations of Article VIII obliged the accepting countries not to impose limitations on the transfers and making of payments for current international transactions, as well as engaging in discriminatory currency arrangements or multiple currency practices, except after obtaining an approval from IMF [4] [5].
Accordingly, Egypt provided confidence to the global and international organizations that it will apply economic policies having no limitations on transfers and payments for current international transactions, in addition to abiding a multilateral payments system having no limitations. On November 3rd, 2016, The Central Bank of Egypt fully liberalized (free float regime) the Egyptian Pound exchange rate versus foreign currencies, accordingly the Egyptian Pound depreciated by around 48% recording EGP 13 for USD 1 up from EGP 8.78 for USD 1 at the end of October 2016 (CBE foreign exchange rates as of November 3rd, 2016, 1 PM) (Figure 1).
![]()
Figure 1. The exchange rate of the US dollar to the egyptian pound. Source: world bank data, year 2020. Figure is demonstrated by the authors.
5.3. Monetary Policy
CPI Inflation was hiked to its peak registering 29.5% in 2017 up from 13.8% in 2016 (World Bank 2018) This was a direct outcome of adapting free float regime, in addition to the rise in energy prices and applying the VAT rate. Consequently, the Central Bank of Egypt (CBE) applied a contractionary monetary policy and raised the interest rates in order to absorb the negative impact of inflation. On the other hand, the continues rise in interest rates are viewed as a challenge that had its negative impact on the state’s budget, which was reflected in more financial burden, matter that maintained a budget deficit, whereby interest payments contributed almost one third of total spending.
In March 2018, the annual core inflation declined to register 11.6% (Central Bank of Egypt, 2018), as a result, CBE’s Monetary Policy Committee started to gradually loosen the monetary policy in order to support the economic growth, whereby the overnight deposit rate was reduced in February 2018 by 100 bps to stand at 17.75% and similar 100 bps cut was applied for the overnight lending rate to stand at 18.75%, which was followed by another 100 bps reduction in March 2018 yielding an overnight deposit and interest rate standing at 16.75% and 17.75% respectively. In summary, interest rates of return have been reduced by 200 bps compared to a 700 bps increase since November 2016 (Central Bank of Egypt, 2018).
It is essential to mention that, after applying the free float regime which was directly followed by increasing the interest rates, these decrees succeeded to attract foreign currency portfolio inflows amounting USD 13.3 billion at the end of June 2017 compared to USD 12.5 billion at the end of June 2016, hence yielding a growth rate in FDI by 6.4% (Central Bank of Egypt, 2017). In this regard, at the end of November 2018 international reserves have shown tangible improvement registering a peak of USD 44.513 billion (Central Bank of Egypt, 2018).
5.4. Debt Policy
Egypt’s domestic debts had increased enormously to register 74% of GDP at the end of September 2018 up from 65% of GDP at the end of September 2010 (Central Bank of Egypt, 2019). The tangible increase resulted mainly from financing the budget deficit, along with the impact of paying some expenditure arrears concerning the budget sector entities. Same matter was noticed concerning external debts that had increased to register USD 93.1 billion (35.4% of GDP) at the end of September 2018 up from USD 34.7 billion (14.3% of GDP) at the end of September 2010 (Central Bank of Egypt, 2019).
5.5. Economic Co-Operation, Regional Integration and Trade
Egypt is paying great attention to regional integration in general and to the African integration in particular. In this regard, during 2010 Egypt had signed a preferential Free Trade Agreement (FTA) with Mercosur, the South American trade bloc; such agreement became effective in September 2017 directly after Argentina’s ratification. Regarding the African integration, in March 2018 in Kigali, Rwanda, Egypt along with 43 other African countries have signed an agreement to establish the African Continental Free Trade Area (AFCFTA), such agreement is foreseen as an opportunity for Egypt to penetrate new African markets, supported by Egypt’s competitive advantage and the diversity of its manufacturing sector.
Moreover, Egypt is organizing and participating in African-wide initiatives including; the Africa 2017 Business Forum that was held in December 2017, launching of the Single African Air Transport Market (SAATM) initiated by the African Union (AU). Recently Egypt hosted the third African Science, Technology, and Innovation Forum that was held in February 2018. Meanwhile, Egypt is currently an active member of COMESA, hosting the COMESA Regional Investment Agency. Starting 2019, Egypt has chaired the African Union, a matter that reflects Egypt’s close attention towards Africa [1].
6. Economic and Political Governance
This sub-section includes the economic and political governance including: Private Sector, Public Sector Management, Financial Sector and Natural Resources Management.
6.1. Private Sector
The private sector is playing a vital role in the Government’s reform program. The Government has recently applied reforms to encourage the private sector including: an industrial land, licensing law, a new investment law, launching new one-stop investment centers across Egypt, availability of online information regarding investment opportunities, a new bankruptcy law, supporting sole proprietorship companies, a law for consumer protections and another on movable collateral assets. With reference to the World Bank’s 2018 Doing Business report, Egypt lost 6 points over the year to get ranked at 128 (out of 190 countries), a matter that shows a decline in “resolving insolvency”, “ease of registering property”, “paying taxes” and “getting electricity”.
On the other hand, The World Economic Forum’s Global Competitiveness Index 2018 ranked Egypt 94 out of 140, with improvements in the infrastructure, innovation categories, institutions, market efficiency and financial market development. Nevertheless, worsening was observed in the category of higher education and training. The government continues its important role in the economy and sometimes it competes with the formal private sector. The informal sector is considered an important challenge as, in Egypt, it contributed an average of 34.24% of GDP during the period 1991 to 2015, (Medina and Schneider (2018)).
Accordingly, in 2017 the CBE had introduced an initiative in order to assist small and medium enterprises via offering financial loans with preferential interest rates of 5% and 7%, hence motivating the informal sector to get benefits from financial services and to be engaged in the formal economy.
6.2. Public Sector Management, Institutions and Reforms
According to IMF and governmental officials, the Government and public sector include 24% of Egypt’s workforce, representing around 6.5 million employees. The state has many owned public enterprising that operate in various industries including: the energy sector, banking, manufacturing, agriculture, services, tourism and transport. Such state-owned enterprises compete with the private sector and get benefits from the governmental subsidies. In March 2018, the government had launched a privatization program for 23 state owned enterprises, such program includes either selling their shares via Initial public Offering (IPO) or rising their free-floating shares on the local stock exchange.
Egypt’s reform program, backed by the IMF, targets reducing its total wage bill to almost 5.5% of GDP in 2020/2021 versus the summit of 8.5% in 2013/2014 (IMF, 2018). In this concern, the Civil Service law was approved by Parliament in 2016 aiming to reduce bureaucracy and the Government started the implementation procedures to automate the public-sector payroll. In order to improve Government procedures, further initiatives have been recently launched including online signatures and e-payment. Furthermore, the government exerted remarkable efforts to enhance fiscal transparency via publication of key budget reports. Consequently, in 2019 Egypt’s rank in the open budget index has been remarkably improved to stand at the rank of 61 out of 117 countries up from 65 in 2017. (Open Budget Survey 2019 issued by International Budget Partnership).
6.3. Financial Sector
The non-performing loans ratio (NPLs) recorded 4.3% in June 2018 down from 4.9% in June 2017 (Central Bank of Egypt, 2018), and that indicates the strengthening of the Egyptian banking sector. Whereby, the banks remain conservative having few long-term financings as well as limited mortgage market. By December 2017, the public sector was considered the prime borrower attributing 44.5% of the total loans portfolio financed by the 10 largest banks (Central Bank of Egypt, 2018). Accordingly, banks’ risk was relatively minimized, however this scenario may limit granting loans to the private sector and hinders its growth (crowding-out effect). Moreover, in December 2017 bank’s loan-to-deposit ratio registered 44.2% (Central Bank of Egypt, 2018), that indicates the availability to lend funds to the corporate companies, either public or privately owned.
Nevertheless, it was revealed that banks prefer to invest in Government securities bearing minimal risk. Unfortunately, this banks’ strategy limits growth in the private sector particularly micro, small and medium enterprises (MSMEs). CBE had a wide vision regarding banks’ strategies and initiated a plan that allows banks to grant loans to MSMEs at preferential interest rates for only 7% and 5% and instructed banks that 20% of their lending portfolio should be directed towards MSMEs, as CBE aims to benefit 350,000 MSMEs in a period of 4 years. As a result, Microfinance activities developed and witnessed a growth rate of 23% to register EGP 5.5 billion in H1 2017 compared to H1 2016. Accordingly, around 850 microfinance institutions got their licenses issued by the Financial Regulatory Authority (FRA), providing goods and services to 1.2 million customers (African Economic Outlook, Egypt, 2018).
However; savings are still less than investment financial needs, as the domestic resource gap recorded EGP 62.4 billion in Q3-2017. Egypt is still a largely cash-based economy, whereby only 12% of the population has bank accounts. Accordingly, in February 2017 the Government had introduced the national payments council to reinforce financial inclusion through launching digital national payment and subsidies disbursement system, coupled with the development of mobile banking (African Economic Outlook, Egypt, 2018, World Bank & International Monetary Fund).
6.4. Natural Resource Management and the Environment
Natural resources management and environmental sustainability are considered important issues that require continuous development at the individual and institutional levels, as well as creating jobs in this field. With reference to the Environmental Performance Index (2018), Egypt was ranked 66 out of 180 countries, whereby the government exerted efforts, including restructuring the water and sanitation sectors and applying institutional and price reform strategies, as well as improving the quality of the marine ecosystem. In addition, Egypt is looking forward to decreasing air pollution by reducing Carbon dioxide (CO2) and Sulfur dioxide (SO2) emissions.
Throughout the past decade, Egypt had signed and approved many agreements concerning climate change, nature conservation, marine pollution and waste & dangerous substances, latest of which was in March 2018, whereby a partnership development framework agreement for the years 2018-2022 was signed between Egypt and the United Nations. This agreement includes a component regarding natural resource management and environmental sustainability that concentrates on managing the country’s natural resources with efficiency, along with mitigating environmental and climate changes risks (African Economic Outlook, Egypt, 2018).
7. Social Conditions
This sub-section includes the social conditions: human resources development, social protection and gender equality.
7.1. Human Resources Development
According to the 2014 Constitution, it is compulsory for Egypt to direct 10% of GDP towards spending on education, health and research. Unfortunately, this target is not met yet, being negatively affected by the large size of the population that recorded around 96.3 million in early 2018 with a growth rate of 1.58% as announced by Central Agency for Public Mobilization and Statistics (CAPMAS). In this concern, health expenditure decreased in FY 2017/2018 to register 1.34% down from 1.43% and 1.62% in FY 2016/2017 and FY 2015/2016 respectively. Same token regarding education and research expenditure that decreased in FY 2017/2018 to register 2.60% down from 3.05% and 3.59% in FY 2016/2017 and FY 2015/2016 respectively (African Economic Outlook, Egypt, 2018).
In December 2017, the Parliament had approved the Extensive Health Insurance Act that partially mitigates inefficiencies in the health sector. Accordingly, by 2030 extensive health insurance coverage will be extended to include all the Egyptians. This new system will be financed through a healthcare industry tax, contributory payments, as well as other sources. According to the latest official announcement, the overall literacy rate recorded 75.2% (83.2% for men and 67.3% for women), whereby the attendance rates for boys and girls in the primary education is equal and the enrolment increases in the secondary education. Nevertheless, the education quality is unsatisfactory, whereby the 2018 Global Competitiveness Report ranked Egypt in the 133 places out of 137 in quality of primary education. In this matter, the Government has introduced an ambitions education reform program that includes piloting public-private partnerships (PPPs) [6].
7.2. Poverty Fighting and Social Protection
A group of integrated social reforms has been introduced by the government aiming to mitigate the sharp impact of the economic reform program. In this matter, Takaful and Karama, as well as cash transfer program were launched in 2015 for the purpose of lifting the level of cash transfers to consider the levels of inflation. Meanwhile, restructuring subsidies is an important challenge that was took through by the government to reduce leakages and to ensure that subsidies are directed to the needy people, hence allowance for food subsidies was doubled in 2017/2018 to reach LE 50 up from LE 21 per beneficiary. Other governmental efforts have been exerted including granting wage bonus of 7% - 10% for employees within the public sector, in addition to raising pensions by 15% (African Economic Outlook, Egypt, 2018).
Moreover, to enhance the standard of living, starting 2017, the government had launched a five-year plan to build one million social housing flats for low-income people. In addition, it is planned that, by 2020, urban areas should be fully covered by household sanitation, while the rural areas are planned to be fully covered by 2037. Furthermore, by the end of 2019 it is planned to completely upgrade all the unsafe settlements throughout Egypt. Unemployment is another important challenge that Egypt faces, whereby around one million graduates annually join the labor force, consequently several strategies have been applied to dampen the unemployment, these strategies include giving support to small and medium enterprises (SMEs), as well as having financial inclusion and encouraging youth entrepreneurship. Consequently, the rate of the unemployment has decreased to register 12.079% in 2017 (World Bank, 2018).
7.3. Gender Equality
According to the World Economic Forum’s Global Gender Gap Report (2017), Egypt ranked 134 out of 144 countries, whereby unequal accesses to economic opportunities, unequal economic participation, as well as low political empowerment for women were observed. Moreover, women’s labor force participation rate was observed at its low level, whereas around 75% of Egyptian women are not participating in the labor force compared to a participation rate of 79% for men. In this matter, Egypt has an opportunity to boost its GDP by 34% whenever the labor force participation rates of females (currently standing at 26%) is raised to match the labor force participation rates of males that currently stand at 79% (IMF, 2018). The females’ labor force participation rate can be raised by enhancing the safety of public transportation, increasing the availability of childcare, as well as introducing flexible rules and regulations for maternity leave as well as parental services and encouraging women entrepreneurship (African Economic Outlook, Egypt, 2018).
8. Defining the Shadow Economy
In this concern, this study pursues Schneider’s particular definition of the shadow economy being; the shadow economy considers the legitimate economic activities that, if registered, should contribute to the country’s GDP. In this aspect, the shadow economy comprises all market-based, lawful production or trade of goods and services intentionally concealed from governmental authorities so that to; avoid either payment of income, or taxes, or social security dues, or to get around some labor market conditions, such as; minimum salaries, labor rights, safety standards, maximum working hours; or to evade from being in compliance with administrative procedures. In addition, this study does not take into consideration illegitimate or criminal activities, charitable, do-it-yourself, or household activities [7] [8] [9].
8.1. Causes of the Shadow Economy “Causal/Independent Variables”
Tax & Social Security Contribution Burden, Corruption, Intensity of Regulation, Public Sector Services, Tax Morale, Deterrence, Development of the official economy, Self-employment rate, Unemployment rate, Size of the agricultural sector, Income inequality and Entrepreneurial capability.
8.2. Indicators of the Shadow Economy “Dependent Variables”
Four major indicators of the shadow economy are briefly addressed including; Real GDP Growth Rate “Formal Economy”, Currency/Cash outside banks, Labor Force Participation Rate and Inflation Rate.
9. Empirical Study
This part of the study aims to apply the multiple indicators multiple causes (MIMIC) approach, to estimate the size of the shadow economy in Egypt during the period 2000-2017 and to assess the determinants of the shadow economy and their impact on major macroeconomic indicators in Egypt during the period 2000-2017 and accordingly setting policy implications.
The relationships tested in this study are: the relationship between size of shadow economy and its causes, which are; Total Tax/GDP, Intensity of Regulation (Government Spending/GDP), (Corruption/Quality of public institutions), Unemployment Rate, Self-employment Rate, Size of the Agricultural Sector, Fairness of Income Distribution, and Entrepreneurial Ecosystem. In addition to the relation between size of shadow economy and its indicators, which are; Real GDP Growth Rate, Coins and Currency in Circulation, Labor Force Participation Rate and Inflation.
The MIMIC model is a structural equation modeling (SEM), being a confirmatory method that emphasizes the influence of a group of causal variables on the latent variable (shadow economy), accompanied by the influence of the shadow economy on macroeconomic indicators.
9.1. The Causal Variables
Eight major causal variables for the shadow economy are briefly addressed including; tax burden, intensity of regulations, corruption, unemployment rate, self-employment rate, size of the agriculture sector, fairness of income distribution and entrepreneurial eco system.
9.1.1. Tax and Social Security Contribution Burden
The shadow economy is positively affected by higher taxes, tax burden is measured by total tax revenues as percentage of GDP [10] - [15].
Hypothesis 1: The higher the tax burden, the larger the size of the shadow economy, ceteris paribus.
9.1.2. Intensity of Regulation
Each measure of regulation is directly correlated with the size of the shadow economy and the more rules and regulations result in increasing the size of the shadow economy. In addition, the regulatory burden leads to larger sizes of shadow economy. The regulatory burden is measured by total government spending as percentage of GDP [16] [17] [18] [19].
Hypothesis 2: The more intensive the regulatory burden, the larger the size of the shadow economy, ceteris paribus.
9.1.3. Corruption/The Quality of Public Institutions
The relationship between corruption and shadow economy can be viewed either as a complementary (positive) or substitutional (negative) relationship. Level of corruption is measured by the corruption perception index (CPI) [16] [20] [21] [22].
Hypothesis 3: The higher the level of corruption, the larger the size of the shadow economy, ceteris paribus.
9.1.4. Unemployment
A positive relationship between the unemployment and the shadow economy is revealed. However, a negative relationship is usually revealed during recession. Unemployment is measured by the total unemployment as a percentage of labor force [23].
Hypothesis 4: The higher the unemployment rate, the larger the size of the shadow economy, ceteris paribus.
9.1.5. Self-Employment
Self-employment has a positive and significant effect on the size of the shadow economy. Self-employment is measured by the total self-employed as percentage of total employed [23] [24] [25] [26].
Hypothesis 5: The higher the self-employment rate, the larger the size of the shadow economy, ceteris paribus.
9.1.6. Size of the Agricultural Sector
A positive relationship between the level of the agricultural sector and the shadow economy usually exists. Size of the agriculture sector is measured by the agricultural value-added as % of GDP [26].
Hypothesis 6: The more dominant the agriculture sector, the larger the size of the shadow economy, ceteris paribus.
9.1.7. Income Inequality
The relationship between income inequality and the shadow economy is positive. Income inequality is measured by the Gini coefficient (Gini) [6] [11] [27].
Hypothesis 7: The less the level of income equality, the larger the size of the shadow economy, ceteris paribus.
9.1.8. Entrepreneurship
The relationship between entrepreneurship and economic development is indefinite. Entrepreneurship is measured by the Cost of starting a business [22] [28] [29] [30] [31].
Hypothesis 8: The more intensity of regulation, the high corruption, higher unemployment, higher self-employment rate and higher income inequality will negatively affect productive entrepreneurship and consequently the larger the size of the shadow economy, ceteris paribus.
9.2. Indicators of the Shadow Economy “Dependent Variables”
Four major indicators of the shadow economy are briefly addressed including; Real GDP growth rate “Formal economy”, Currency in circulation” cash outside banks”, Labor force participation rate and Inflation.
9.2.1. Real GDP Growth Rate (Economic Growth)
The relationship between the official economy (GDP) and the shadow economy differs from one country to another, as no consensus exists in the literature about the exact type of the relationship between the two variables. In the MIMIC model applied in this study, the real GDP index is used as an indicator to reflect the existence of the shadow economy [12] [19] [26] [27].
Hypothesis 9: The larger the size of the shadow economy, the lower the GDP growth rate, ceteris paribus.
9.2.2. Currency in Circulation “Cash outside Banks”
A significant and positive relationship was observed between the size of the shadow economy and currency held by the public. Currency is proxied by the ratio of M1 to M2 [8] [16] [23] [26].
Hypothesis 10: The larger the size of the shadow economy, the larger the money held and transacted by the public, ceteris paribus.
9.2.3. Labor Force Participation Rate
The effect of the participation rate of registered labor on the shadow economy is subject to an argument. Labor force participation rate is measured by the total of workforce as percentage of working age population [8] [10] [23] [26].
Hypothesis 11: The larger the size of the shadow economy, the lower the official labor force participation rate, ceteris paribus.
9.2.4. Inflation
A significant and positive relationship usually occurs between the size of the shadow economy and inflation. The inflation rate is measured by the GDP Deflator [26] [32].
Hypothesis 12: The larger the size of the shadow economy, the larger the inflation rate, ceteris paribus.
9.3. Estimating the Size of the Shadow Economy Using the MIMIC Approach Applying the Structural Equation Modeling
In this section, the MIMIC approach is implemented to estimate the size of the shadow economy using the SEM analysis. Figure 2 shows the proposed SEM model for the research model, where the research variables are: Total Tax/GDP, Intensity of Regulation, Corruption/Quality of public institutions, Unemployment Rate, Self-employment Rate, and Size of the Agricultural Sector, Fairness of Income Distribution and Entrepreneurial Ecosystem representing the causes of the size of the shadow economy. Also, the research variables; Real GDP Growth Rate, Coins and Currency in Circulation, Labor Force Participation Rate and Inflation represent the indicators of the size of the shadow economy.
![]()
Figure 2. Proposed SEM for the research model.
The proposed model shown in Figure 2 faces several problems regarding the model fit indices of the model which requires deleting some variables to reach the optimum model with the best fit indices for the model.
Accordingly, the model actually applied the research variables; Intensity of Regulation, Corruption/Quality of public institutions, Fairness of Income Distribution and Entrepreneurial Ecosystem “representing the causes of the size of the shadow economy” and Real GDP Growth Rate, Coins and Currency in Circulation and Labor Force Participation Rate “representing the indicators of the size of the shadow economy”. Other variables were deleted due to multicollinearity problem and bad modification indices, which is discussed below in details.
Figure 3 shows the model fitted after deleting variables leading to the problem of multicollinearity. The fit indices shown for the model were as follows; CMIN/DF = 2.717, GFI = 0.964, CFI = 0.853, AGFI = 0.873, and RMSEA = 0.103 “all are within their acceptable levels, which makes the model acceptable as shown in Figure 3”.
![]()
Figure 3. Actual SEM applied for the research model.
Regarding testing the MIMIC approach, Table 4 shows the SEM analysis of the impact of Research Variables: Intensity of Regulation, Corruption Quality of public institutions, Fairness of Income Distribution and Entrepreneurial Ecosystem on Shadow Economy. It could be observed that there is a positive significant impact of Intensity of Regulation and Entrepreneurial Ecosystem on Shadow Economy, as the estimates are 0.103, and 0.068, as well as P-value is less than 0.05.
![]()
Table 4. SEM analysis of research model.
Table 5 shows the Size of Shadow Economy in Egypt using the MIMIC Approach, that was estimated at USD 42,333,506,146 in 2000 and USD 44,951,065,661 in 2017 with average of USD 42,333,506,146 throughout the period 2000 till 2017. Table 6 shows the indices of the shadow economy for Egypt for the period from 2000 to 2017. It is observed that there was a slight improvement in the index during 2017 as it recorded a value of 19% down from 20% in 2016 and this is mainly attributed to the liberalization of the foreign exchange rate that took place on November 3rd, 2016.
![]()
Table 5. Size of shadow economy using the MIMIC approach.
Value of the shadow economy in USD, along with its index as a percentage of GDP.
![]()
Table 6. Index of shadow economy using the MIMIC approach.
Value of the shadow economy in USD, along with its index as a percentage of GDP.
![]()
Figure 4. Indices of shadow economy for Egypt in the period 2000 to 2017. Source: Author’s calculations.
Figure 4 shows a comparison between the indices of the shadow economy for Egypt for the period from 2000 to 2017. It is observed that there was a slight improvement in the index during 2017 as it recorded a value of 19% down from 20% in 2016 and this is mainly attributed to the liberalization of the foreign exchange rate that took place on November 3rd, 2016.
10. Comparison between This Study and the Results of Hassan and Schneider, 2016
In a comparison between the results revealed from this study with one of the few studies to estimate the size of shadow economy particularly in Egypt, (Hassan and Schneider, 2016) estimated the size of shadow economy in Egypt during the period from 1976 to 2013 using the MIMIC approach. It is observed that the results of both studies during the period from 2000 to 2013 are all within the same range, these results are presented in Table 7.
![]()
Table 7. Comparison between the results revealed from the current study versus Hassan and Schneider (2016).
§Source: Author’s calculations ¨Source: Hassan and Schneider (2016).
11. Major Challenges and Opportunities
This sub-section discusses the major challenges and opportunities that face the Egyptian economy, including the rapidly growing population, leveraging the economy and providing protection to the low-income people through providing social safety network.
11.1. Taking Advantage of the Rapidly Growing Population
According to the IMF, the labor force is expected to witness around 3.5 million new graduates during the next five years, a matter that could be on the one hand a threat that will raise the unemployment rates and negatively affect the society & the economy and could be on the other hand an opportunity to boost the whole economy and accelerating the growth rate. Hence, giving support to the private sector is viewed important in order to absorb new graduates as well as positively affecting the economy. Throughout the previous decades, Egypt’s private sector was less dynamic and outward-oriented compared to the peer countries, whereby few firms were capable to compete outside the local market. In this matter, the government took several steps to support and strengthen the private sector; such steps included introducing new regulations for better efficiency of land allocation, enhance transparency of state-owned enterprises, eliminating corruption and strengthening competition.
11.2. Leveraging the Economy
Egypt is moving ahead to leverage its economy through the ultimate allocation of resources and eliminate the price distortions that hinder markets from performing properly. In this concern, energy subsidies have been found as an important factor in price distortions, as the government kept fuel costs less than the global market prices, a matter that resulted in inefficient usage. Moreover, over investment was directed towards capital investment industries to get the benefits of the subsidized energy, a matter that did not result in equal benefits for the investors and negatively affected people’s standard of living. The corrective measures that the government had implemented by the gradual removal of energy subsidies will have a remarkable result in enhancing the efficiency of the economy by the efficient reallocation of resources.
Investments will be gradually directed towards all industries and will not be limited to the capital intensive and the heavy energy usage industries. Consequently, small and medium sized companies are expected to witness inflows of investments, a matter that will lead to creation of jobs and boosting the economy and reducing unemployment. In addition, reducing energy subsidies will free up resources that will benefit health and education sectors, being two of the major sectors that are in critical need for improvement.
11.3. Protecting the Low-Income People via Providing Social Safety Network
Another challenge that faces Egypt is protecting the low-income people via providing social safety network, this currently takes place by reducing energy prices and to be replaced by subsidies that are allocated to the low income and poor through extending cash transfer and food subsidy programs. In this matter, the government had improved social care programs like food smart cards by doubling their benefits. Moreover, the government had improved social solidarity pensions, as well as the Takaful and Karama cash transfer programs. (Takaful is described as income support program designed for families that have children, while Karama is described as a social inclusion program for people who are not capable to work, especially the elderly and disabled people). These efforts are coupled with a reform program targeting enhancing government spending and increasing tax revenues, so that the poor are protected and covered by social networks supported by investments in human capital in the form of investment in health and education sectors.
12. Conclusions and Recommendations for Practitioners
Five decades have passed since the early stages of researches that took place in order to study the phenomenon of the shadow economy, several research papers came through to examine and estimate it, and accordingly a definite definition should exist. Nevertheless, till date no common agreed upon definition has been quantified. With reference to the literature, this study believes that Schneider’s narrow definition of the shadow economy being; the shadow economy reflects the legal economic and productive activities that, if registered, should contribute to the country’s GDP, is viewed as the optimal definition that exists so far. From this point and despite of the obvious difficulties in estimating the size of the shadow economy, concerted efforts should be exerted not only to estimate the size of the shadow economy, but also to provide ways and tools for countries enabling them to merge the shadow economy in the formal one, especially that there is a literature gap regarding such tools.
The increasing share of the shadow economy has attracted the attention of many researchers to believe that the growth rate in the shadow economy is much faster than the official one, a matter that can be an important sector in the advanced socio-economies. In this concern, many countries have paid efforts to modify their political economies. The complication of this modification has shown up in several outcomes in these countries. Some countries, especially in Europe, successfully improved economic growth, in addition to controlling poverty and income inequality. However, economic inequality still exists in some countries due to having other factors, namely a huge shadow economy, which affects the economic growth.
With reference to the developing countries, it is observed that a large portion of the population depends, for its livelihood, on activities within the shadow economy. Their income is generated from subsistence farming or through operating small unincorporated enterprises, selling products at a roadside stand or; selling cooked food from kiosks or selling home made products; transporting people or delivering goods by bicycles or motor bikes; repairing clothes, shoes, cars and motor scooters workshops; or those labor working in construction sites or providing a range of personal and home services like hairdressing, laundries, plumbers, technicians, etc. Those who work under the umbrella of the shadow economy have no access to social security and operate away from the recorded employment and safety legislation and are paying no taxes.
In this study, it is concluded that, the best way to get benefits from the shadow economy is to be merged in the official one, no matter how much time this merge could take. With reference to Egypt, a suggested five years implementation plan can be suitable for Egypt. With reference to Table 8, the researcher’s recommendations are developed as follows:
![]()
Table 8. Summary of the effect of the independent variables on the shadow economy.
・ Entrepreneurial Ecosystem is concluded to explain 85.1% of the variation of the Shadow Economy, in this matter:
○ The Government should encourage and support entrepreneurs, via supporting Small and Medium Enterprises (SMEs) by providing finance with preferential interest rates.
○ The Government should consider the financial technology “Fin Tech” as a promising area of development that could be a tool to capture the shadow economy in order to be merged with the formal economy. The Entrepreneurial Ecosystem can introduce mobile applications and software programs to offer people variety of services in several aspects of life for example; public transportation (example: Uber, Careem and Swvl), clinics (example: Visita application), technicians (example: Fixawy application), food delivery (example: Otlob application). Consequently, participants in the shadow economy can be tackled and smoothly integrated in the official economy.
○ The Government should launch awareness campaigns, as many people lack knowledge regarding the shadow economy. People’s cultures and behavior should be reshaped, as individuals and end consumers should adopt new mind-set.
・ It is concluded that Unemployment and Size of Agriculture Sector explains 57.4% and 39.2% respectively of the variation of the Shadow Economy, in this regard:
Providing new job opportunities is deemed a necessary action to control the unemployment, hence people get employed rather than seeking for jobs in the shadow economy. Accordingly, the government should attract foreign direct investments, as well as supporting the local investors, implementing mega projects and providing infrastructures for new industrial zones and new industrial hubs along with the necessary logistics. Moreover, the Government should exert efforts and introduce new effective tools and regulations to restore Egypt’s agricultural sector.
・ It is concluded that Total Tax/GDP explains 32.3%, of the variation of the Shadow Economy, in this regard:
○ Governments should encourage shadow economy participants to get engaged in the formal economy via offering tax exemptions for a period of five years, a matter which is supported by the announcement of the President Abd El Fattah El Sisi in May 2018.
○ Economic scan should be launched to recognize every unregistered entity that provides either products and/or services. In this regard, Egypt has already launched an economic scan in October 2018 and was accomplished in 2019.
○ Payment transactions should be shifted from cash payments towards electronic payments, hence forcing all parties to be involved with the banking system, achieve financial inclusion and having cash less economy in order to limit transactions within the shadow economy. In this regard, the National Council for Payments was established in 2017, headed by the President Abd El Fattah El Sisi, in order to reduce the use of cash outside the banking system, encouraging the use of electronic payments and developing the national payments systems. In this matter, government should start by itself, whereby all governmental revenues and fees (taxes, customs, fines, fees, bills “water bills, gas bills, electricity bills, telephone bills, etc.”, medical payments, educational payments, etc. should be collected via e-payments or bank transfers or credit/debit cards.
・ It is concluded that Fairness of Income Distribution, Corruption/ Quality of Institution and Intensity of Regulation explain 14.5%, 11.1% and 9.8% respectively of the variation of the Shadow Economy. In this regard:
○ Salaries and wages should be restructured in both private and public sectors in order to ensure applying a salary scheme that is matching with productivity and maintains the standards of living.
○ Government should introduce tools in order to ensure that subsidies are directed towards the poor people only.
○ Financial inclusion should be spread to the public and every citizen who has reached 18 years old must have a bank account. This is viewed as the first step toward the cash less economy.
○ Any account in banks or post offices or any other financial institution should be linked by the Individual ID number and Companies Commercial register number, being the main tracking tool for people’s source of fund.
○ Every single legal activity should be regulated and licensed for example:
- Street vendors should be regularized by being gathered to sell their products in specific locations in governorates and cities’ down towns.
- Untraditional transportation vehicles (tricycles and tuk tuk) should be regularized and licensed in specific routes and locations, otherwise to be legally prohibited.
○ The government should get rid of bureaucracy and routine, whereas flexibility should be felt by the people. In this concern, it is recommended to provide public banks and post offices, all over the country, with application forms in order to be filled in by individuals/entities participating in the shadow economy and requesting them to get engaged in the formal activities. Applications should be referred to the concerned party in the government being the CBE or Ministry of Trade and Industry. This step could be also applied via creating a hot line phone number for people easily approached and to fill in the application over the phone. Regarding entities, applicants, registration procedures must be under the government supervision and include extracting necessary documents such as: commercial registers and tax cards, assigning accounting firms to prepare financial statements for entities. Total registration fees could be paid over one year.
Abbreviations
CBE: Central Bank of Egypt
GDP: Gross domestic product
IMF: International Monetary Fund
MIMIC: Multiple Indicators Multiple Causes
SE: Shadow Economy
SEM: Structural Equation Modeling