Agronomic Efficiency of Deep Urea Placement Technology in Lowland Rice Cultivation in the Ecological Conditions of the Sikasso Region in Mali: Case of the Village of Dalabani ()

1. Introduction
The world’s population is projected to increase from more than 7 billion today to 9.2 billion in 2050 [1], creating enormous challenges for farmers who are actively working to provide adequate nutritious food to the world. In terms of human food consumption, rice is the world’s most important cereal and is now the staple diet in the least developed countries [2]. It is, together with wheat, the most widely consumed cereal in the world [3] [4]. In Africa, the second most important cereal crop (rice) accounts for only 2% of production and the largest producers are Nigeria, Mali, Côte d’Ivoire and Guinea [5]. In contrast, Asian countries are the main producers and consumers with 91% of world production [6]. Rice is a strategic commodity chain for the West African sub-region, both in terms of its contribution to the Gross Domestic Product (GDP) and in terms of the challenges related to food security [7].
In Mali, the economy is essentially based on the agricultural sector [8]. The agricultural sector employs nearly 75% of the active population, contributes 44% of GDP, provides 30% of export revenues and accounted for 83.4% of the employed workforce in 2010 [9]. Rice production alone generates 5% of the country’s GDP, or about F CFA 220 billion per year [10]. The rice growing systems that ensure this production are rainfed or traditional systems (lowland, strict rainfall and flooding) with 57% of the cultivated area [11]. The lowlands in Mali represent about 8% of the rice-growing areas and more than 17% of the Arab lands in southern Mali [12]. However, in addition to nitrogen fertilization, considered as one of the limiting factors in rice productivity, uncertain climatic conditions also constitute a limiting factor for the development of rice cultivation in the lowlands [13]. An important factor in rice productivity is organic and mineral fertilization, especially nitrogen, with nitrogen being the limiting factor [14].
The current fertilization practice is mainly based on mineral fertilizers and especially on the use of simple urea applied as a broadcast fertilizer [15]. This method of application is inefficient as it leads to very high nitrogen losses [16]. So increasing nitrogen efficiency is both an environmental and economic necessity [17]. In rice cultivation, nitrogen (N) supplied in the form of urea plays an important role in increasing paddy production. Nitrogen is not only the most limiting nutrient, but also the most vulnerable and subject to considerable losses [18]. These include poor timing of the urea supply period and the physiological needs of rice, broadcast application, soil types, etc. [17]. Nitrogen management therefore requires the utmost technical precaution in terms of reasonable doses, mode and timing of application [13].
The use of urea granules (Urea Super Granules “USG”) in irrigated rice compared to other nitrogenous fertilizers such as pearl urea or ammonium sulphate reduces nitrogen losses by 50% and at the same time provides an estimated 25% surplus of paddy production. Paddy yield gains range from 15% to 25% with a reduction in production costs of up to 50% [19].
The Fertilizer Deep Placement (FDP) technology consists of burying 1.8 g urea granules at a depth of 7 - 10 cm in irrigated rice cultivation, 7 days after transplanting. If all conditions are met, the amount of nitrogen contained in the urea granules would be sufficient to meet the nutritional nitrogen requirements of the rice from transplanting to harvest. Rice yields with FDP are on average 30% higher, an additional 1.2 tonnes/ha [1].
In double cropping systems, farmers earn an additional annual income of about 192,000 CFA francs per ha compared to farmers using traditional methods [1].
The use of Deep Placement of Urea (DPU) on lowland rice is in line with the IFDC’s concern about the intensification of agricultural production in production systems, with a view to developing specific fertilization recommendations for different production systems. These recommendations will help improve fertilizer efficiency. Thus, the introduction of Fertilizer Deep Placement (FDP) technology in the Sikasso ecological zone, Bougouni circle is a medium and long-term solution envisaged to increase the yields of lowland rice producers and their incomes, reduce the quantity of fertilizers used and thus reduce the environmental damage caused to the atmosphere and water. So increasing nitrogen efficiency is both an environmental and an economic necessity.
This work will attempt to answer the following questions: 1) What is the efficiency of using granules (Urea, DAP) on the yield of lowland rice in the agro-pedoclimatic conditions of Bougouni? 2) How can the nitrogen recovery rate be increased by deep placement of fertilizers? 3) What is the most efficient form of urea and DAP (Super Granular and Simple)?
The following assumptions are considered: 1) The use of granules increases the yield of lowland rice in the agro-pedoclimatic conditions of Bougouni; 2) FDP (urea) significantly increases the nitrogen recovery rate. 3) The efficiency of nitrogen fertilizers is higher if they are applied in the form of super granules (DPU).
The general objective of this study is to contribute to increasing lowland rice production in Mali. Specifically, it will determine the effects of organic manure, forms of mineral fertilizers and their interactions on lowland rice productivity; highlight the influence of deep urea placement on nitrogen loss; and finally, identify the best combinations of organic and mineral fertilizer forms for lowland rice.
2. Materials and Methods
2.1. Presentation of Study Area
2.1.1. Geographical Location
The study area is located in the Republic of Mali, in the region of Sikasso and more precisely in the Cercle de Bougouni. The site is located in the rice-growing lowland of the Dalabani National Seed Service (SSN), some Kilometer from Bougouni on the Bougouni-Sikasso axis. Its geographical coordinates are 11˚23.926' north latitude and 07˚28.315' west longitude with an altitude of 298 m. It covers an area of 100 ha (Figure 1).
2.1.2. Relief and Hydrography
The site is a vast plain interspersed in places with small elevations. It is of the rugged type characterized by alternating plateaus and valleys. Its altitude varies between 298 and 323 m. Maximum and minimum temperatures are respectively 34˚C and 21˚C with an annual average of 27˚C [20]. The area is well watered by several rivers and streams. The most important is the Baoulé River.
![]()
Figure 1. Map of the study area showing the test site in yellow.
2.1.3. Climate
The climate is sub-Guinean and has two alternating seasons: the rainy season from May to October with abundant rainfall exceeding 1000 mm per year and the dry season from November to April [20]. According to the National Seed Service (SSN) assessment reports, from 2010 to 2015, the annual water levels (rainfall) varied respectively from 1059.2 mm for 2010-2011; 846.3 mm for 2011-2012; 791.7 mm for 2012-2013; 914.1 mm for 2013-2014 and 1028.6 mm for 2014-2015 with an average of 927.98 mm [21].
2.1.4. Végétation
Vegetation is dominated by a few weeds including Cyperaceae, Digitaria exjulis and Antropogon Gayanis. The site also abounds in other species such as Vitellaria paradoxa, Parkia biglobosa, Terminalia avicennioides, Ximenia americana, Pterocarpus erinaceus, Piliostigma reticulatum, Combretum aculeatum, Sarcocephalus latifolius.
2.1.5. Physico-Chemical Characteristics of the Soil
The soil of the Dalabani National Seed Service is a hydromorphic ferruginous type with a silty-clay texture. The physico-chemical characteristics of the 0 - 20 cm depth layer of the soils sampled from the plots before the trial was set up for the evaluation of fertilizer application technologies are shown in Table 1. The pH of this soil is 4.74. The soils are slightly acidic, low in nitrogen and organic matter, and very low in available phosphorus.
2.1.6. History of Use of the Site
The history of use of the site reveals that over the period from 2011 to 2015, the site has been used for several purposes, in particular, PPU (Deep Placement Urea) testing, seed production, fallow land, seed production. The history of the test plot can be found in Table 2.
2.2. Matériel Végétal
The variety used to conduct the test is Adny-11 (ORYZA SATIVA) rice, the characteristics of which are given below.
Origin: SIERA LEONE
Botanical Group: INDICA
Vegetative characteristics: Average cycle of 120 days (sowing-maturity) with a height of 1.10 m. Average tessellation and leaf colour are green.
![]()
Table 1. Physico-chemical characteristics of the soil.
Source: Soil analysis results (0 - 20 cm), 2015/LABOSOL IER.
Grain characteristics: Long type, paddy colour is yellow with length and width respectively: 9.5 mm and 2.2 mm. The weight of 1000 grains is 22.4 g.
Technological Characteristics: The taste when cooked is good.
Special characteristics: Non-photosensitive with slow growth, it is resistant and tolerant to blast. It is resistant to lodging and the shelling is medium.
Adaptation area: Isolated or water blade is suitable for irrigated and lowland rice cultivation.
Productivity: 5 to 6 t/ha in good conditions [22].
2.3. Inputs
2.3.1. Pearl Urea or Simple Urea
Urea of the formula CO(NH2)2 is a fertilizer from the starch group which contains 46% ammoniacal nitrogen or more precisely urea [19]. It is packaged in small beads with a diameter of 1 to 2 mm (Photo 1). It is the most concentrated solid nitrogen fertilizer [19]. In the soil, the urea is hydrolysed into carbamate and then into ammonium carbonate under the action of a microbial enzyme called urease.
2.3.2. Super Granular Urea (USG)
USG is obtained by compressing ordinary (prilled) urea with a granulator. It is a simple physical transformation of ordinary urea without any physical or chemical ingredients (Photo 2). A 50 kg bag of compressed regular prilled urea yields about 49.5 kg of granules. Urea granules are round pellets, about 1.5 cm in diameter and weigh 1.8 g each.
2.3.3. DAP Granulate
Like urea, ordinary DAP is also granulated by compressing with the granulator (Photo 3). However, the granulation of DAP is more complicated because it is harder and its specific weight of about 1.5 cm in diameter, 2.6 g instead of 1.8 g is significantly higher than that of urea.
2.3.4. The Mixture of Urea and DAP Granules
The granules of the urea DAP mixture are round pellets, about 1.5 cm in diameter (2.3 g instead of 1.8 g) and 2 cm (3.1 g instead of 2.7 g) as can be seen in
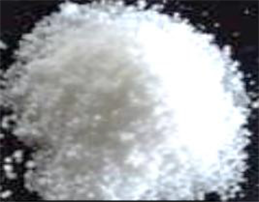
Photo 1. Pearl urea or simple urea.

Photo 2. Super granular urea.
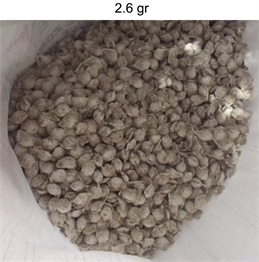
Photo 3. DAP granulate urea.
Photo 4(a) and Photo 4(b). However, the weight of the granule varies according to the specific weight of the type of fertilizer that has been granulated.
NB: Granules of 1.8 g for urea, 2.6 g for DAP, 2.3 g for urea − DAP mix with a diameter of 1.5 cm and 3.1 g for urea − DAP mix with a diameter of 1.5 to 2 cm corresponding to 113 kg/ha of urea, 175 kg/ha of DAP, 144 kg/ha of urea + DAP and 194 kg/ha of urea + DAP respectively were used.
2.3.5. Industrial Organic Manure (FERTINOVA 4-3-3)
It is a biofertilizer rich in organic matter, nutrients (NPK) and trace elements of natural origin. Its composition is: Nitrogen (N) 4%; Phosphoric Anhydride (P2O5) 3%; Potassium Oxide (K2O) 3%; Trace elements (Fe, B, Ze, Mo …) 1%; Organic matter greater than 25%; C/N 8 to 12% and Humidity 20% (Photo 5). The prescribed dose in rice cultivation is 500 kg to 1 ton/hectare as a soil amendment.
2.4. Méthod
2.4.1. Experimental Device
The experimental device is the split plot with four replicates and includes twelve treatments (see ground plan).
1) Plot dimensions:
These treatments were carried out on elementary plots of 25 m2 (5 m × 5 m).
Experimental sub-units: 5 m × 5 m, i.e. 25 m2; with spacing of 0.50 m between experimental sub-units;
Surface area of a poquet = 20 cm × 20 cm;
Main plots: 10.5 m × 5 m, i.e. 52.5 m2 with 1 m aisles between main plots;
Blocks: 33.5 m × 10.5 m, i.e. 351.75 m2 = 0.04 ha with 0.5 m alleys between blocks;
Trial area: 33.5 m × 44.5 m, i.e. 1486.3 m2 = 0.10 ha.
The ground plan is shown in Figure 2.
![]() (a)
(a)
![]() (b)
(b)
Photo 4. The mixture of Urea and DAP Granules. (a) Mixture urea and DAP granules 2.3 gr; (b) mixture urea and DAP granules 3.1 gr.
![]()
Photo 5. Fertinova 4-3-3.
2.4.2. Factors Studied
Two factors were studied, namely:
1) The dose of organic manure, taken at two levels of variation as the main factor;
2) The form of mineral fertilizer taken at six levels of variation as a secondary factor.
Table 3 gives these different levels of variation.
2.4.3. Treatments
The combination of the levels of the different factors gives us a total of twelve treatments which are: T1 = FO + F0; T2 = SFO + F0; T3 = FO + F1; T4 = SFO + F1; T5 = FO + F2; T6 = SFO + F2; T7 = FO + F3; T8 = SFO + F3; T9 = FO + F4; T10 = SFO + F4; T11 = FO + F5; T12 = SFO + F5.
The specific weights of the granules and their doses used per treatment are shown in Table 4, Table 5.
2.4.4. Cultivation Operations
1) Preparing the ground
It consisted of ploughing (with the tractor) followed by harrowing (with the harrow). The plot is then levelled to allow each plot to benefit from the same conditions in the water level.
After the plot was staked and installed, the Fertinova industrial organic manure (4-3-3) was spread in accordance with the cultivation calendar.
2) Seedling
Direct seeding was carried out manually with the daba, in a row packer and at a spacing of 20 cm between rows and 20 cm between rows, i.e. a density of 160,000 poquets/ha, i.e. 16,000 poquets for our trial plot (0.10 ha). The sowing was done after a rainfall of 26.1 mm.
![]()
Table 3. Different levels of factor variation.
![]()
Table 4. Test weights of granule samples for each case.
![]()
Table 5. Quantity of fertilizer in kg in treatments.
3) Demarage
It was done at the rate of one plan per pot on the eve of fertilizer application. It consisted of reducing the number of plants in the pot.
4) Crop maintenance
Two weedings were done during this trial: the first took place at the same time as the unmarriage and the second 20 days after the first.
5) Maintenance of the crop
Two weedings were carried out during this trial: the first one took place at the same time as the first weeding, time to get married and the second 20 days after the first.
6) Fertilizer application
It should be noted that mineral fertilizer applications took place 17 days after direct seeding instead of 10 to 15 days after direct seeding (recommended by the protocol) because of the 9-day dry spell. The granules were applied at a depth of 7 to 10 cm between four rice plants. A spacing of 0.20 m × 0.20 m respectively between plants and between seeding lines was observed. Figure 3 shows the technique of granule placement and picture 1 shows the technique of granule placement with the applicator (Picture 1).
7) Harvest/drying/threshing
Harvesting was carried out in two stages, first the yield square, which consisted of cutting the plants at about 10 cm from the ground for each treatment and the elementary plots.
Drying consisted of spreading the harvest on a tarpaulin under the sun for five days.
Threshing was done manually five days after harvest.
2.4.5. Parameters Measured and Observed
1) Evaluation of straw and grain yields
Straw and grain yields were assessed by yield squares (1 m × 1 m) at the level of each of the elementary plots. These results were then extrapolated to the hectare.
2) Soil, straw and grain sampling for analysis
Soil: Soil samples were taken at each block using the Zigzag method. They were then mixed and a sample composite was taken. Analyses were done for
![]()
Figure 3. Diagram showing the placement of fertilizer granules between four rice plants.
particle size, water pH, KCl pH, carbon, total nitrogen, total phosphorus, total potassium.
Grains and straws: Samples of grains and straws were taken for analysis to determine N, P and K exports and for calculation of recovery rate (N). For this purpose a composite sample was taken at the level of each treatment.
Soil and plant samples (nitrogen) were analysed at the Heinz Imhof Soil Laboratory (LSHI) of IPR/IFRA in Katibougou.
3) The number of tillers per m2
The number of tillers was counted from the fine tillering to panicle initiation stage on 5 randomly selected plots in the yield square (1 m2). It was obtained by counting in each of the five plots.
4) Thousand seed weight
After counting a thousand seeds per treatment and per block, their weights were determined and averaged to get the average weight.
5) Paddy yield
The yield is generally assessed by the weight of the paddy per unit area (l ha). The method of assessing yield by yield components consists of determining the contribution of each of these components. The relationship between the yield and its components is expressed by the formula below: Weight grains per
6) Grain yield
(1)
Paddy yields were measured over an area of 1 m2 in each treatment.
7) Straw yield
After threshing the rice in the yield square (1 m2), the straw was dried and weighed to obtain the straw weight per m2. Thus, the straw yield is deduced from the following equation:
(2)
8) Nitrogen (Er) recovory efficiency (rate) or apparent nitrogen utiliszation factor (NUCF). It is the ratio between the increase in nitrogen in the biomass of the plant at maturity and the amount of nitrogen supplied.
(3)
Er is the recovery efficiency in kg N per kg N in DPU applied (kg∙kg−1); X is the amount of N absorbed at maturity on fertilized plots (in kg∙N∙ha−1); X0 is the amount of N absorbed at maturity on control plots (in kg∙X∙ha−1) and Xe is the nitrogen fertilizer applied or applied (in kg∙N∙ha−1).
2.4.6. Rainfall Conditions in the Year of the Test
The rainfall recorded during the year 2014-2015 is 1028.6 mm over 51 days, with September being the wettest month (Figure 4).
![]()
Figure 4. Distribution of monthly rainfall totals at the Dalabani station, 2015 [21].
Comparing the last three years of rainfall (2013-2014, 2012-2013, and 2011-2012), we see that it rained a lot this year with 1028.6 mm compared to 914.1 mm, 791.7 mm and 846.3 mm respectively. The month of September 2015 received the greatest amount of rainfall compared to other years that received their greatest amounts of rain in August.
2.4.7. Statistical Analyses of Data
The data collected was entered with the Excel spreadsheet in Microsoft office. The analysis of variance was performed using the GenStat statistical software. The Newman and Keuls test was used to compare means at the 5% threshold.
2.4.8. Chronogram of Activity Completion
The cultural calendar, which is the planning of all the activities of culture in time and space, is shown below in Table 6.
3. Resultats et Discussions
3.1. Separate Effects of the Factors on the Observed Parameters
The results of the analysis of the separate effects of the factors on the observed parameters recorded in Table 7 indicate significant differences between the forms of mineral fertilizers applied with respect to the number of tillers of rice plants and grain yields. On the other hand, no significant differences were observed between the levels of organic fertilization for all observed parameters.
3.1.1. Effects of Organic Fertilisation on the Parameters Observed
1) Effects of organic manure on the number of tillers
The results of the analysis of variance show that organic fertilization had a significant effect on the number of tillers (P > 0.05). The level of fertilization without organic manure (OF) further contributed to the tillering of rice with 16.4 tillers compared to the treatment (OF) with organic manure with 14.87 tillers. Figure 5 shows this trend.
![]()
Table 7. Separate effects of the factors on the observed parameters.
NB: WOF = With Organic Manure, WOF = Without Organic Manure, MG = Mean General Average, NS = Not Significant, S = Significant, CV = Coefficient of Variation.
![]()
Figure 5. Effects of organic manure on the number of tillers.
This low tillering of rice plants in FO could be due to the drought pocket that followed the application of organic manure, which probably hindered the decomposition of organic matter, thus causing the death of the tillers.
2) Effects of organic manure on straw yield
Statistical analysis does not reveal any significant difference between the levels of organic fertilization. On the other hand, Figure 6 shows that organic manure has a higher average (2104 kg/ha) than treatment without organic manure (1792 kg/ha). This trend could be explained by Fertinova’s high nitrogen content (4%), which allowed the plants to keep their greenery until maturity, allowing them to more or less maintain their weight, thus increasing straw yield.
3) Effects of organic manure on the weight 1000 grains
A comparison of 1000 grain weights for different levels of organic fertilization shows that there is no significant difference between 1000 grain weights. The average 1000 grain weights for the different levels are 34.66 grams for the WOF treatment and 34.51 grams for the NOF treatment. The physiognomy of the results is shown in Figure 7.
4) Effects of organic manure on grain yield
Statistical analysis shows no significant difference between the effects of organic manure on grain yield (NOF = 2.471 t/ha; WOF = 2.236 t/ha). Arithmetically the NOF treatment is greater than WOF (see Figure 8).
This difference is probably due to the difference in the number of tillers in the treatments (NOF > WOF).
3.1.2. Effects of the Form of Mineral Fertilizer on the Observed Parameters
1) Effects of mineral fertiliser form on the number of tillers
The results of the analysis of variance indicate a highly significant difference (P > 0.001) between the forms of mineral fertilizer applied with respect to the number of tillers.
The largest number of tillers was observed in group “a” consisting of F0, F2, F3 and F4. This was followed by the “ab” group consisting of F5, followed by the “b” group represented by F1 (treatment with USG), (Figure 9). The F4 treatment (urea + granular DAP with a specific gravity of 2.3 grams) produced the maximum number of tillers.
According to IFDC, 2014 [1] a foot of rice yielded up to more than 100 tillers under the practical DPU demonstration in total water control in the Office du Niger zone in Diabaly. Contrary to our study, the low number of tillers observed in F1 can certainly be due to ecological effects and the poor distribution of rainfall in time and space which caused a pocket of drought during wintering and which mainly negatively affected the diffusion of granules in the soil.
![]()
Figure 6. Effects of organic manure on straw yield.
![]()
Figure 7. Effects of organic manure on the weights 1000 grains.
![]()
Figure 8. Effects of organic manure on grain yield.
![]()
Figure 9. Effects of mineral fertiliser form on the number of tillers.
2) Effects of mineral fertiliser form on straw yield
According to the analysis of variance, all treatments are almost equal. The average is 1948 kg/ha (see Figure 10).
3) Effects of mineral fertiliser form on the weight 1000 grains
The results of the effects of the mineral fertilizer form on the 1000 grain weight did not show a significant difference. However, the arithmetic comparison of the means (Figure 11) shows that the highest weight is obtained in F5 with 34.9 gr, followed by F1 with 34.75 gr. The lowest weight is obtained in F0. According to IFDC (2014) [1], DPU improves the nitrogen efficiency from 30 to 60% with prolonged greening and good grain filling. Contrary to our study, the non-significant difference observed can certainly be due to the new ecology, to the flooding of the plot around the 3rd dekad of August.
4) Effects of mineral fertiliser form on grain yield
For grain yield, statistical analysis gave a significant difference between the form of mineral fertilizer (P > 0.001). This shows that the form of mineral fertiliser significantly increases grain yield. This is all the more remarkable when it comes to group “a” consisting of F0, F2 and F4 treatments. Group “b” had the lowest yield (Figure 12).
According to YAMEOGO (2009) [13], the results of a trial conducted in the Kou Valley in Burkina Faso show that the best yield was obtained with super granular urea (6017 kg/ha) which is significantly different from the yield of the farmer plots (5360 kg/ha). The lowest yield was obtained with the control (4195 kg/ha), which is also significantly different from the yield of the farmer plots. Contrary to our study, the low yield value observed in F1 can certainly be due to the ecology and the rapid release of nitrogen from urea. Figure 12 confirms this trend.
3.2. Effects of the Interaction of Factors on the Observed Parameters
The interaction effects of the factors on the observed parameters are recorded in Table 8.
3.2.1. Effects of the Interaction of Factors on the Number of Tiles
Statistical analysis reveals a highly significant difference in the interaction between the number of tillers of the different factors (Table 8). Group “a” consisting of SFO x FO yielded the largest number of tillers (22), followed by groups “ab, bc, cd and d” respectively. This pattern is illustrated in Figure 13.
![]()
Figure 10. Effects of mineral fertiliser form on straw yield.
![]()
Figure 11. Effects of mineral fertiliser form on weight 1000 grains.
![]()
Figure 12. Effects of mineral fertilizer form on grain yield.
![]()
Table 8. Effects of factor interaction on observed parameters.
![]()
Figure 13. Effect of the interaction of factors on the number of tillers.
3.2.2. Effects of the Interaction of Factors on Straw Yield
According to the analysis of variance, no significant differences were found in the factor interaction effects for the straw yield variable. However, the comparison of the arithmetic means of the treatments is illustrated in Figure 14.
3.2.3. Effects of Factor Interaction on Weight 1000 Grains
According to the analysis of variance, the interaction effects of the factors on the 1000 grain weight are equal with respect to the effects of organic and mineral fertilization (Figure 15).
![]()
Figure 14. Effects of the interaction of factors on straw yield.
![]()
Figure 15. Effects of factor interaction on weight 1000 grains.
3.2.4. Effects of the Interaction of Factors on Grain Yield
The results of the effects of the interaction of factors on grain yield show no significant difference between the factors organic fertilizer and mineral fertilizer form. Figure 16 shows the physiognomy of grain yields in t/ha.
3.3. Nitrogen Content in % in Biomass
The results of the biomass analysis are shown in Table 9.
The table above shows a high nitrogen content in the grains at the USG treatment level (0.62%), followed by the simple urea treatment (0.36%). The low rate was observed at the control treatment level. The same trend was confirmed in straw with the USG treatment in the lead, followed respectively by the treatments with simple urea and the control.
3.4. Recovery (Efficacy) Rate (Er)
The recovery rate or apparent use coefficient is the ratio between the increase in nitrogen in the mature plant (biomass) and the amount of nitrogen applied. It was obtained after calculation and is shown in Table 10.
Table 10 shows the higher nitrogen recovery with USG treatment (34%) compared to treatment with simple urea (9.8%).
![]()
Figure 16. Effects of factor interaction on grain yield.
![]()
Table 9. Nitrogen content in % in biomass. The % nitrogen (N) content in the biomass is shown in the table below.
![]()
Table 10. Cover efficiency. Treatments Nitrogen (N) content in biomass (kg) Quantity of fertiliser applied Recovery rate % Recovery rate.
4. Conclusions
At the end of this study conducted in a farming environment on the forms of mineral fertilizers and the levels of organic fertilization in lowland rice cultivation in the Sikasso zone in Mali, which concerned on the combination of the levels of the different factors of fertilization with a total of 12 treatments. Initially, the physico-chemical characteristics of the 0 - 20 cm depth layer of the soils sampled from the plots before the trial were set up for the evaluation of fertilizer application technologies which are done. The pH of this soil is 4.74, the soils are slightly acidic, low in nitrogen and organic matter, and very low in available phosphorus.
The results of the analysis show that organic fertilization only had a significant effect on tillering with the treatment without organic manure as the greatest number of tiller (16.41). On the other hand, the form of mineral fertilizer had significant and highly significant differences respectively on grain yield and number of tillers. The F4 (Granules (Urea + diammonium phosphate (DAP)) of 1.5 cm of diameter) treatment gave the maximum grain yield (2.68 t/ha) and number of tillers (17.45). The interaction of factors had a significant effect only on the number of tillers, with F0 without urea and DAP (control) having the highest performance with 22 of number of tillers. Maximum N uptake and N recovery were observed at the F1 (UG (Urea’s granule) + DAPS (DAP simple)) treatment level with values of 3455 kg/ha. This work shows the beneficial effect of the F1 treatment (Super granular urea) on our environment as granulation increased the nitrogen recovery rate from 9.8% for prilled urea to 34% for granular urea.
Acknowledgements
The authors are grateful to the program of Master in Integrated Soil Fertilizer Management (ISFM) of Growing Africa’s Agriculture (AGRA) and his Coordinator Dr. Yacouba DIALLO, International Fertilizer Development Center (IFDC) which has provided a platform for this study. In turn, thanks Bakary KONATE of National Seed Service (SSN) of Dalabani and Fousseyni DIALLO, officers of Agriculture of Bougouni cercle.