Time Series Analysis on Reported Cases of Tuberculosis in Minna Niger State Nigeria ()
1. Introduction
Tuberculosis is an infectious disease that usually affects the lungs in particular the population in Minna Niger state in Nigeria, where the study takes place [1]. In their study, they determined the prevalence of tuberculosis in Minna and Suleja area of Niger State using standard microscopic technique and sputa culturing procedure. A total of six hundred (600) patients below 80 years of age were screened and enrolled for the study and the percentage prevalence of the physical appearance of the sputa revealed that muco-purulent (20.0%), purulent (10.8%), mucoid (14.2%), and salivary (46.6%). Their study further revealed that 25.5% (153/600) of the studied participants were positive for Mycobacterium tuberculosis. The most affected age group was between 11 - 40 years with the percentage prevalence of 81.6% compared with the age group between 41-0 years. Male Patients had a higher prevalence at 60.1%, compared to 39.9% in females. The statistical analysis revealed that there was a significant difference with respect to gender and age (p < 0.05). Meanwhile, they only studied the prevalence in 2015 medically but could not predict how the rate of infection would likely be in the nearest future. Meanwhile, this research looks at the present situation of Tuberculosis infection rate and forecast for the future.
Compared with other diseases caused by a single infectious agent, tuberculosis is the second biggest killer globally. In 2015, 1.8 million people died from the disease, with 10.4 million falling ill [2].
In the 18th and 19th centuries, a tuberculosis epidemic rampaged throughout Europe and north America, before the German microbiologist Robert Koch discovered the microbial causes of tuberculosis in 1882. Following Koch’s discovery, the development of vaccines and effective drug treatment led to the belief that the disease was almost defeated indeed at one point the United Nation predicted that tuberculosis (TB) would be eliminated worldwide by 2025.
However, in the mid-1980s, Tuberculosis began to risk worldwide, so that in 1993, the World Health Organization (WHO) declared that tuberculosis was a global emergency; the first time that a disease has been labeled as such. The World Health Organization estimates that nine million people a year get sick with tuberculosis, with three million of these “missed” by health system. Tuberculosis is among the top three (3) causes of death for women aged 15 to 44.
Tuberculosis symptoms (cough, fever, night-sweats, weight loss, etc.) may be mild for many months and people ill with tuberculosis can infect up to 10 - 15 other people through close contact over the course of a year. It is an air-born pathogen, meaning that the bacteria that cause tuberculosis can spread through the air from one person to another.
According to [3], people with compromised immune systems are most at risk of developing active tuberculosis. For instance, HIV suppresses the immune system, making it difficult for the body to control tuberculosis bacteria. People with both HIV and TB are around 20 - 30 percent more likely to develop active TB than those who do not have HIV. Tobacco use has also been found to increase the risk of developing active TB. About 8 of T.B cases worldwide are related to smoking. Furthermore, [3] also stated that people with the following conditions have an increased risk: Diabetes - Certain cancers - Malnutrition - Kidney disease.
Aim and Objectives
The main aim of this research is to fit a time series analysis model that will describe the reported cases of tuberculosis in Niger state. The specific objectives are:
➢ To test for stationarity of tuberculosis patient in Minna, Niger State.
➢ Identification and estimation of the model that best describes the data.
➢ To forecast for future occurrences.
2. Literature Review
Tuberculosis (TB) is a major global health problem. Despite progress made in diagnosis and treatment mortality associated with TB remains high. TB was classified by WHO (World Health Organization) in 2016 as the deadliest infection’s disease with 5,000 deaths per day ( [2] ) multi-drug resistant Tuberculosis (MDR-TB) defined as mycobacterium tuberculosis strain resistant to both Isoniazid and rifampicin represents a threat to global TB control. In 2015, among the 10.4 million new cases of TB disease, 48,000 were confirmed to be MDR-TB and 100,000 were found to have rifampicin resistant TB (RR-TB) and treated with second line TB drugs [4]. Also contributing is HIV/AIDs, a well-known risk factor for TB disease, TB drug resistance and TB related death [5]. Among the 1.8million TB death in 2015, 22% were HIV co-infected and 35% of HIV deaths were due to TB [4]. The emergence of MDR-TB has been sustained by the lack of diagnostics, non-adherence to first line treatment, retreatment failure and poor second line therapy success in many countries (Mc Bride et al., 2017). Several risk factors have been associated with MDR-TB. History of prior TB treatment, HIV infection, contact with a known TB patient, receipt of more than two treatment courses, the large burden of bacilli on sputum microscopy, long cavitation and bilateral lung disease [6] [7]. Since 2010, the World Health Organization (WHO) recommended GeneXpert MTB/RIF for rapid detection of rifampicin resistance and diagnosing MDR-TB in more than 90% f those tested [1]. In Mali, the prevalence of MDR-TB was 3.4% and 66.3% respectively in new and previous tested TB patients [8]. The microbiological confirmation of MDR-TD is based on labor-intensive costly and time-consuming culture and drug susceptibility testing (DST) methods that required extensive laboratory infrastructure and are not routinely available in countries with limited resources. These limitations often result in over use of unnecessary second-line TB drugs for individuals with susceptible TB disease and non-tuberculosis Mycobacteria (NTM). We aimed to determine clinical factors associated with microbiologic confirmation of MDR-TB disease among patients suspected of having MDR-TB by clinical criteria in Bamako, Mali. This knowledge is important for clinicians to identify individuals who are most likely to have confirmed MDR-TB in this setting.
Tuberculosis (TB) is a disease caused by germs that are spread from person to person through the air. It usually affects, the lungs, but it can also affect other parts of the body, such as the brain, the kidneys or the spine. A person with TB can die if they do not get treatment [7]. Tuberculosis is a chronic infectious and communicable granulomatous disease caused by mycobacterium tuberculosis [9]. The tubercle bacilli establish infection in the lungs after they are carried in droplets small enough (5 to 10 microns) to reach the alveolar spaces. If the defense system of the host fails to eliminate the infections, the bacilli proliferate inside alveolar macrophages and eventually kill the cells. The infected macrophages produce cytokines and chemokines that attract other phagocyte cells, including monocytes, other alveolar macrophages and neutrophils, which eventually form a Nodular granulomatous structure called the tubercle. If the bacterial replication is not controlled, the tubercle enlarges and the bacilli enter local draining lymph nodes.
This leads to lymphadenopathy, a characteristic clinical manifestation of primary tuberculosis [5].
There are two sources of TB infection human and bovine (connected with domestic and wild mammals). The most common source of infection is the human cases whose sputum is positive for tubercle bacilli and who has either received no treatment or not been treated fully. Among the members of the mycobacterium tuberculosis a human pathogen, whereas mycobacterium bovid has a broad host range and is the principal agent responsible for tuberculosis (TB) in domestic and wild mammals. Mycobacterium bovid also infect human, causing zoonotic TB through ingestion, inhalation and less frequently, by contact with mucous membranes and broken skin. Zoonotic TB is indistinguishable clinically or pathologically from TB caused by M. tuberculosis [9].
Tuberculosis is one of the most common life-threatening infections among the persons living with HIV/AIDs, but it does not inevitably follow that HIV is common in TB patients. Earlier survey conducted in Bangladesh to evaluate the prevalence of HIV in TB patients has shown insignificant levels [10].
People who have Diabetes mellitus (DM) and live with TB patients, they are more risk for developing TB disease. Body immunity is a key power to protect the body from infections disease. Incidence of tuberculosis is greatest among those with conditions impairing immunity such as human immunodeficiency virus (HIV) infection and diabetes [11].
Currently, the standard short-course chemotherapy for TB treatment comprises a 6-month regimen. There are four drugs for the intensive phase Isoniazid (INH), Rifampin (RIF), Pyrazinamide (PZA), Ethambotol (EMB), and two-drugs for continuation phase Isoniazid and Rifampin. The 4-months continuation phase is used for majority of patient’s only two drugs. Although these regimens are broadly applicable, there are modifications that should be made under specified circumstances. Alternative Chemotherapy using most costly and Toxic drugs, often for prolonged duration’s generally 18months is required for multidrug resistant and extensively drug resistant tuberculosis. Directly observed treatment, (DOT) as part of a holistic development of drug resistance in tuberculosis [12].
There are two types of prevention clinical and behavioral preventive measures. Clinical preventions are vaccination with Bacillus calmette Guerin (BCG) and Isoniazid preventive therapy is used to prevent TB infection BCG vaccination significantly reduces the risk of tuberculosis by an average of 50% vaccination with BCG was significantly associated with a reduction in the incidence of Pulmonary tuberculosis and extract Pulmonary disease.
Preventive therapy with Isoniazid reduces the risk of disease among recently children by 60% - 80% and side effects are rare. Preventive treatment among adults with latent tuberculosis infection also has a protective efficacy in the range 60% - 80%, depending on the duration of therapy. Effectiveness is routine practice may be limited by partial uptake and compliance [13].
Effective preventive measures are essential to reduce tuberculosis (TB) transmission. [14] conducted a study to determined knowledge and acceptability of potential patient specific TB infection contract measure in a rural south African community. Their study results showed that most participants (89%) accepted the wearing of face masks in health facilities, but only 42% of TB suspends and 66% of participants accepted separate cohorting in health facilities and avoidance of co-sleeping with uninfected household members.
Another study was conducted by [15] to assess the knowledge of tuberculosis among the general population in North Libya. Their study result shows that 77.4% of respondents knew that a healthy diet can prevent transmission of tuberculosis from one person to another and 43% of respondents know that a well-ventilated home can prevent tuberculosis infection. [16] study found that 56.8% of participants knew that covering the nose and the mouth while coughing or sneezing stops the transmission of tuberculosis. The Practical Approach to Lung Health in Bishkek, Kyrgyzstan by [17] assesses the results of training family doctors in Practical Approach to Lung Health (PAL) techniques. Findings suggest that PAL training has resulted in a decrease by one-third in referrals to hospitals, specialists or diagnostic tests. Data do not show any improvement in tuberculosis case detection. However, in the impact survey the number of drugs prescribed per patient decreased by 13.6% and the average cost of prescription of any drug per patient was reduced by 32.2%. The study suggests that training in standardized PAL guidelines is likely to reduce referral as well as drug prescription costs for respiratory patients.
Summarily, majority of the authors that worked on TB related research in Niger State of Nigeria studied prevalence using percentage analysis which may not be the best to describe the rate of infection and formulation of the best model to predict the future. This study was able to proffer solution to this fault.
3. Research Methodology
The methodology for this research work is time series approach, the method as applied by Box and Jenkins in the year 1970 to 1971 with an iterative six-stages modeling approach: Series stationary, Series transformation, Model identification, Model estimation, Model evaluation, Validation of diagnostic checking, and Forecasting. These procedures will include the tentative stage which involves the identification of the Autoregressive moving average of the prospective model, estimation of ARMA model and the model diagnostic stage.
Before model formulation in time series analysis, stationarity and normality tests for data to be used is very important as stated in objective 1. We used graphical method and Augmented Dickey-Fuller unit root test for stationarity of the data and computations from skewness and kurtosis were used to determine whether the data is normally distributed or not. Statistical explanation is given below:
4. Unit Root Tests (Testing for Series Stationary)
For a univariate time series, the unit root test is frequently employed for testing stationary. The first test is frequently employed for testing stationary. The first test poses the null hypothesis that the given time series has a unit root, which means that the time series is non-stationary and tests if the null hypothesis is to be statistically rejected in favor of the alternative hypothesis that given time series is stationary. To detect whether a given series is non-stationary, let us assume that the relationship between current (in time t) and last value (intime t − 1) in the time series is s follows (Enders, 1995)
(1)
where Xt is an observation values at time t Et is White noise process this model is a first order autoregressive process. The time series X+ converges as t → to a stationary time series if /f/ < 1. If /f/ = 1 or > 1, the series X+ is not stationary and the variance of Xt is time independent in other words, the series has a unit root. The unit root test subsequently tests the following one-sided hypothesis
H0: f = 1 (has a unit root)
H1: f < 1 (has root outside the unit circle)
A well-known test that is valid in large sample is the Augmented Dickey-Fuller test. The optional finite samples test for a unit roof in autoregressive models were developed by John Denis Sargan and Alok Bhargava. Other tests are the Phiolips-person (PP) and kwlathowski-Phillips-Sclimidt-Shin (KPSS) test. This test uses the existence of a unit root as the null hypothesis.
5. Forecasting
One of the most important objectives of time series analysis is to predict its future vales. It is all about making projection into the future from its past values on that basis of a model that effectively describes the evolution of a series.
Forecasting Based on Conditional Expectation
Let yt be determined by a set of variables. Xt observed at data t are the past values. Suppose a forecast of yt+1 is required base on m most recent values Xt would consist of a constant plus Xt yt−1, …
6. Analysis and Interpretation
6.1. Stationarity Test
The time plot shown in Figure 1 revealed that the trend of reported cases of tuberculosis in Minna General Hospital data is not stationary and it implies that the monthly records of tuberculosis cases do not maintain an identical pattern during corresponding period of successive years significantly from 2007-2018. More so, the unit root test shown in section 4.2 also, revealed the P-value of 0.1620, which means the result is not significant at 1%, 5% and 10% significant levels. We now accept H0 and conclude that there is unit root (i.e. the data is not stationary).
6.2. Unit Root (ADF) Test
Results of Augmented Dickey-fuller Test at Level
*MacKinnon (1996) one-sided p-values.
![]()
Figure 1. Time plot of reported tuberculosis patients.
6.2.1. Trend Estimation (Tt)
Figure 2 below shows the trend of tuberculosis patients reported in Minna General Hospital. The trend which is the red line in the chart refers to the general direction in which time plot appears to be moving and it is trending downward with fact of negative slope. This is an indication that as the year increases, there is tendency of decrease in the number of people infected by TB.
6.2.2. Descriptive Statistics of Tuberculosis Patients Reported in General Hospital Minna
The summary of the descriptive statistics of this research work is presented below. The skewness is an indicator of the asymmetry or deviation of the variables from a normal distribution with an expected value of zero, the kurtosis defines the degree of flattening or peakedness of a distribution with an expected value of three. More so, It can be shown from Table 1 and Figure 3 below that the monthly records of reported cases of tuberculosis patients in Minna General Hospital is not stationary with chart of normal distribution that is skewed to the right with the value of 1.02, mean of 19.03 and S.D of 13.49 which means the variable of tuberculosis record possessed a skewness greater than zero (positively skewed), kurtosis of the variable is peaked with the value of 0.48.
6.3. Stationarity Test at First Difference
Since the result above is not stationary, in principle we have to compute the first difference of the data and rerun the augmented DF test.
6.3.1. Results of Augmented Dickey Fuller Test at First Difference
*MacKinnon (1996) one-sided p-values.
![]()
Table 1. Descriptive statistics of tuberculosis of patients’ data.
The new result shows that, the P-value = 0.000 which is less than significant levels at 1.5 and 10%, we have every reason to reject H0 at zero order levels meaning it is stationary.
6.3.2. Time Plot of Reported Tuberculosis Patients after First Differencing
The time series plot below shows that the first differencing of the data of tuberculosis patients reduces with time. It shows that the data is within the range of linearity from 2007-2018 after the process. This was also confirmed in Figure 4 and Figure 5 given below.
It can be affirmed from the above graph and table that the monthly records of reported cases of tuberculosis patients in Minna General Hospital are stationary with the chart of normal distribution that is skew with the value of 0.57, mean of 1.619224E−16 and S.D of 12.44.
6.3.3. Trend Analysis for First Differencing
* NOTE * Zero values of Yt exist; MAPE calculated only for non-zero Yt.
Data First Differencing.
Length 144.
Fitted Trend Equation.
Yt = 0.432898 − 0.00593010 × t.
Accuracy Measures.
MAPE 99.605 MAD 8.875 MSD 153.618.
Model Identification Using Correlogram.
In time series analysis, it is more convenient to use the correlogram table and graph that’s Autocorrelation Function (ACF) and Partial Autocorrelation Function (PACF) for identification of time domain process.
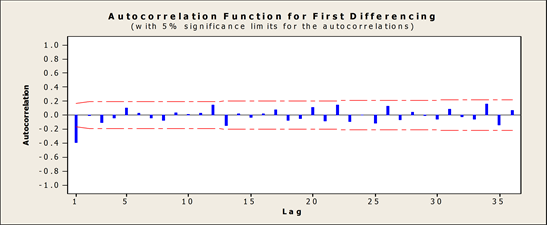
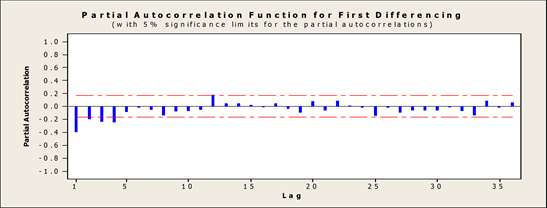
6.4. Correlogram
![]()
Figure 4. Graph of the first differenced data total population of N = 143.
The ACF and PACF from the correlogram above are declining towards zero (0) it shows that there is a trend in the dataset.
The charts below further explained the Autocorrelation and Partial Autocorrelation function of the data at first difference which revealed only one spike at the beginning of plotted data.
7. ARIMA Model Selection
The next stage is now to select the best ARIMA Model (p, d, q) that would be used for forecasting, their goodness of fit has been compared using the following criteria Akaike Information Criteria (AIC) and MAPE. The model with the lowest values would be selected. With careful consideration of all the criteria, ARIMA (2, 1, 3) was found to be the best.
7.1. ARIMA Model: Tuberculosis Patients
Final Estimates of Parameters
Differencing: 1 regular difference.
Number of observations: Original series 144, after differencing 143.
Residuals: SS = 15456.2 (back forecasts excluded).
MS = 112.8 DF = 137.
Modified Box-Pierce (Ljung-Box) Chi-Square statistic.
The Observed and Forecasted Values with Its Lowest and Highest Values Obtained by ARIMA (2, 1, 3) Model
Looking critically in Figure 6 below, the black line represents the actual values, the red is the linear trend model and the green line represents the forecasted values.
7.2. Model Evaluation
Model evaluation is an iterative procedure used to access model adequacy by checking whether the model assumptions are satisfied or not in which one of the basic assumptions is that the error term uncorrelated with zero mean and constant variance.
Base on the graph shown below some of the data seems to be out of the line so further test will carryout to ascertain the adequacy of the model.
![]()
From the graph below it can be seen clearly that the data is normally distributed with pattern less form which shows that the model is a good one. Based on this, there are some degrees of assurance that the data is normally distributed.
8. Summary
This work explicitly explains the concepts of autoregressive integrated moving average (ARIMA). All aim and objectives stated earlier in chapter one was fulfilled. The data were collected from statistics department of general hospital Minna, Niger State based on the monthly records of tuberculosis patients reported in the hospital.
Exploratory data analysis (EDA) known as descriptive statistics and time plot with the trend of the data were obtained. In the course of conducting an exploratory data analysis it was detected that the data cannot be worked on in it raw form, then a unit root test was conducted which confirmed that the is not stationary with the upward and downward movement which shows the non-stationarity of the data with the help of the histogram and statistics as well. Data estimation were carried out using the least square approach and moving average for the derivation of trend variation (Tt). The unit root test for stationarity was performed using Augmented Dicky Fuller.
(ADF) approach and it was confirmed that the data was non-stationary but later passed through differencing once that is d = 1. After conducting data transformation technique likes differencing, the new set of data become stationary in mean confirmed by a unit root test of it differencing shows that the data is stationary at 1%, 5%, and 10% level of significance. Model identification was carryout using the correlogram that is ACF and PACF with graph whereby Akaike Information Criterion was used to determine the order of the ARIMA model.
The model was estimated ARIMA (2, 1, 3) are significant. The model was evaluated using normal probability plot, the residual plot, the histogram, ACF and PACF plot, in which all of them were found to be satisfied at 5% level of significance.
9. Conclusions
From the analysis done in chapter four, the exploratory data analysis (EDA) established that the time plot of the series is fluctuating. This shows that the data is non-stationary with a skew greater than zero and the kurtosis is peak with 0.48 with mean of 19.03 and S.D of 13.49.
The required equation in the trend (Tt) computation for the reported cases of tuberculosis patients in Minna General Hospital by the least square approach was Tt = 24.4544 + 0.0747548t which imply that 24.4544 was the average rate of reported tuberculosis patients between 2007-2018 with 0.07 was the rate of decrease per annum.
It was established that the p-value 0.1620 is greater than the alpha level 0.05 that is (0.1620 > 0.05) using the ADF test of stationarity which led to the conclusion of non-stationary data. In this regard, there is a need for differencing which was performed before the stationarity test was conducted again and it was confirmed stationary after differencing once with p-value = 0.000 < 0.05 then model estimation was conducted. The correlogram revealed that since the autocorrelation function (ACF) does not decay exponentially zero and the partial autocorrelation function (PACF) did not cut off then ARIMA is suspected with the aid of AIC model. Out of AIC values generated, the minimum value that is stationary and invertible occur at the order (2, 1, 3) of ARIMA which is the best model for the data on monthly basis. It implies that p = 2, d = 1, q = 3 with equation Xt + 0.6867Xt−1 − 0.8859Xt−2 = Et + 1.3077Et−1 − 1.2328Et−2 + 0.5788Et−3.
The model evaluation was carried out to check the time series assumptions in term of violation and satisfaction. Model evaluation shows that none of the time series analysis assumptions is violated at 5% level of significance.
The forecast evaluation or prediction indicated from the graph that if proper measures are put in place by the health workers and individual members of the country, there will be a more decrease in the turn out tuberculosis patients.
Recommendation
Base on the findings and conclusions, it is predicted hypothetically and statistically with the formulated model that there will be a decrease in the number of tuberculosis patients in the next five years (2019-2023). The predicted values are obviously lesser than the values of the years under study (2007-2018). It is therefore recommended that:
· The government through the health provider should increase awareness to the public on the causes and consequence of Tuberculosis.
· The people with compromised immune system should be giving special attention because they are the mostly at risk of contracting the disease.
· Direct observe therapy should be encouraged so the health worker will monitor the administration of drugs.
· More effort should put on education and treatment so it can be totally eradicated.