Parallel Multiple Tabu Search for Multiobjective Urban Transit Scheduling Problem ()
1. Introduction
Urban public transportation is an alternative mode for travelers in major cities to commute between destinations. It is undeniable that the evolution of the public transportation system is based on its demand and current technologies. It is also an efficient approach to enhance the ridership and combat the threat posed by motor vehicles, mainly traffic congestion and air pollution. The development of public transportation service must be consistent with the requirement of both passengers and operators in order to create a sustainable system. Some of the major disadvantages of public transportation are the unavailability of the service at desirable times, inconvenience while traveling, and inaccurate transit schedules.
The study on constructing effective schedules for urban public transportation can be formulated as an optimization problem which is known as the Urban Transit Scheduling Problem (UTSP). UTSP can be divided into a few sub-problems that consist of frequency setting, timetabling, vehicle scheduling and crew scheduling since it is usually difficult to solve them simultaneously due to its numerous objectives and decision variables [1]. The determination of headways or frequency serves as tactical planning to satisfy the irregular demand that changes according to time, days and seasons. This process is important to maintain the quality of transit service, because the unexpected arrival and departure times can affect the service reliability and also cause congestion in the transit. Besides, providing higher frequency is redundant at some time periods which reduce the efficiency of the transit service. Usually, the timetables are constructed based on the frequency predetermined while considering the synchronization at transfer nodes. Meanwhile, the vehicles and crews are assigned according to the industry regulation and resources available.
Due to the complexity of the problem, metaheuristic approaches have been widely applied to find near-optimal solutions in a reasonable time. However, the parallel algorithm is seldom being implemented in urban transportation problem which may due to the complication involved in how and where to do parallelism. The parallelization of an algorithm can be done in several ways depending on the problem structure and computer hardware. It is important to consider the type of parallelism to reduce cost and avoid unnecessary communication during data transfer which might increase the execution time for some cases.
Apart from the genetic algorithm (GA), tabu search (TS) and simulated annealing (SA), multiple tabu search (MTS) is an emerging approach in solving the combinatorial optimization problem [2]. However, to the best of our knowledge, MTS has not been applied in solving multiobjective UTSP to date. In this paper, a parallel MTS (PMTS) with systematic neighborhood selection approach is developed by modifying the initialization process and incorporating intensification and diversification procedures to produce optimal solutions. The proposed algorithm is verified and validated using well-known Mandl’s and Mumford’s benchmark datasets. This paper extends the previous sequential methodology in [3] to study multiobjective UTSP using parallel implementation. The main contribution of this paper is the development of parallel MTS algorithm in reducing the computational time of solving the UTSP.
This paper is organized as follows. In Section 2, the review of the related work in this study is presented. The model formulations for frequency optimization as well as bus and driver scheduling are described in Section 3. In Section 4, the development of PMTS algorithm for UTSP is proposed. The computational experiments and results for benchmark datasets are reported in Section 5. Section 6 gives the conclusions and recommendations for future research.
2. Literature Review
Over the years, the evolution of operational research and the development of computing infrastructure have created high interest in tackling UTSP. Various optimization algorithms are proposed to search for the optimal solution effectively. Nevertheless, the ability of the algorithm to obtain optimal or near-optimal solutions in polynomial time for hard optimization problem such as UTSP is still very challenging. Review of the existing approaches in UTSP reveals the shortage of advanced optimization algorithm in handling the large and complex problems [4] [5] [6] [7]. Moreover, the deficiency of multiobjective approaches to solving UTSP is also reflected in the analysis. Due to the scope of this paper, only the study of multiobjective UTSP and the applications of parallel algorithms in public transportation design are discussed.
A multiobjective metaheuristic approach based on TS and GA is developed by [8] to solve bus driver scheduling problem and produce Pareto optimal solutions. Multi-objective set covering model is used to define the problem by including some measures of service quality needed by different companies in the objective function. GRASP has been used as a subroutine for the metaheuristic. A TS with three types of neighborhood selection and intensification strategies for a certain number of iterations are applied to find the best solution. On the other hand, [9] studied the transit route network design using a parallel genetic algorithm (PGA). It includes the determination of a set of transit routes and the associated frequencies that minimize the sum of the operating cost and the generalized travel cost. Two PGA models are proposed which based on the global parallel virtual machine and global message passing interface.
Bus transit network is optimized by developing a model with parallel ant colony optimization [10] [11]. The objectives are to achieve minimum transfers and maximum passenger flow per unit length with line length and non-linear rate as constraints. A heuristic pheromone distribution rule is applied, by which ants’ path searching activities are altered based on the objective value. A parallel auction algorithm is proposed by [12] for bus rescheduling problem (BRP) that occur when a trip is disrupted. A single-depot BRP model is built to minimize the operating and delay cost. The sequential and parallel auction algorithms are developed to solve the BRP. The combined forward and backward auction iterations are used with the implementation of ϵ-scaling to improve the performance of the auction algorithm.
Reference [13] presented a model for optimizing bus route headways that maximize the service quality and minimize the operational cost. The relative weights between the passenger cost and operator cost are determined by an integrated approach. A PGA based on coarse-grain strategy and a local search based on TS are incorporated to improve the performance of the GA. While [14] investigated the transit network design of large urban area (City of Rome) with the objectives to minimize the sum of operator cost, user cost and penalty measuring the level of unsatisfied demand. The contributions of the paper are the introduction of flow concentration procedure in a wider route generation process and the application of transit network design methodology to a large real-life urban area.
A methodology is proposed by [15] to create Pareto solutions for minimizing the number of vehicles and drivers to satisfy a given schedule. Multiple block subsets are chosen from a set of candidate vehicle blocks by improved multiobjective GA with departure-time adjustment procedure. While [16] investigated a multi-objective re-synchronizing of bus timetable problem that characterized by headway-sensitive passenger demand, uneven headways, service regularity, flexible synchronization and involvement of existing bus timetable. A multi-objective optimization model is derived to make a trade-off between the total number of passengers benefited by smooth transfers and the maximal deviation from the departure times of the existing timetable.
The problem of vehicle scheduling in urban public transport systems taking into account the vehicle-type with different capacity is studied by [17]. A heuristic-based on the multi-objective cellular evolutionary algorithm is proposed to solve the problem considering restrictions of government agencies. The objectives of minimizing the total operating cost, waiting time and congestion in the bus and maximizing the quality of service are considered to produce a set of non-dominated solutions that represent different assignments of vehicles to cover the trips of a specific route. While [18] presented an optimization-based approach to simultaneously solve the network design and the frequency setting phases on the context of railway rapid transit networks. A Lexicographic goal programming model is introduced, together with a solving strategy.
Most recently, [19] proposed a single framework that simultaneously considers the restrictions and objectives of the users and operator of a bus rapid transit system. Routes and frequencies were searched for this system by minimizing waste bus capacities (operation costs) and minimizing users’ travel time (maximizing satisfaction). A Multiobjective Global-Best Harmony Search heuristic algorithm is implemented.
There are many studies that investigate UTSP by the different methodological approaches but the time complexity is usually overlooked with the effectiveness of the algorithm. Although several metaheuristic algorithms are derived to solve UTSP, the implementation of parallel techniques to enhance the difficulties of solution procedure while reducing the computational time are seldom considered which is the research gap to be satisfied in this paper.
3. Problem Formulation
UTSP is formulated as a minimization problem taking into consideration of the preferences of passengers and operators. Generally, passengers would prefer to wait with a shorter time while maintaining their comfort and convenience while travelling. On the contrary, operators would be preferred to provide fewer buses and drivers to reduce the operating cost. These objectives are important to improve the overall performance of the public transportation system.
Many researchers combine these objectives into a single function under the resources constraints such as fleet size [20] [21] [22], bus loading [23] [24] and frequency boundary [25]. While, the multiobjective optimization model is employed by [15] [26] [27] to produce Pareto optimal solutions. Similarly, this study also optimizes all the conflicting objectives simultaneously to yield various solutions with different tradeoff levels.
In this study, UTSP is tackled consequently starting from frequency setting where the frequencies of each route are optimized based on the passengers’ demand and total travel time between origin and destination. Then, a timetable is constructed by setting expected departure times for each route using their headways. The timetabling procedure does not involve separate model formulation since its objectives such as demand satisfaction and fleet size are already included in frequency optimization. Besides, the transfer synchronization in constructing timetables is excluded due to the lack of data on passengers’ demand at every bus stop. Finally, the buses and drivers are optimized and assigned correspondingly to all departure times of the routes.
3.1. Frequency Optimization
The frequency optimization procedure can be best represented as a bi-level process. The first level explains the passenger assignment procedure and the second level describes the frequency optimization procedure by PMTS. Passengers’ demand obtained from the first level is used to find the frequency of the route in the second level. The frequency set obtained is used to update the initial frequency and to restart the process. This process is reiterated until the convergence pattern of the frequency set is observed.
Two cases are considered to determine the optimal frequency for each route. The first case assumed that the demand and the frequency of a route are similar throughout the time period studied whereas, for the second case, the problem is extended to change the demand and frequencies of the routes according to the peak and off-peak hours. The total demand is divided into 18 timeslots (1-hour periods) that have been categorized based on the assumed passengers’ traffic. The first case is to test the effectiveness of the proposed algorithm in comparison to other methods in the literature using a similar model. The second case is to evaluate the proposed algorithm using additional criteria such as time-dependent demands that represent a more realistic situation. Since there is no benchmark data available on time-dependent demand for transportation network studied, the demand during peak hours is assumed to be double of the off-peak hours. Let assume the passenger demands for a route is 300 passengers. It is divided in the ratio of 1:2 that represent the demand on off-peak hours to peak hours. Note that, the second case is tested on Mandl’s network only and its results are used to study the bus and driver scheduling problem in the latter section.
To begin with, all routes are initialized with similar frequency before the passenger demands are assigned based on their route choice. Two passenger assignment methods are adopted from [28] [29] as they use a realistic representation of passenger’s behavior and the methods are applied in the comparative studies mentioned in Section 5.2.1. These methods allocate the passengers’ demand based on the frequency share rule and multinomial logit model respectively.
Generally, the passengers are set to travel in a path with at most two transfers and the demand is considered unsatisfied if more than two transfers are needed. Based on [28], when more than one path exists for the same number of transfers, the demands are allocated to the routes within prespecified travel times such that each route carries a proportion of the flow equals to the ratio of its frequency to the sum of frequencies of all acceptable routes. Based on [29], the demands are distributed according to the travel time utility of each path if parallel paths exist with one or two transfers.
After the passenger assignment process, the maximum load of each route is obtained from its list of link flows and used as the input for the frequency optimization procedure. In order to optimize the frequency, a mixed integer programming model is built with the objectives of minimizing the total number of buses, passengers waiting times and overcrowding in the bus. This model is adapted from the literature by considering the overcrowding as one of the objectives rather than constraints with the same formulation.
Minimize
(1)
(2)
(3)
subject to
for all
(4)
where,
: number of passengers travelling between nodes i and j,
: frequency of route k,
: minimum frequency for a time period,
: maximum frequency for a time period,
: maximum load (passengers) of route k,
: vehicle travel time of route k,
CAP: seating capacity of a bus,
LF: load factor of a bus,
R: set of bus routes,
: set of potential routes between node i and j,
T: time horizon,
N : set of nodes in transit network.
Equation (1) calculates the number of buses needed for each route
that obtained by dividing the total round trip times with the time horizon (mins). Equation (2) measures the total waiting times for all the passengers. The waiting time is assumed to be half of the headway. Equation (3) determines the total number of passengers that exceed the maximum capacity of the bus. Equation (4) ensures that the frequency of each route is within the minimum and the maximum frequency for a time period. This model is further extended by including timeslot to find the frequencies of the routes at specific timeslot based on the variable demand. The representation of the new adapted model is as follows.
Minimize
(5)
(6)
(7)
subject to
for all
(8)
where,
: number of passengers travelling between nodes i and j in timeslot s,
: frequency of route k in timeslot s,
: layover time of route k,
: maximum load (passengers) of route k in timeslot s,
DWP: dwell time for a passenger,
S: set of timeslots.
Equation (5) determines the maximum number of buses needed for each route. Note that, the total round trip times includes dwell times and layover times. Dwell time (DWP) states the approximate time taken for boarding or deboarding passengers at every scheduled bus stop whereas layover time (
) refer to the time spent by a bus at the terminals (first and last stop) of a route without moving. Equation (6) measures the total waiting times for all the passengers in every timeslot
while equation (7) calculates the total number of passengers that exceed the maximum capacity of the bus in all timeslots. Equation (8) represents the constraint on the frequency of each route.
Based on the two models, the decision variable is the frequency of the route which is represented as
and
correspondingly and the travel time of a bus between two nodes is shown as
. The parameters such as bus capacity (CAP) and load factor (LF) denote the maximum number of seats available and maximum number of passengers that can be occupied in a bus, respectively. Meanwhile,
and
represent the passengers demand at each route that obtained from the passenger assignment procedure respectively. For further explanation on the models, refer to [3].
3.2. Bus and Driver Scheduling
The proposed technique for solving this problem is inspired by [15] who studied the vehicle scheduling problem. The solution approach is revised by incorporating the elements for bus driver scheduling. Following are the definition of terms related to this sub problem. A trip is a one-way route that begins at a specific time from the starting terminal (bus stop) to ending terminal of a route. A vehicle block is the schedule of a bus that consists of consecutive trips allocated to it. There are two types of vehicle blocks used in this study which are represented as long and short blocks. The elapsed time of a short block is the total work duration whereas, for a long block, the time is doubled to be fulfilled by two drivers. The main idea of this assumption is to simplify the representation of the bus and driver scheduling problem.
At first, a set of vehicle blocks are generated to cover all the departure times according to the total work duration, driver’s break duration and maximum working duration without break, which are set approximately as 9 hours, 1 hour and 4 hours, respectively. Then, a subset of candidate blocks with minimum objective functions values is selected using the proposed algorithm. All selected candidate blocks are reconstructed to minimize further the values of the objective function. The detailed explanation of this procedure is given in Section 4.2.
A set covering model is adapted from [15] to represent the problem and calculate the objective values in order to produce the optimal blocks. The set covering model generates a set of buses that cover all the trips with minimum cost. Moreover, it allows some of the trips to be included in more than one buses which consequently provides various combinations of trips for each bus. The set covering model for simultaneous bus and driver scheduling is formulated as follows:
Minimize
(9)
(10)
subject to
(11)
,
,
,
,
where,
Equations (9) and (10) minimize the number of buses and drivers respectively and Equation (11) ensures that every departure time is covered by at least one trip. The
is a binary matrix that records the availability of departure times in a block whereas the binary decision variable
shows the presence of certain blocks in the chosen solution. The parameter
defines the number of drivers for each block and
is the yth block in a set of vehicle blocks such that q is the total.
The proposed solution approach covers all the departure times by producing extra vehicle blocks at the beginning rather than altering the existing departure times in the optimal blocks to include more departure times. This is due to the adjustment of departure times may affect the headways and layover time determined earlier which consequently have an impact on the robustness of the schedule.
It is important to note that the formulation to calculate the number of buses in this sub problem is different from the frequency optimization problem although both problems are closely related. In the frequency setting, the total buses are computed based on the round trip time of a bus and passengers demand without considering drivers work preferences. In this sub problem, several work rules such as driver’s break duration have been included which can increase the round-trip times of buses. This consequently will increase the number of buses required to maintain the headways found in previous frequency setting problem.
4. Parallel Multiple Tabu Search
The idea of MTS is first proposed by [2] in designing the optimal fuzzy logic proportional-integral controller. The basic TS algorithm might require longer computational time to search for the expected solution if the initial solution is further away from the promising region. Thus, the adapted MTS algorithm is developed to guide the search to the optimal region in less computation time. The basic structure of MTS consists of initialization, adaptive searches, multiple searches, replacing and restarting procedure. MTS algorithm begins by generating several initial solutions to increase the possibility of reaching the optimal region quickly. Then, adaptive search mechanism is applied to alter the step size of the neighborhood during the search and multiple TS algorithms are performed sequentially based on its initial solution.
In this study, the MTS algorithm is adapted such that each of the initial solutions is selected from different feasible domain to examine the search space thoroughly in finding better solutions that minimize all the objective values. The domains are obtained by partitioning the search space into a fixed range of values. This technique can increase the chance of evaluating every possible solution in a reasonable computational time. Besides, intensification and diversification processes are incorporated to exploit and explore the search space when there is no promising solution available. Moreover, two-dimensional tabu list is created to record the availability of elements in an organized memory structure [3].
The proposed PMTS is derived to make use of modern technology with multiple processors for exploring the search space more effectively in less computational time. It works differently for continuous optimization (frequency setting) and discrete optimization (bus and driver scheduling) problems. However, the basic idea of PMTS that finds feasible solutions in a systematic way by dividing the search space into several domains and handling them at the same time is applied in both problems. This research focuses on exploiting the data parallelism in order to partition the data optimally to numerous processors. Each processor performs the same task at the same time but using different data sets. Specifically, the input of the problem is partitioned into a fixed number of processors such that each processor has a distinct range of domain.
The PMTS algorithm is altered according to a master-slave strategy with multiple initial points and single strategy configuration. The parallel search is controlled by a single processor called master which distributes the data equally into several processors called slaves to execute the search in parallel. The slaves will start their search in different search space with different initial points from the data range given and perform similar functions independently. There is some communication between the master and slaves at the beginning to allocate the tasks and data and also at the end of executions when the optimal solutions are gathered at the master processor. Note that the slaves do not communicate directly to each other as there is no data transfer involved between them. The selection of this approach is motivated by the natural design of the MTS algorithm which guides the search separately with specific domain.
The PMTS begins with several initial solutions such that each of them is selected from various domains. All the starting solutions run simultaneously in different processors to search for the best solution in every domain. Explicitly, the search space is divided into a number of domains and each of the domains is allocated with different range/set of values. After the initialization process in continuous optimization, the adaptive search mechanism is applied to find variable step sizes for locating the neighborhood of the current solution to move them to another feasible solution. By referring to Figure 1, the neighborhood is formed by adding and subtracting the step size from each variable in the initial solution. Let
be the step size values such that n represent the domain.
![]()
Figure 1. Neighborhood formation for continuous optimization.
Meanwhile, for discrete optimization, three classifications of the neighborhoods are formed based on add, drop coarse-grain and swap moves from where the best solution is chosen at every iteration. Based on Figure 2, the solutions in first 4 rows are formed by dropping a block from the initial solution; the following solutions are created by swapping and the last solution is formed by adding a new solution. Based on Figure 1 and Figure 2,
represent decision variables such that m is the elements. For example,
is the decision variable of element 1 in first domain.
The use of single or multiple tabu lists depends on the types of move involved during the search that directly influenced by the type of the problem. There are several moves being added or dropped at the same time to create the neighborhood of the current solution. This study applied two-dimensional tabu lists with the same tabu tenure to record the moves with their positions in the list. This approach inhibits repeated moves and enables the search to explore a variety of solutions using organized memory structure. An array, tabulist (a) (b) stores recently chosen solution to mark it as tabu for certain iterations such that a, the row represents the tabu tenure and b, the column represents the maximum number of moves that can be added or dropped. For all moves in the tabu list, the value of a is reduced by 1 at every iteration. The number of columns occupied depends on the number of moves involved in an iteration and it is different for every row.
Intensification is conducted if there is no promising solution available and diversification occurs when the intensification is not possible to be applied. This is because the normal search procedure in the proposed PMTS is good enough to analyze a portion of the whole neighborhood since it is divided earlier. Furthermore, it is unnecessary to spend extra time to examine the regions which are already been visited previously. Intensification is performed based on intermediate memory that functions by recording and updating some best trial solutions produced during the search based on the objective function values of the solutions. Diversification is performed based on long-term memory that counts and stores the number of times that a solution is involved in the current solution. The aspiration criteria allow the tabu move if the neighbor solution yields better result compared to the best-known solution. Termination criteria stop the search if there is no improvement in the objective values after a fixed number of iterations.
![]()
Figure 2. Neighborhood formation for discrete optimization.
4.1. Parallel Multiple Tabu Search for Frequency Optimization
The main idea of frequency optimization is to find the optimal frequency set for each route in a transit network based on the passengers’ demand during a time period. Different frequency sets give different tradeoff between the objectives since this is a multiobjective problem. The specific steps of the PMTS algorithm are described as follows. The pseudo-code of the algorithm for solving the frequency optimization problem is given in Algorithm 1.
STEP 1: Allocate the demand, travel times and routes between the nodes based on the bus network studied. Assign the minimum and maximum frequencies for all routes. Initialize the parallel environment for communication between the master processor and slaves using MPI.
STEP 2: Divide the range of frequency for each route into m number of domains equally such that every domain (processor) has the same interval except the last domain which might be lower if m is not a factor of the frequency range. Choose a random frequency for all the routes to begin the passenger assignment procedure.
STEP 3: Allocate the demand to the routes based on the frequency obtained and their route choice behavior. Send the demand to all the slaves (processors).
STEP 4: Begin the MTS initialization for each slave processor. Assign the random frequencies within the domain boundaries to the routes and set it as the current solution. Represent the initial solutions as a vector of
, such that w is the number of routes. Set the tabu list and intermediate-term memory as empty.
STEP 5: Increase or decrease the frequencies based on the step sizes to find the neighborhood of the current solutions. Check the feasibility, tabu restriction and dominance for each solution in the neighborhood.
STEP 6: If the solution satisfies the constraint, non tabu and dominates the previous current solution, save it in a set of non-dominated solutions, else if the solution is in tabu list, check aspiration criteria before saving the solution in the non-dominated set. Update the set by removing the worst solution each time after a solution is added. Choose a new solution randomly from the set to be assigned as the next current solution. Update the tabu list and intermediate-term memory.
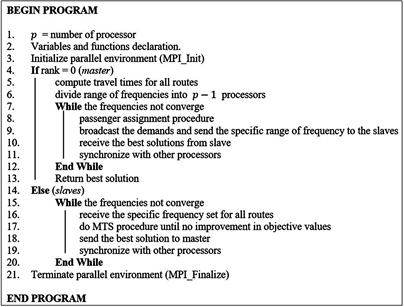
Algorithm 1. PMTS for frequency optimization.
STEP 7: When no dominated solutions are available in the neighborhood, conduct the intensification process by choosing a solution from intermediate-term memory. Alternatively, if the intermediate-term memory is empty, select the least bad solution. Otherwise, initiate the diversification process. If there is no feasible solution in the neighborhood, restart the search from the feasible region.
STEP 8: Repeat STEP 5 - 7 until there is no improvement in the best-known solution for a predefined consecutive iteration. Every slave processor produces a different set of frequency and sent to the master processor.
STEP 9: Check the convergence of the frequencies and if the pattern is not observed, repeat STEP 3 - 8 until the frequency set converged. Else, stop the optimization procedure and record the best solution among the processors.
Following the output obtained from the frequency optimization problem, the timetabling process is initiated by considering two different scenarios such that the first scenario assigns equal departure times to both terminals of the routes to favor the passengers. Meanwhile, the second scenario considers operator’s preference by allocating the times at the starting node only.
Based on the frequency set obtained from PMTS, the headway at each timeslot s of a route k is computed by dividing the total time period with the route’s frequency per timeslot. The departure times for each route are calculated using the headways. Besides that, the one-way travel time at a timeslot is found by the summation of dwell time, vehicle travel time and layover time (assumed to be 10 percent of the travel time). The procedure to determine the departure times for each route are as follows:
STEP 1: Let k = 1.
STEP 2: Set s = 1. Set the first departure time to 300 minutes (5 a.m.) for route k.
STEP 3: Compute the headway of the route k and add the value to the first departure time in route k.
STEP 4: Continue adding the headway consecutively to its previous departure time and store the time in a set after every addition until the number of departure times at timeslot 𝑠 equal to the frequency of route k.
STEP 5: Repeat STEP 3 and 4 for all
, where S is the set of timeslots. Let
.
STEP 6: Repeat STEP 2 - 5 for all
, where R is the set of routes.
4.2. Parallel Multiple Tabu Search for Bus and Driver Scheduling
In this procedure, both buses and drivers are assigned simultaneously to the departure times by assuming that the drivers are assigned to the same bus throughout the working time. Besides, the vehicle blocks formed consist of long and short blocks such that the long blocks need two drivers and short blocks require only one driver which is deduced based on the duration of the blocks. Note that, the lengths of long blocks are equal to the time horizon studied in this research while the short blocks are reduced by half. The bus and driver scheduling are conducted consecutively for all the routes involved. The complete steps in this optimization process are discussed as follows. The pseudo-code of PMTS for bus and driver scheduling is given in Algorithm 2.
STEP 1: Initialize the parallel environment for communication between the master and slaves’ processors using MPI. Assign the departure time and layover time at each timeslot for all the routes.
STEP 2: Determine the set of vehicle blocks that covers all the departure time and the number of drivers for each block. Divide the set of departure time into m number of domains equally such that every domain (processor) has the same number of departure time.
STEP 3: Begin MTS initialization for each slave processor. Select randomly the vehicle blocks that cover each departure time within the domain and set it as the current solution and best solution. Represent the initial solutions as a vector of
, such that each vehicle
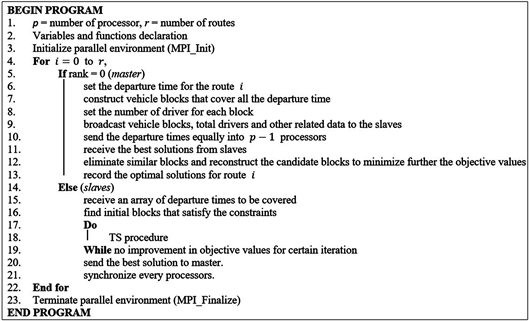
Algorithm 2. PMTS for bus and driver scheduling.
block covers a subset of departure time,
where c is the number of blocks included and e indicates the total departure time covered by each block.
STEP 4: Create two tabu lists to store the add, drop and swap moves. Set it as empty together with intermediate-term memory. Create a neighborhood of the current solution by adding, dropping and swapping corresponding blocks. Check each solution in the neighborhood for its feasibility, tabu restriction, and dominance.
STEP 5: If the solution satisfies the constraint, non-tabu, and dominates the previous current solution, record it in a set of non-dominated solutions, else if, the solution is in tabu list, conduct aspiration criteria before moving the solution to the non-dominated set. Update the set by removing the worst solution each time a solution is added. Then, randomly choose a new solution from the set to be assigned as the next current solution. Update the tabu lists and intermediate-term memory.
STEP 6: When no dominated solution is available in the neighborhood, conduct the intensification process by choosing a solution from intermediate-term memory. Alternatively, if the intermediate-term memory is empty, select the least bad solution. Otherwise, initiate the diversification process. When there is no feasible solution in the neighborhood, perform the constraint handling procedure to modify the neighborhood by adding the blocks that contain the uncovered departure times with another new block which is not included in the current solution and this trial solution.
STEP 7: Repeat STEP 5 - 6 until there is no improvement in the best-known solution for a predefined iteration. Every slave processor produces a set of vehicle blocks and sends them to the master processor.
STEP 8: Combine all the blocks from each processor and remove the similar blocks. As the departure time can be covered by more than one block, eliminate its replicates from the blocks selected randomly. Reconstruct all the blocks to minimize further the number of buses and drivers and record the final solutions.
STEP 9: Repeat STEP 2 - 8 for all the routes in the network.
5. Results and Discussion
5.1. Benchmark Data and Experimental Design
The effectiveness of the proposed PMTS algorithm is assessed on benchmark Mandl’s Swiss network (Figure 3) and Mumford’s large network (Figure 4) based on the parameters given in Table 1 using the following performance metrics as suggested by [30]: total number of buses, total waiting times, average route headways, and maximum route headways.
Computational experiments are conducted for several route sets and compared to various algorithms: heuristic by [28], [31], and [32]; GA with ant-system
![]()
Table 1. Parameters for benchmark instances.
(GA-AS) by [33]; bee colony optimization (BCO) by [34]; GA by [30]; memetic algorithm (MA) by [35], differential evolution (DE) by [36] and sequential multiple tabu search (SMTS) by [3]. Some researchers also contributed their own route sets for this study together with other authors such as [37] [38] [39].
The proposed algorithm is verified with the respective passenger assignment methods and transfer penalties used by the previous authors. The PMTS algorithm is coded in ANSI-C language and executed on a Linux operating system using a High Performance Computer (HPC) system. It has an IBM System X3650 M4 Cluster operating on PUTRAGRID cluster distribution. The algorithm is executed for 10 runs to assess the robustness of the algorithm and each run is able to produce the results for all domains. The parameters for UTSP and PMTS used in this study are given in Table 2.
5.2. Experimental Results of PMTS
5.2.1. Frequency Optimization
Based on Tables 3-8, the first column indicates the source of the route sets of the Mandl’s Swiss network benchmark data. The second column indicates the algorithms used to obtain the optimal results. The next five columns specified the performance metrics values mentioned earlier with the addition of overcrowding. Additionally, CPU execution time are shown to indicate the speed of the algorithm. The solution with lower number of buses, lesser total waiting times, lesser average and maximum headways without overcrowding is considered as the best solution.
The importance of the performance metrics is ranked from the number of buses followed by the total waiting times, average route headways and maximum route headways, consecutively. The solution with the lowest number of buses is given the highest priority to be chosen as the best among the 10 solutions produced. Note that, the average values for the number of buses and the total waiting time are rounded up to the nearest integer.
![]()
Table 2. Parameter configuration for UTSP and PMTS.
![]()
Table 3. Comparison results for 4 routes (Mandl’s Swiss network).
Note: [<1>] = GA by [30]; [<2>] = Heuristic1 by [31]; [<3>] = MA by [15]; [<4>] = BCO by [34]; [<5>] = DE by [36]; [<6>] = Heuristic2 by [28]; [<7>] = Heuristic3 by [32]; [<8>] = GA-AS by [33]; [<9>] = SMTS by [3]; [<10>] = proposed PMTS (average); [<11>] = proposed PMTS (best). a = Passenger assignment based on multinomial logit model; b = Passenger assignment based on frequency share rule; n/a = not available.
![]()
![]()
Table 4. Comparison results for 5 and 6 routes (Mandl’s Swiss network).
![]()
![]()
Table 5. Comparison results for 7 routes (Mandl’s Swiss network).
![]()
![]()
Table 6. Comparison results for 8 routes (Mandl’s Swiss network).
![]()
Table 7. Comparison results for 9, 10 and 11 Routes (Mandl’s Swiss network).
![]()
Table 8. Comparison results for 12 routes (Mandl’s Swiss network).
In the case of 4 routes (refer Table 3), the proposed PMTS algorithm able to minimize the number of buses, total waiting times, average route headways and maximum route headways produced by other authors for all the route sets except [31]. The total waiting times is higher as compared to [31], although the number of buses is reduced by almost half. The increase in waiting times may due to the lower upper bound value fixed for the frequency parameter in this study. A similar pattern can be observed for SMTS algorithm [3] but the CPU time is much higher as compared to the PMTS algorithm. Besides, the average values of total waiting times from all the route sets except [36] [37] [40] are lower than the best solution because there is a possibility to reduce the waiting times by increasing the number of buses scheduled. Note that, the solutions from the two passenger assignment models are also comparable to each other. For [37], only route set of 4 is included for comparison because there are no previously published results are available considering the aforementioned performance criteria for 5 - 12 routes.
For 5 and 6 routes (see Table 4), PMTS algorithm improved all the performance metrics values mentioned earlier for all the previously published results. The CPU time for PMTS is reduced to more than 90 percent of the SMTS by [3] which shows the effectiveness of PMTS algorithm to compute faster. For the routes in [28], two passenger assignment methods using a multinomial logit model and frequency share rule are applied to compare with the respective solutions from the literature. Note that, all the best values of the number of buses and total waiting times are better than average solution even though there is some contradiction for average and maximum route headways.
In the case of 7 routes, Table 5 shows that the proposed PMTS algorithm outperformed the solutions from [30] for their own route sets and the routes from [40]. The PMTS algorithm improved the solution of [30] based on the performance criteria for [34] -(passenger) and [38] but not in a Pareto sense. Similarly, the results from PMTS algorithm is similar to the values from [28] and [36] with the increase in total waiting times and also [34] -(operator) with more buses. Overall, the solutions of the PMTS algorithm for all the route sets are comparable to [3] but with much shorter CPU time. Moreover, all the best values of PMTS algorithm require lesser number of buses as compared to the average values except for [36].
In the case of 8 routes (see Table 6), the solutions from the proposed PMTS algorithm are better than the previous solutions for the routes from all the previous studies except [34] -(operator) and [30]. The number of buses produced by the proposed PMTS algorithms is higher but the total waiting time, the average and maximum route headways are lower for these studies. Alternatively, the proposed PMTS algorithm performed better than [3] for [32] only while producing equivalent results for the others. The values of all performance metrics for the best result are lower compared to average results for most of the route sets.
Furthermore, the proposed PMTS algorithm generates best results as compared to [30] for 9 and 11 routes (see Table 7). For route set of size 10, the results are improved in term of average and maximum route headways although the number of buses increased. The performance of PMTS algorithm is similar to the SMTS algorithm for 9 and 10 routes with slightly longer total waiting times and for 11 routes with a higher number of buses. By considering all the performance metric, the best results of PMTS are superior to its average results for 9 and 10 routes. The total waiting times of best solution are higher for 11 routes since the number of buses is reduced.
Based on Table 8, for 12 routes, our results are preferable as compared to [33], [34] -(operator), and [30] for their respective route sets. Alternatively, the results in this study are comparable with [30] for the routes from [33] and with [34] -(passenger) and [36] for their own route sets. The PMTS algorithm can produce good solutions as SMTS algorithm for all route sets with short CPU time.
The proposed algorithm is further validated using an extended model considering different demands and travel times throughout the time period from 5.00 am to 11.00 pm. The route sets from [36] are experimented by implementing a multinomial logit model for passenger assignment procedure. The average solutions of every domain for the route sets of size 4, 6, 7, 8 and 12 are presented in Tables 9-13.
![]()
Table 9. Results obtained from the extended model for 4 routes.
![]()
Table 10. Results obtained from the extended model for 6 routes.
![]()
Table 11. Results obtained from the extended model for 7 routes.
![]()
Table 12. Results obtained from the extended model for 8 routes.
![]()
Table 13. Results obtained from the extended model for 12 routes.
Generally, the round trip time of a bus affects the number of buses required. Thus, the total buses needed are high as compared to the previous model (without timeslot) since the layover time and dwell time increase the round trip time for a trip. Moreover, as the frequency for peak and off-peak hours is different, the total waiting time also increases. Based on Tables 9-13, there is no overcrowding in the solutions from domain 3 to 10 and domain 3 has the least number of buses among them. Thus, it is more preferable to be chosen for studying bus and driver scheduling problem in the next subsection.
Referring to Table 9, the PMTS algorithm is compared with SMTS of [3] and it shows similar results but with much lesser CPU time. Since the previous study does not include the solutions from other route sets (6, 7, 8 and 12), the comparison between SMTS and PMTS results for the route sets are not available.
Table 10 presents the values for each objective functions with respect to the domains. The first domain which carries lower frequency needs lesser buses butlonger waiting time with high overcrowding as compared to the last domain. The number of passengers exceeds the maximum load factor at some time period due to inadequate frequency.
Based on Table 11, the frequency and number of buses required increases while the total waiting time and overcrowding decreases which reflects the conflicting nature of the objectives. The total buses are up to 240 with 27,118 minutes of waiting time for the headways around 3 minutes from domain 10.
According to Table 12, around 32 buses are needed to satisfy the frequency from domain 1 with respective waiting time and overcrowding. Meanwhile, domain 10 carries the highest number of buses (258) with the least passengers waiting time without overcrowding.
Table 13 displays the 10 non-dominated solutions from all the domains respectively. The highest number of buses is 325 with 23,678 minutes of waiting time. Alternatively, the lowest number of buses required for 12 routes is 39 with 191,747 minutes of total waiting time and 2886 passengers who exceed the fixed load factor of the bus.
On the other hand, the proposed algorithm is also tested for Mumford’s network using the route sets from [41]. Mumford 0, Mumford 1, Mumford 2 and Mumford 3 are different in term of the number of nodes and links, route size and total demands. These parameter values are increasing according to the instances from 0 to 3 such that Mumford 3 has a more complex network and highest number of routes. The average results of 10 runs for each domain are presented in Table 14. Since there is no previous solution for Mumford’s network considering the number of buses, total waiting time, overcrowding, average route headways, and maximum route headways; the comparison of the results is not possible. Therefore, the values from all the 10 domains are presented.
The computational time for Mumford’s network is quite long which is around 4 days for each run. This is due to the passenger assignment procedure that has to be conducted at every iteration to calculate the total waiting times. Moreover, as the number of routes increases, the CPU time also increases.
![]()
Table 14. Average solutions of 10 domains for mumford’s network.
5.2.2. Bus and Driver Scheduling
As mentioned earlier in Section 3.2, two different scenarios favoring passengers (Scenario 1, S1) and operators (Scenario 2, S2) are studied regarding the allocation of the departure times at the origin and destination of a route. Each scenario is performed for 10 runs and the average and best solution (marked with “*”) are recorded. The solution with a lower number of buses compared to the average value is marked as best although the number of drivers is higher. This is because fewer buses indicate more long blocks are produced which consequently need more drivers. The performance of the proposed PMTS algorithm is compared with SMTS by [3]. The input data such as frequency and one-away travel time of the routes are obtained using the solutions of domain 3 in Tables 9-13.
Based on Table 15 and Table 16, the total buses and drivers are greater for S1 as compared to S2 since the departure times to be covered are higher for the former. Both scenarios are equivalent to each other by considering different perspectives of passengers and operators respectively. It provides more choices for the decision makers to implement in a real system. The solution from S1 is presented as an example to show the ability of reconstruction procedure to allocate more departure times for buses and drivers. On the other hand, there is no significant difference between the effectiveness of SMTS and PMTS algorithms except the CPU times is reduced to more than 50 percent by the parallel implementation.
The bus and driver schedule of S1 for 4 routes from [36] are presented in Appendix A (Tables A1-A4). It shows the bus number and drivers that cover the
respective departure times in the time period at the first stop (origin) and last stop (destination) of a route. Based on TableA1, the total number of buses and drivers needed for the first route are 23 and 34 respectively. Each departure time is assigned to a specific bus and driver according to the travel time and working period.
TableA2 shows that route 2 require 38 buses and 57 drivers to cover all the departure time. The buses and drivers are allocated according to the type of blocks. TableA3 indicates the buses and drivers that work at every departure time to ensure effective distribution of the resources. The schedule consists of 22 buses and 29 drivers. Similarly, TableA4 presents the sequence of departure times from the perspective of passengers for a time period of 18 hours. A total of 23 buses and 34 drivers are allocated to the times.
6. Conclusions
In this paper, a procedure for solving UTSP which consists of frequency optimization, timetabling, and bus and driver scheduling is proposed. A mixed integer multiobjective model is constructed to optimize the frequency of the routes by minimizing the number of buses, passenger’s waiting times and overcrowding by considering the preferences of passengers and operators to find the optimal solution. The model is further extended by including timeslots to find the frequencies during peak and off-peak hours throughout the time period.
The main contribution of this paper is the development of PMTS algorithm by modifying the initialization process and incorporating intensification and diversification approaches to guide the search effectively in order to obtain better solutions. The efficiency of the proposed PMTS algorithm is tested on Mandl’s benchmark datasets using the route sets published from the literature. The results indicate that the frequency set obtained, improved the number of buses and total waiting times in most cases from the literature. Moreover, the extended model which includes timeslot produced a higher number of buses and longer waiting times since it includes dwelling time, layover times and generates different frequency according to the demands and travel times during the time period.
Acknowledgements
This research was supported by Ministry of Higher Education (MOHE) through Fundamental Research Grant Scheme (FRGS/1/2016/STG06/UPM/02/8).
Appendix A
![]()
![]()
Table A1. Schedule for route #1 of 4 routes.
![]()
![]()
Table A2. Schedule for route #2 of 4 routes.
![]()
![]()
Table A3. Schedule for route #3 of 4 routes.
![]()
![]()
![]()
Table A4. Schedule for route #4 of 4 routes.