 Smart Grid and Renewable Energy, 2009, 43–53 Published Online September 2009 (http://www.SciRP.org/journal/sgre/). 1 Valuing the Attributes of Renewable Energy Investments ABSTRACT Increasing the proportion of power derived from renewable energy sources is becoming an increasingly important part of many countries’s strategies to achieve reductions in greenhouse gas emissions. However, renewable energy in- vestments can often have external costs and benefits, which need to be taken into account if socially optimal investments are to be made. This paper attempts to estimate the magnitude of these external costs and benefits for the case of re- newable technologies in Scotland, a country which has set particularly ambitious targets for expanding renewable en- ergy. The external effects we consider are those on landscape quality, wildlife and air quality. We also consider the welfare implications of different investment strategies for employment and electricity prices. The methodology used to do this is the choice experiment technique. Renewable technologies considered include hydro, on-shore and off-shore wind power and biomass. Welfare changes for different combinations of impacts associated with different investment strategies are estimated. We also test for differences in preferences towards these impacts between urban and rural communities, and between high-and low-income households. © 2004 Published by Elsevier Ltd. Keywords: Renewable Energy; External Costs and Benefits; Choice Experiments 1. Introduction Increasing the proportion of power derived from renew- able energy sources is becoming an increasingly impor- tant part of many country’s strategies to achieve reduc- tions in greenhouse gas (GHG) emissions. However, re- newable energy investments can often have external costs and benefits, which need to be taken into account if socially optimal investments are to be made. This paper attempts to estimate the magnitude of these external costs and benefits for the case of renewable technologies in Scotland, a country which has set particularly ambitious targets for expanding renewable energy. The external effects we consider are those on landscape quality, wild- life and air quality. Unlike other papers in the literature, we do not restrict our investigation to the effects of par- ticular technologies (such as hydro or wind, Alvarez Farizo and Hanley, 2002; Hanley and Nevin, 1999), but consider impacts applicable to a wide range of renewable technologies. We also consider the welfare implications of alternative investment strategies for employment and electricity prices. The methodology used to do this is the choice experiment (CE) technique. Renewable technolo- gies considered include hydro, on-shore and off-shore wind power and biomass. Welfare changes for different combinations of impacts associated with different in- vestment strategies are estimated. We also test for dif- ferences in preferences towards these impacts between urban and rural communities, and between high and low-income households. In what follows, Section 2 sets out some background detail on energy policy in Scotland. Section 3 provides a brief overview of the CE method, whilst in Section 4 we outline the design and conduct of our empirical study. Section 5 presents results from data analysis, including the conditional logit models estimated from the CE data. Section 6 evaluates the welfare effects of alternative in- vestment strategies in renewables, whilst the final section presents some conclusions. 2. Scotland as a Case Study Scotland has recently started down a new path in how it generates electricity (ROS, 2002). The Scottish Execu- tive has set two challenging targets for use of renewable pow- er sources in the next 20 years: * Corresponding author. Tel.: +44 – 141 – 330 – 5982; fax: +44 – 141 – 330 –4940. E-mail address: arielbergmann@yahoo.com (A. Bergmann). 0301–4215/$ - see front matter © 2004 Published by Elsevier Ltd. doi:10.1016/j.enpol.2004.08.035 by 2010, 18% of electricity consumed should come from renewable generation, by 2020, that portion should rise to 40%.  Valuing the Attributes of Renewable Energy Investments 44 Currently only 10% of the electric energy produced in Scotland comes from renewable sources such as wind energy, hydro and waste-to-energy plants. These targets are thus ambitious, as the potential for large-scale hydro is close to fully developed, and as wave energy technol- ogy has not yet been adequately tested on a commercial scale. The 400% increase in clean electricity production will have to come from new energy projects and new technologies. The 2020 goal is three times larger than the negotiated portion Scotland has committed to as its con- tribution the UK’s reduced GHG obligation. Denmark, with a 79% renewable electricity goal by 2030, is the only European Union member with comparable volun- tary goals (de Vries et al., 2003). The major political reasons for promoting renewable energy are external to Scotland. The UK has accepted a legally binding target of reducing emissions of a bundle of GHGs by 12.5% below 1990 emission levels by 2008–2012, as its share of the European Union negoti- ated target of an 8% reduction in GHGs under the Kyoto Protocol. The Energy White Paper “Our energy futurec- reating a low carbon economy”, published in February 2003 by the British Government, includes an even more ambitious path of reducing CO2 emissions by some 60% of current levels by 2060 (DTI, 2003). Currently, the UK Renewables Obligation-a requirement on power supply companies to meet certain minimum fractions of total supply from renewables-has set a target of 10.4% by 2010–2011. The economic reasons for Scotland developing re- new-ables are multifaceted. The first reason is that re- newable energy projects by their very nature should be highly sustainable. There is minimal or no resource de- pletion due to the use of renewables technologies, as compared to gas-, oil- and coal-based energy. Renewable energy projects, as with traditional fossil fuel projects, tend to be capital intensive, so the opportunity to develop and manufacture renewable energy equipment for do- mestic use and international export exists. In 2001, Ves- tas, a major manufacturer of wind turbines, announced a manufacturing facility would be opened in Scotland (Scottish Executive, 2001), although most capital equip- ment is currently imported. There is the potential to transfer some of the job skills learned in the North Sea oil industry to the marine renewables sector, which in- cludes tidal, wave, and ocean current power generation technologies, as the off-shore oil industry declines (a European Marine Energy Centre (EMEC, 2004) was opened on Orkney in 2004 to assist in the advancement of marine energy). Off-shore wind farm development may need this skilled labour pool. England and Wales will have a more difficult time building sufficient re- newables capacity to provide adequate non-fossil fuel energy that their populations will need to meet domestic targets (OXERA, 2002). Scotland, on the other hand, has some of the greatest renewables potential in all of Europe, and therefore may have sufficient excess supplies to trade south of the border. Finally, rural areas of Scotland, with some of the greatest needs for economic development, will be the location of most all land-based renewable energy projects (Hassan et al., 2001). These rural com- munities may well reap benefits from these long-term projects. A fundamental restructuring of the power industry will need to be undertaken to achieve these renewable targets. Since the 1880s in Scotland, as in the rest of the world, the power industry has been organised with a centralised hierarchical technological and management structure. Ever-larger generating facilities based on fossil fuels and nuclear power, and a unified transmission network to distribute the electricity over hundreds of miles, were the model of development. The nature of land-based renew- able energy projects makes this development style tech- nically impossible at this time. Current scale economies dictate that projects like wind farms and biomass genera- tion plants be 3–5% the size of a traditional 1200 MW coal-fired plant. Even the largest wind farms being plann- ed today are only 20% of this size. Also, because of the intermittency problems of renewable sources, greater quantities (measured by megawatt capacity) of generat- ing assets are needed because of the lower average usage of this capacity. Renewable energy projects normally require large amounts of space to capture the energy in wind, water or solar radiation in sufficient quantity to be commercially viable. Dozens of communities in Scotland will therefore likely be impacted by renewable energy projects that will need to be constructed to meet the Scot- tish Executive’s clean energy goals. As noted above, only 10% of electricity in Scotland is currently generated from renewable sources, mainly from hydro power sta- tions (Scottish Executive, 2002b). The biggest current share of generation (44%) is from nuclear stations: how- ever, all of these are planned to close by 2023 (NIA, 2003), and no new nuclear plants are likely to be com- missioned. The primary policy instrument being utilised by the Scottish Executive to motivate what is thus a very large expansion of renewable energy sources is the Renew- ables Obligation (Scotland) (ROS). The ROS has com- bined a demand-push legal requirement for renewable power usage with a supply pull financial incentive pro- gramme to reward private industry for constructing and investing in new renewable energy generation projects. The ROS compels licensed electricity suppliers to source specific quantities of eligible renewable energy for sale to all customers (residential, commercial and industrial), or face financial penalties for the shortfall. The associ- ated increase in electricity costs is shared by all consum- ers and avoids the free-rider problem (Rose et al., 2002). The original minimum supply of renewable power by  Valuing the Attributes of Renewable Energy Investments45 retailers, by quantity, was set at 3% for2002–2003, rose to 4.3% for 2003–2004, and will rise annually to 10.4% in 2010–2011. During the 18 months since the ROS was implemented in April 2002, significant increases in re- newable generation projects have applied for or are mov- ing towards application and planning consent. In all, 1500 MW of capacity has sought consent and another 2500 MW of capacity is near requesting consent (BWEA, 2003). The financial incentives for private investment in re- newable power facilities are created by the use of the renewable obligation certificates (ROCs). Electricity sup- pliers use these certificates as evidence that the required percentage of sales is matched with eligible green power production. The ROCs are traded separately from the actual electricity being generated and had a market price of £45–50 per megawatt during the first year of the ROS. This money is earned by the renewable power generating company and represents revenue above the value of the electricity being sold to the power market. Renewable power generators earned £63–75 per megawatt of pro- duction during the 2002–2003 period as compared to £17–25 per megawatt paid for fossil fuel-powered pro- duction. 3. The Choice Experiment Method Renewable energy investments in Scotland are thus ex- pected to grow rapidly in the near future. These invest- ments will produce a series of potential impacts on the environment, price of electricity and employment. Envi- ronmental impacts will include landscape effects, effects on wildlife and changes in air pollution (e.g. waste to energy plants emit air pollution). Exactly what environ- mental impacts occur, what happens to electricity prices through changes in cost, and any changes in employment, will depend on the exact investment mix (e.g. the balance between on-and off-shore wind farms; the extent of hy- dro developments). Taken together, environmental ef- fects, price effects and employment effects can be thought of as the attributes of a renewable energy strat- egy. Knowing something about the relative economic values of these attributes is important if we wish a re- newables strategy to (i) take some account of public preferences and (ii) take some account of economic efficiency (benefit-cost) concerns. Choice Experiments are an economic valuation method which enables this kind of information to be produced. 3.1 The Characteristics Theory of Value and Random Utility Theory CEs are based on two fundamental building blocks: Lancaster’s characteristics theory of value, and random utility theory (RUT). Lancaster (1966) asserted that the utility derived from a good comes from the characteris- tics of that good, not from consumption of the good itself. Goods normally possess more than one charac- teristic and these characteristics (or attributes) will be shared with many other goods (Lancaster, 1966). The value of a good is then given by the sum of the value of its characteristics. RUT is the second building block. RUT says that not all of the determinants of utility derived by individuals from their choices is directly observable to the research- er, but that an indirect determination of preferences is possible (McFadden, 1974; Manski, 1977). The utility function for a representative consumer can be decom- posed into observable and stochastic sections: , anan an UVe (1) where Uan is the latent, unobservable utility held by consumer n for choice alternative a, Van is the systemic or observable portion of utility that consumer n has for choice alternative a, and ean is the random or unobserv- able portion of the utility that consumer n has for choice alternative a. Research is focussed on a probability func- tion, defined over the alternatives which an individual faces, assuming that the individual will try to maximise their utility (Bennett and Blamey, 2001; Louviere et al., 2000). This probability is expressed as (\)[() ()] nananjn PaCP VeVe jn (2) aj for all j options in choice set Cn, a and n are as previ- ously described, or (\)[() ()] nanjnjna PaCP VVee n (3) aj To empirically estimate (3), and thus to estimate the observable parameters of the utility function, assump- tions are made about the random component of the model. A typical assumption is that these stochastic components are independently and identically distributed (IID) with a Gumbel or Weibull distribution. This leads to the use of multinomial (sometimes called conditional) logit (MNL) models to determine the probabilities of choosing a over j options (Hanley et al., 2001): exp( ) () exp( ) a an jn V PU UjV (4) aj Here, µ is a scale parameter, inversely related to the standard deviation of the error term and not separately identifiable in a single data set. The implications of this are that the estimated β values cannot be directly inter- preted as to their contribution to utility, since they are confounded with the scale parameter. When using the MNL model choices must satisfy the independence from irrelevant alternatives (IIA) property, which means that the addition or subtraction of any option from the choice set will not affect relative probability of individual n choosing any other option (Louviere et al., 2000). Mod- elling constants known as alternative specific constants (ASCs) are typically included in the MNL model. The  Valuing the Attributes of Renewable Energy Investments 46 ASC accounts for variations in choices that are not ex- plained by the attributes or socio-economic variables, and sometimes for a status quo bias (Ben-Akiva and Lerman, 1985). The estimated coefficients of the attributes can be used to estimate the tradeoffs between the attributes that re- spondents would be willing to make. The price attribute can be used in conjunction with the other attributes to determine the willingness-to-pay of respondents for gains or losses of attribute levels. This monetary value is call the “implicit price” or part-worth of the attribute: nonmarket attribute part worthmonetaryattribute (5) The scaling problem noted above is resolved when one attribute coefficient is dividing by another, as in the part-worth equation, since the scale parameter cancels out. 4. Study Design and Implementation To meet Scottish Executive targets, hundreds of renew- able energy projects of all sizes and types of technology have been proposed. These range from large wind farms and new hydroelectric schemes that have significant im- pacts on the countryside and local communities, to small changes like the addition of solar panels to rooftops and district heating plans with impacts that may only be felt by the immediate residents. This paper’s objective is to estimate the value of positive and negative impacts aris- ing from the kind of renewable energy projects that will be developed over the coming years. 4.1 Designing the Choice Experiment In any CE, attributes must be chosen which meet a num- ber of requirements. These are that they are: relevant to the problem being analysed, capable of being understood by the sample popula- tion, and of applicability to policy analysis. Identifying the set of attributes and the levels these take is a key phase in CE design. To this effect, focus groups were conducted with members of the general pub- lic (Dewar, 2003). The objective set to each group was to identify the ‘characteristics’ of ‘green’ electric energy production that were regarded as ‘good’ or ‘bad’. The facilitator had each group identify all the types of re- newable power technologies that they could, and then discuss the good or bad characteristics of each type of energy project. Technologies that were identified were: windmills, hydro schemes (run of river and reservoir), tidal and wave power, solar (photovoltaic and hot water panels) geothermal, various types of biomass or waste combustion like burning municipal solid waste, wood burning, animal and organic waste, natural gas from landfills and fermentation of organics. After identification of the attributes of each technology, the groups were requested to separate into smaller sections of two or three persons, and rank these attributes by im- portance to them. After that exercise, individuals were asked to indicate their personal choices for which char- acteristics were most important or of concern to them. Three characteristics that dominated all others were re- vealed by the focus groups. One was that renewable en- ergy projects have a low environmental impact, and should reduce how we change or pollute the environment. Another was that the projects be aesthe- tically pleasing. This characteristic was a little more contentious because some group members felt that both windmills and reser- voirs are pleasing to observe, while other members felt that large man-made structures took away from nature’s scenic beauty. The final dominant characteristic was that wildlife should not be harmed any further and that pro- jects that improved wildlife should be supported. Other less significant characteristics mentioned by individuals or groups were the creation of jobs, the effect on electric- ity prices, the abundance and sustainability of the re- sources, and more localised control and responsibility for the project. Five key attributes were then chosen, based on these focus groups responses, and also on government state- ments (e.g. Scottish Executive, 2002b) and the literature. The attributes chosen were: impacts on the landscape, impacts on wildlife, impacts on pollution levels, in particular, air pollu- tion, creation of long-term employment opportunities, and potential increases in electric prices to pay for renew- able sources. Once these attributes were determined, a question- naire was constructed that presented the context of re- newable energy development in Scotland. The national commitment by the UK to reduce production of GHGs was explained. Survey participants were told that the survey was not concerned with any specific type of re- newables technology, but with the impacts that could result from development of any renewable energy re- source. The five attributes noted above were described, with examples being given to clarify each type of impact. SPSS (VERSION 10.0) was used to select a set of op- timal choice profiles, which were then combined to make up the choice sets used in the experiment. Table 1 shows the attributes and levels as used in the final design. Given the five attributes and 17 associated levels, 1800 possible profiles exist, which was an unfeasible number to employ in the survey. We thus used a fractional factorial design to reduce this full factorial to 24 profiles that could be used to estimate main effects. This smaller set was also  Valuing the Attributes of Renewable Energy Investments47 Table 1. Attributes and attribute levels designed for orthogonality, which is a desirable, but not a required, mathematical characteristic of choice set con- struction. Twenty different choice sets were thus de- signed and used in the questionnaire, blocked into sets of four (that is, each respondent worked there way through four choice tasks). Combined plans were alternated in the order in which they appeared as a choice set and the or- der of the individual plans were alternated between the first or second within the choice set. This was done to avoid any bias from the ordering of choices. Choice sets were then presented, and the survey par- ticipant was requested to indicate their preference. Each set contained three options. Plans A and B were possible renewable energy projects, each with different attribute levels. A third option of choosing neither was given. This ‘neither’ option, commonly called the opt-out or status quo option, stated that there would be no increase in re- newable energy, that alternative programmes would be implemented to avoid climate change, and that North Sea natural gas usage would be expanded to provide for fu- ture electricity generation. Figure 1 gives an example choice set. The final page of the questionnaire was con- cerned with collecting standard socioeconomic informa- tion about the participant. Information was requested about location of household, number of children, em- ployment in the energy sector, membership in a conser- vation group, age, household income, education attain- ment and amount of last electric bill. Because of budgetary constraints, the design was se- lected to estimate principal effects only. No secondary cross-effects can be determined from the choice design being used. The sample size requirements grow too rap- idly when cross-effects are to be studied. The question- naire and accompanying cover letter were then submitted to a small pretest with regard to their clarity and useful- ness of the information contained. Feedback from this process lead to a revised and shortened version of the cover letter, clarification of some terminology and chan- ges in how the socio-economic information was re- quested in the questionnaire. The questionnaire and other survey materials can be found in Hanley et al. (2004). 4.2 Sample Selection The sampling frame for this project was the Scottish gen- eral public. Our sample population was randomly se- lected from the list of registered voters in eight council districts of Scotland. The districts are Aberdeenshire, Highlands and Islands, Western Isles, Edinburgh, Glas- gow, Stirling, Borders and Dumfries and Galloway. Ap- proximately 250 names were from Glasgow and Edin- burgh, 80 from Aberdeenshire and 30–45 names from each of the other districts. A mail survey was used due to constraints imposed by project funding. Some 547 names were selected and mailed survey packages with a cover letter during the first week of September 2003. As an incentive to participate a £20 prize draw was offered. Three weeks later a follow-up postcard was mailed to encourage the completion and re- turn of the survey. By October 2003, 219 households had returned surveys, a 43% response rate after undeliverables are considered. Two hundred and eleven surveys were received in time to be part of the sample set. Eight surveys were returned too late to be included. Two hundred and eighty-seven households did not respond. This response rate is acceptable, and comparable to other studies (Ek, 2002; Hanley et al., 2001) that had response rates ranging from 44% to 56%, for a survey mailed to the general population. Mail surveys tend to have the lower response rates than telephone or face-to-face interviews (Bateman et al., 2002). The sample group of respondents should also be tested for any self-selection bias, which could result in a biased MNL estimates and WTP amounts. 5. Data Analysis To model the information collected from the question- Attribute Description Levels Landscape The visual impact of a project is dependent on a combination of None, low, moderate, high impact both the size and location Wildlife impact Change in habitat can influence the amount and diversity of species Slight improvement, no impact, slight harm Air pollution Many types of renewable energy projects create no additional air pollution, but some projects do burn non-fossil fuels. These projects produce a very small amount of pollution when compared to electricity generated from coal or natural gas None, slight increase Jobs All renewable energy projects will create new local long-term employment to operate and maintain the projects. Temporary employment increases during the construction phase are not being considered 1–3, 8–12, 20–25 Price Annual increase in household electric bill resulting from expansion of renewable energy projects. An average household pays £270 a year (£68 per quarter) for electricity £0, £7, £16, £29, £45 Alternate specific constants ASC-A Takes value of 1 for Plan A, 0 otherwise. Acts to represent variations that cannot be explained by the attributes or socio- economic variables ASC-B Takes value of 1 for Plan B, 0 otherwise. Acts to represent variations that cannot be explained by the attributes or socio- economic variables 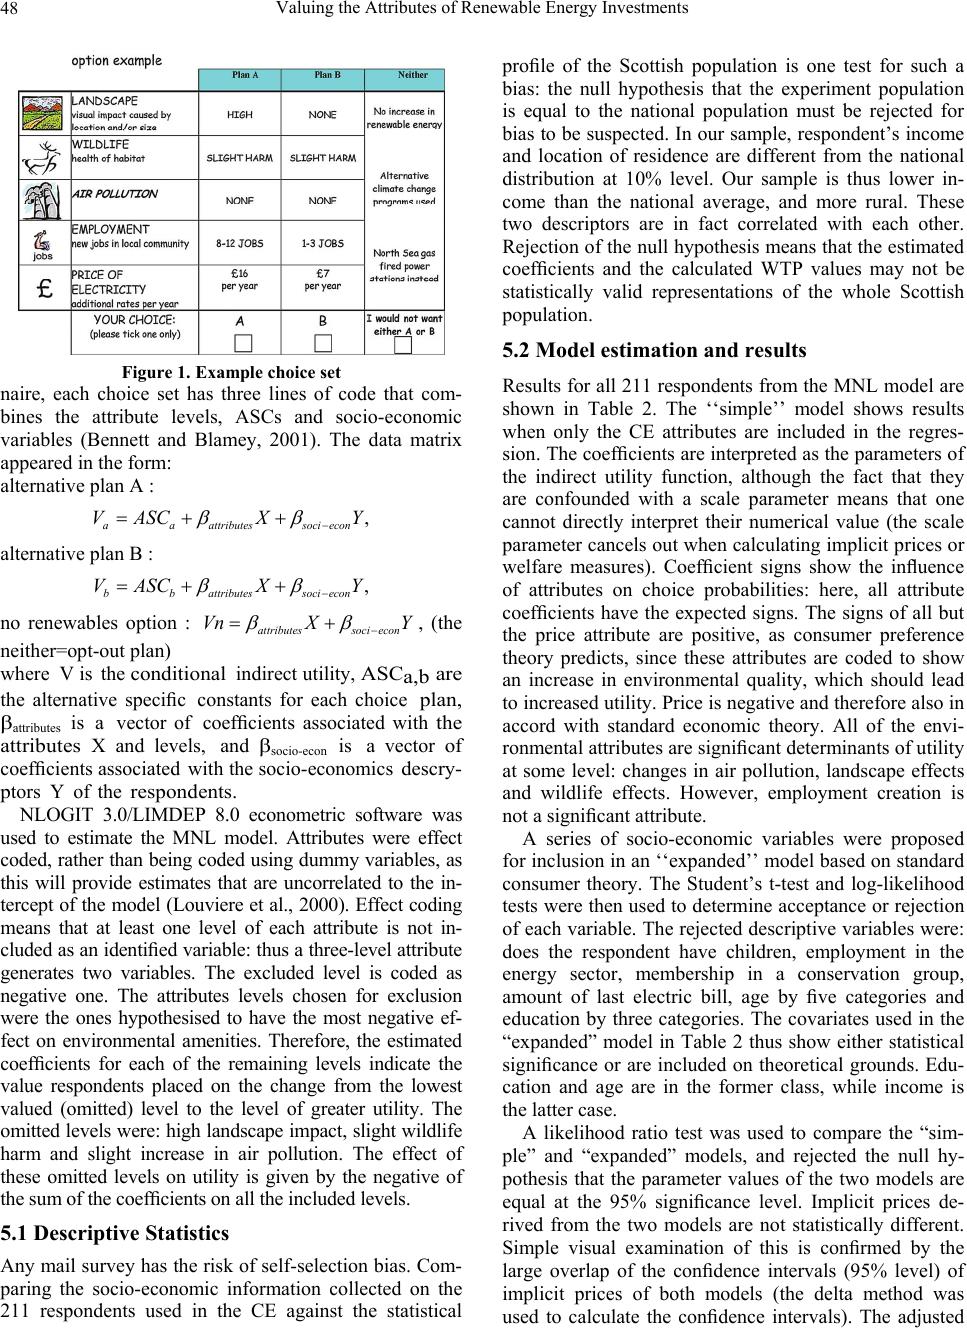 Valuing the Attributes of Renewable Energy Investments 48 Figure 1. Example choice set naire, each choice set has three lines of code that com- bines the attribute levels, ASCs and socio-economic variables (Bennett and Blamey, 2001). The data matrix appeared in the form: alternative plan A : , aaattributessociecon VASCX Y alternative plan B : , bbattributessoci econ VASCX Y no renewables option : attributessoci econ Vn XY , (the neither=opt-out plan) where V is the conditional indirect utility, ASCa,b are the alternative specific constants for each choice plan, β attributes is a vector of coefficients associated with the attributes X and levels, and β socio-econ is a vector of coefficients associated with the socio-economics descry- p tors Y of the respond ents. NLOGIT 3.0/LIMDEP 8.0 econometric software was used to estimate the MNL model. Attributes were effect coded, rather than being coded using dummy variables, as this will provide estimates that are uncorrelated to the in- tercept of the model (Louviere et al., 2000). Effect coding means that at least one level of each attribute is not in- cluded as an identified variable: thus a three-level attribute generates two variables. The excluded level is coded as negative one. The attributes levels chosen for exclusion were the ones hypothesised to have the most negative ef- fect on environmental amenities. Therefore, the estimated coefficients for each of the remaining levels indicate the value respondents placed on the change from the lowest valued (omitted) level to the level of greater utility. The omitted levels were: high landscape impact, slight wildlife harm and slight increase in air pollution. The effect of these omitted levels on utility is given by the negative of the sum of the coefficients on all the included levels. 5.1 Descriptive Statistics Any mail survey has the risk of self-selection bias. Com- paring the socio-economic information collected on the 211 respondents used in the CE against the statistical profile of the Scottish population is one test for such a bias: the null hypothesis that the experiment population is equal to the national population must be rejected for bias to be suspected. In our sample, respondent’s income and location of residence are different from the national distribution at 10% level. Our sample is thus lower in- come than the national average, and more rural. These two descriptors are in fact correlated with each other. Rejection of the null hypothesis means that the estimated coefficients and the calculated WTP values may not be statistically valid representations of the whole Scottish population. 5.2 Model estimation and results Results for all 211 respondents from the MNL model are shown in Table 2. The ‘‘simple’’ model shows results when only the CE attributes are included in the regres- sion. The coefficients are interpreted as the parameters of the indirect utility function, although the fact that they are confounded with a scale parameter means that one cannot directly interpret their numerical value (the scale parameter cancels out when calculating implicit prices or welfare measures). Coefficient signs show the influence of attributes on choice probabilities: here, all attribute coefficients have the expected signs. The signs of all but the price attribute are positive, as consumer preference theory predicts, since these attributes are coded to show an increase in environmental quality, which should lead to increased utility. Price is negative and therefore also in accord with standard economic theory. All of the envi- ronmental attributes are significant determinants of utility at some level: changes in air pollution, landscape effects and wildlife effects. However, employment creation is not a significant attribute. A series of socio-economic variables were proposed for inclusion in an ‘‘expanded’’ model based on standard consumer theory. The Student’s t-test and log-likelihood tests were then used to determine acceptance or rejection of each variable. The rejected descriptive variables were: does the respondent have children, employment in the energy sector, membership in a conservation group, amount of last electric bill, age by five categories and education by three categories. The covariates used in the “expanded” model in Table 2 thus show either statistical significance or are included on theoretical grounds. Edu- cation and age are in the former class, while income is the latter case. A likelihood ratio test was used to compare the “sim- ple” and “expanded” models, and rejected the null hy- pothesis that the parameter values of the two models are equal at the 95% significance level. Implicit prices de- rived from the two models are not statistically different. Simple visual examination of this is confirmed by the large overlap of the confidence intervals (95% level) of implicit prices of both models (the delta method was used to calculate the confidence intervals). The adjusted 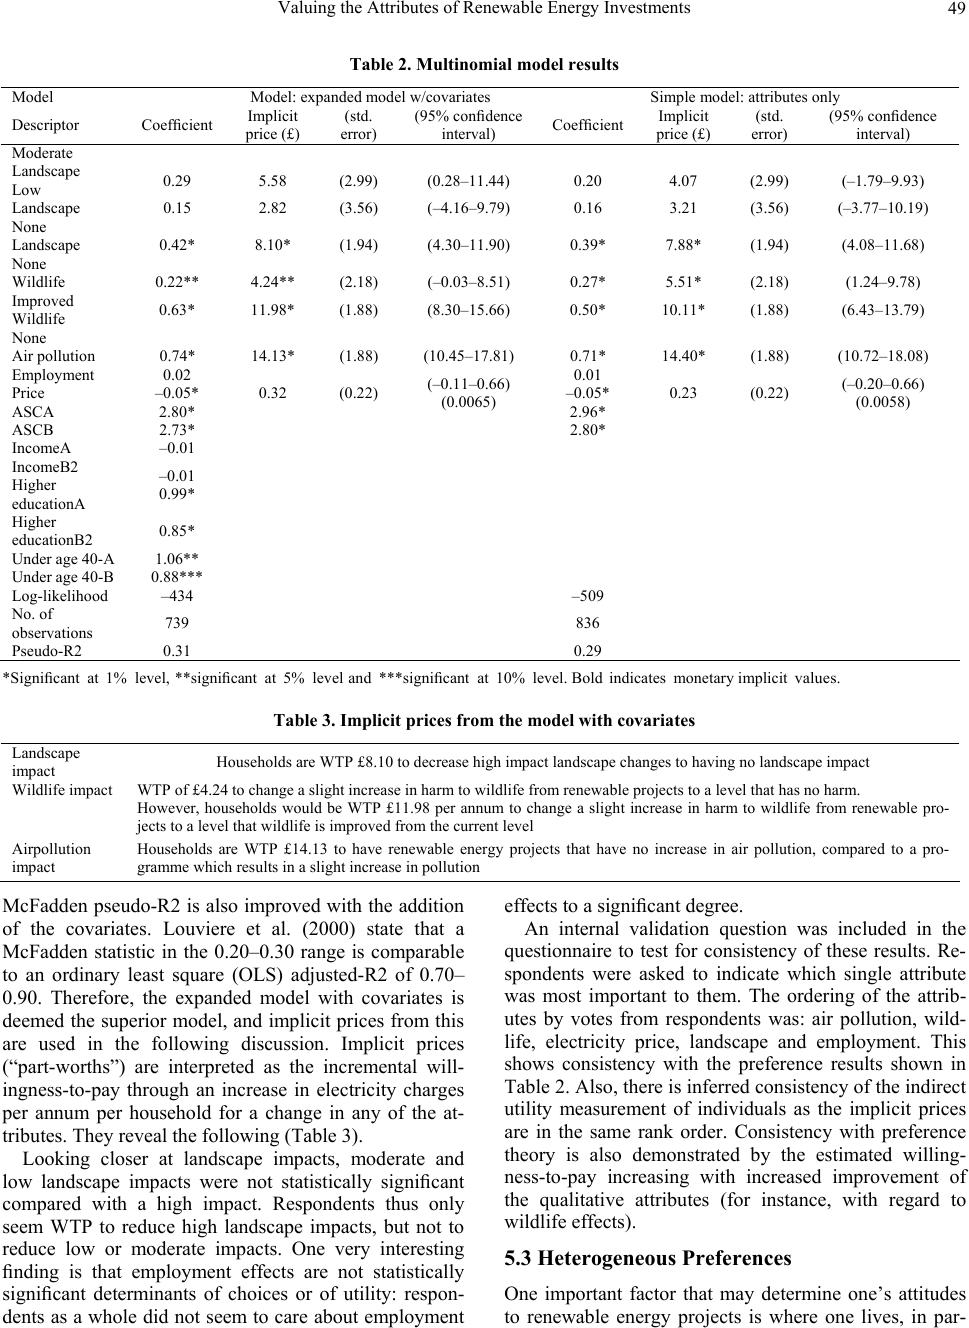 Valuing the Attributes of Renewable Energy Investments49 Table 2. Multinomial model results Model Model: expanded model w/covariates Simple model: attributes only Descriptor Coefficient Implicit price (£) (std. error) (95% confidence interval) Coefficient Implicit price (£) (std. error) (95% confidence interval) Moderate Landscape Low 0.29 5.58 (2.99) (0.28–11.44) 0.20 4.07 (2.99) (–1.79–9.93) Landscape 0.15 2.82 (3.56) (–4.16–9.79) 0.16 3.21 (3.56) (–3.77–10.19) None Landscape 0.42* 8.10* (1.94) (4.30–11.90) 0.39* 7.88* (1.94) (4.08–11.68) None Wildlife 0.22** 4.24** (2.18) (–0.03–8.51) 0.27* 5.51* (2.18) (1.24–9.78) Improved Wildlife 0.63* 11.98* (1.88) (8.30–15.66) 0.50* 10.11* (1.88) (6.43–13.79) None Air pollution 0.74* 14.13* (1.88) (10.45–17.81) 0.71* 14.40* (1.88) (10.72–18.08) Employment Price ASCA 0.02 –0.05* 2.80* 0.32 (0.22) (–0.11–0.66) (0.0065) 0.01 –0.05* 2.96* 0.23 (0.22) (–0.20–0.66) (0.0058) ASCB 2.73* 2.80* IncomeA –0.01 IncomeB2 Higher educationA –0.01 0.99* Higher educationB2 0.85* Under age 40-A 1.06** Under age 40-B 0.88*** Log-likelihood –434 –509 No. of observations 739 836 Pseudo-R2 0.31 0.29 *Significant at 1% level, **significant at 5% level and ***significant at 10% level. Bold indicates monetary implicit values. Table 3. Implicit prices from the model with covariates Landscape impact Households are WTP £8.10 to decrease high impact landscape changes to having no landscape impact Wildlife impact WTP of £4.24 to change a slight increase in harm to wildlife from renewable projects to a level that has no harm. However, households would be WTP £11.98 per annum to change a slight increase in harm to wildlife from renewable pro- jects to a level that wildlife is improved from the current level Airpollution impact Households are WTP £14.13 to have renewable energy projects that have no increase in air pollution, compared to a pro- gramme which results in a slight increase in pollution McFadden pseudo-R2 is also improved with the addition of the covariates. Louviere et al. (2000) state that a McFadden statistic in the 0.20–0.30 range is comparable to an ordinary least square (OLS) adjusted-R2 of 0.70– 0.90. Therefore, the expanded model with covariates is deemed the superior model, and implicit prices from this are used in the following discussion. Implicit prices (“part-worths”) are interpreted as the incremental will- ingness-to-pay through an increase in electricity charges per annum per household for a change in any of the at- tributes. They reveal the following (Table 3). Looking closer at landscape impacts, moderate and low landscape impacts were not statistically significant compared with a high impact. Respondents thus only seem WTP to reduce high landscape impacts, but not to reduce low or moderate impacts. One very interesting finding is that employment effects are not statistically significant determinants of choices or of utility: respon- dents as a whole did not seem to care about employment effects to a significant degree. An internal validation question was included in the questionnaire to test for consistency of these results. Re- spondents were asked to indicate which single attribute was most important to them. The ordering of the attrib- utes by votes from respondents was: air pollution, wild- life, electricity price, landscape and employment. This shows consistency with the preference results shown in Table 2. Also, there is inferred consistency of the indirect utility measurement of individuals as the implicit prices are in the same rank order. Consistency with preference theory is also demonstrated by the estimated willing- ness-to-pay increasing with increased improvement of the qualitative attributes (for instance, with regard to wildlife effects). 5.3 Heterogeneous Preferences One important factor that may determine one’s attitudes to renewable energy projects is where one lives, in par-  Valuing the Attributes of Renewable Energy Investments 50 ticular whether one lives in the countryside or not. A way of testing this in our survey is to examine whether there is a statistical difference between rural and urban esti- mated MNL coefficients and implicit prices. To do this, the sample was partitioned according to place of resi- dence as disclosed in the questionnaire. The sample population was thus segregated into two groups, those located in villages or the countryside and those who re- side in towns and cities. Separate MNL models were then run for each group (Table 4). A likelihood ratio test re- jected the null hypothesis that the segregated subsets were equal at the 5% level. Moderate landscape impacts now register as significant in the rural model, as do jobs. Jobs remain insignificant in the urban sample, but be- come strongly significant in the rural model: this is per- haps unsurprising given most peoples’ likely expecta- tions about where jobs would be created. Note that the McFadden pseudo-R2 for the rural subset has increased to 0.34 from the 0.29 level with the complete sample. Another reason why attitudes towards renewable en- ergy investments might vary across people is their in- come: either because environmental concern is a “lux- ury” (Hokby and Soderqvist, 2003), or because rising energy prices hit poorer households disproportionately hard. To test this hypothesis, the sample was split by annual household income level into two subsamples: low income (£16,000 or less per year) and higher income (greater than £16,000 per year). The log-likelihood ratio test failed to reject the null hypothesis that the two sub- sets were equivalent to the complete sample set: there are no significant differences in preferences therefore be- tween these two income groups. 6. Welfare Analysis for Alternative Investment Plans One of the strengths of CEs is that estimated coefficients of the attributes maybe used to estimate the economic value of different ways in which the attributes can be combined. In the context of this paper, alternative re- newable energy investments may be compared in terms of the welfare changes that they are associated with. To determine the change in economic surplus from possible alternative projects in a multi-attribute MNL model, a “utility difference” is calculated as 12 (1 /)(), monetary ii enonomics surplusVV (6) where V i is the conditional indirect utility associated w it h alternative i. The superscript 1 is the base c ase-here defined as an expansion of an existing fossil fuel po w er plant-and superscript 2 is the alternative r ene w ab le energy case (Bennett and Blamey, 2001). Four different energy project scenarios were con s ide r ed: Large off-shore windmill farm: a 200 MW, 100 tur- bines each at 80 m nacelle hub height, 6–10 km from shore. Large on-shore windmill farm: 160 MW, 80 turbines each at 80 m nacelle hub height. Moderate windmill farm: 50 MW, 30 turbines each at 60 m nacelle hub height. Biomass power plant: 25 MW, emissions stack height up to 40 m, portions of building up to 30 m, fuelled by energy crops. Table 5 gives results for the welfare change of each in- vestment scenario relative to the case, using Equation (6). The above values can be interpreted as the price that households are willing-to-pay (or would have to be of- fered in compensation in case B) on an annual basis to have renewable energy projects with the indicated attrib- ute levels, rather than the base case expansion of fossil fuel power. These Scottish households place the greatest value on off-shore wind farms, with the major determi- nant of the prospective welfare change being the absence of landscape impacts. This result matches with prior pub- lic opinion research in Scotland (Scottish Executive, 2003). The next most valued type of energy project is biomass generation. The major determinant for this type of project being highly valued is the amount of employ- ment that is associated with plant operation and agricul- tural production of the energy crops; and with the wild- life benefits associated with this expansion in biomass production. Most significant of the results presented in Table 5 are the large and substantial negative value placed on large on-shore wind farms by our sample households in Scotland. The high level of landscape in- trusion and the low amount of other beneficial attributes make the promotion and construction of large-scale windmill farms a poor social welfare choice, other things being equal. The negative monetary value indicates that households would have to be compensated in excess of £19 per year for the construction of this type of project, if their utility is to be held constant. It is important, however, to note several caveats. These alternative projects do not produce the same amount of electric power. As an example, two moderately sized wind farms would have to be constructed to generate similar quantities of electricity each year as a biomass generating plant. Quantifying the cumulative effect of numerous projects being constructed in a region is, how- ever, beyond the scope of this paper. 7. Conclusions Renewable energy offers a partial solution to the problem of reducing greenhouse gas emissions whilst meeting future energy needs. Yet different renewable energy pro- jects can have varying external costs in terms of impacts on the landscape, wildlife and air pollution. In addition, strategies vary in their likely impacts on jobs and elec- tricity prices. The choice experiment method used in this paper enables these effects to be jointly evaluated in wel- 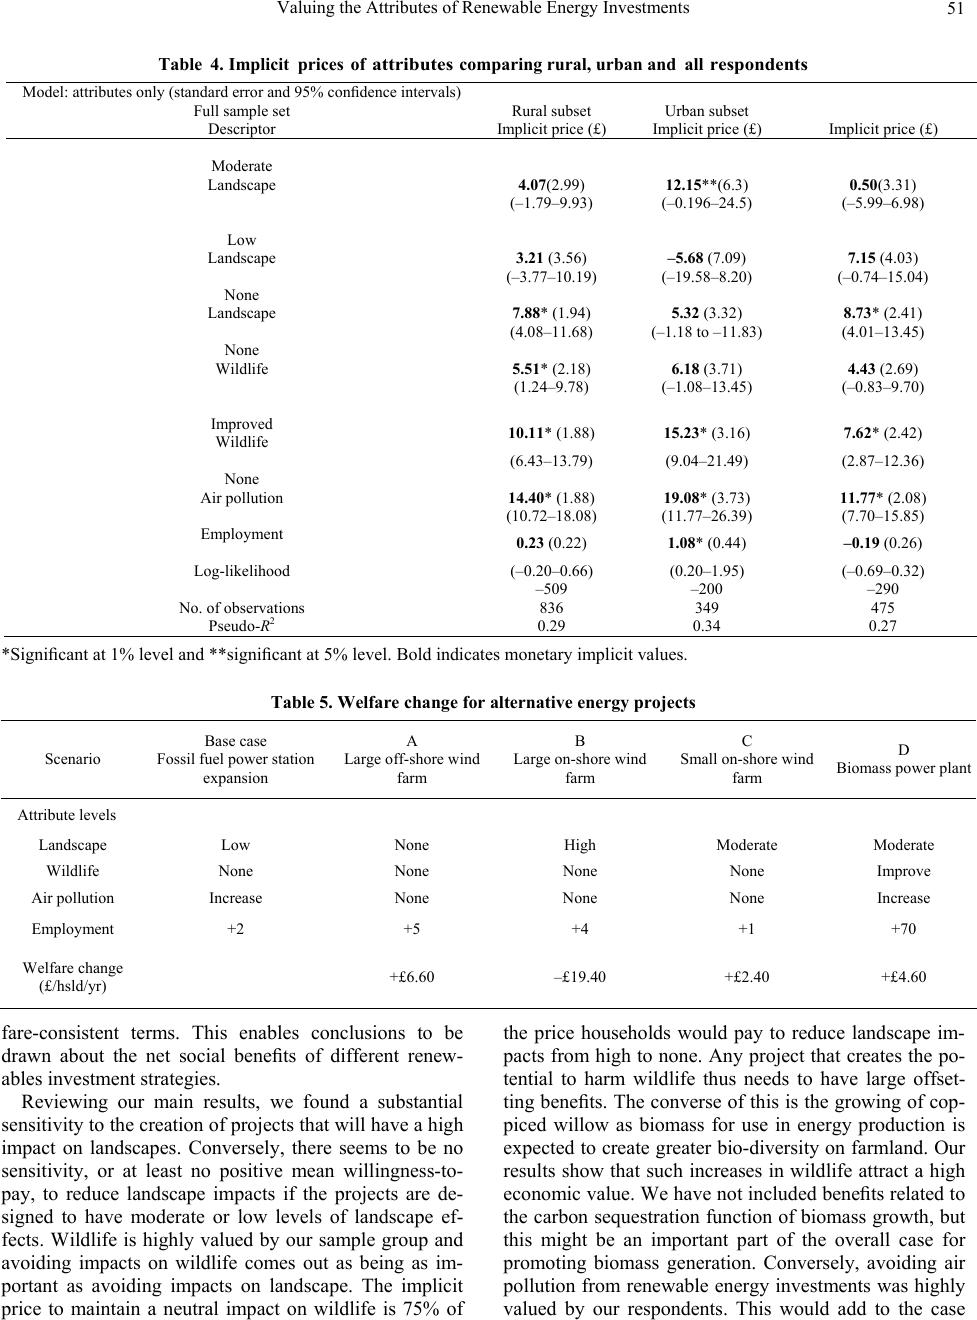 Valuing the Attributes of Renewable Energy Investments51 Table 4. Implicit prices of attributes comparing rural, urban and all responden ts Model: attributes only (standard error and 95% confidence intervals) Full sample set Rural subset Urban subset Descriptor Implicit price (£) Implicit price (£) Implicit price (£) Moderate Landscape 4.07(2.99) 12.15**(6.3) 0.50(3.31) (–1.79–9.93) (–0.196–24.5) (–5.99–6.98) Low Landscape 3.21 (3.56) –5.68 (7.09) 7.15 (4.03) (–3.77–10.19) (–19.58–8.20) (–0.74–15.04) None Landscape 7.88* (1.94) 5.32 (3.32) 8.73* (2.41) (4.08–11.68) (–1.18 to –11.83) (4.01–13.45) None Wildlife 5.51* (2.18) 6.18 (3.71) 4.43 (2.69) (1.24–9.78) (–1.08–13.45) (–0.83–9.70) Improved Wildlife 10.11* (1.88) 15.23* (3.16) 7.62* (2.42) (6.43–13.79) (9.04–21.49) (2.87–12.36) None Air pollution 14.40* (1.88) 19.08* (3.73) 11.77* (2.08) (10.72–18.08) (11.77–26.39) (7.70–15.85) Employment 0.23 (0.22) 1.08* (0.44) –0.19 (0.26) Log-likelihood (–0.20–0.66) (0.20–1.95) (–0.69–0.32) –509 –200 –290 No. of observations 836 349 475 Pseudo-R2 0.29 0.34 0.27 *Significant at 1% level and **significant at 5% level. Bold indicates monetary implicit values. Table 5. Welfare change for alternative energy projects Scenario Base case Fossil fuel power station expansion A Large off-shore wind farm B Large on-shore wind farm C Small on-shore wind farm D Biomass power plant Attribute levels Landscape Low None High Moderate Moderate Wildlife None None None None Improve Air pollution Increase None None None Increase Employment +2 +5 +4 +1 +70 Welfare change (£/hsld/yr) +£6.60 –£19.40 +£2.40 +£4.60 fare-consistent terms. This enables conclusions to be drawn about the net social benefits of different renew- ables investment strategies. Reviewing our main results, we found a substantial sensitivity to the creation of projects that will have a high impact on landscapes. Conversely, there seems to be no sensitivity, or at least no positive mean willingness-to- pay, to reduce landscape impacts if the projects are de- signed to have moderate or low levels of landscape ef- fects. Wildlife is highly valued by our sample group and avoiding impacts on wildlife comes out as being as im- portant as avoiding impacts on landscape. The implicit price to maintain a neutral impact on wildlife is 75% of the price households would pay to reduce landscape im- pacts from high to none. Any project that creates the po- tential to harm wildlife thus needs to have large offset- ting benefits. The converse of this is the growing of cop- piced willow as biomass for use in energy production is expected to create greater bio-diversity on farmland. Our results show that such increases in wildlife attract a high economic value. We have not included benefits related to the carbon sequestration function of biomass growth, but this might be an important part of the overall case for promoting biomass generation. Conversely, avoiding air pollution from renewable energy investments was highly valued by our respondents. This would add to the case  Valuing the Attributes of Renewable Energy Investments 52 against burning biomass for power. Investing in renewable energy might well result, at least over the short to medium term, in an increase in electricity prices. Our results show that, unsurprisingly, increases in prices reduce consumer utility, since the coefficient on price in all of our models is negative and significant. However, we do not find in the survey sample that income groups differ in their preferences towards renewable energy. However, this study did not have a sufficiently large sample to test for those households near the ‘energy poverty’ level. This is an issue for further research. Turning to spatial issues, there are important differ- ences between urban and rural responses in this choice experiment. There is some evidence that accepting nega- tive environmental impacts from the development of projects (e.g. landscape impacts) is more acceptable to the rural population: the rural sample show no willing- ness-to-pay for reducing landscape impacts from high to none. Conversely, rural people value wildlife benefits and reductions in air pollution more highly than their urban cousins (this latter may be due to a perception that biomass combustion was more likely in rural areas, i.e., close to the supply of such material). Finally, we found that employment creation is a statistically and economi- cally significant attribute to the rural sample, but not to the urban sample. Rural respondents would be will- ing-to-pay an additional £1.08 per year from each hous- ehold for each additional full time job created by the re- newable projects. 8. Acknowledgements We thank the Scottish Economic Policy Network for funding the research on which this paper is based, and an anonymous referee for many useful comments. REFERENCES [1] Alvarez Farizo, B., Hanley, N., 2002. Using conjoint analysis to quantify public preferences over the environ- mental impacts of wind farms. Energy Policy 30 (2), 107–116. [2] Bateman, I.J., Carson, R.T., Day, B., Hanemann, M., Hanley, N., Hett, I., Jones-Lee, M., Loomes, G., Mourato, S., Ozdemiroglu, E., Pearce, D., Sugden, R., Swanson, J., 2002. Economic Valuation with Stated Preference Tech- niques: A Manual. Edward Elgar, Cheltenham. [3] Ben-Akiva, M.E., Lerman, S., 1985. Discrete Choice Analysis: Theory and Application Travel Demand. MIT Press, Cambridge, MA. [4] Bennett, J., Blamey, R. (Eds.). 2001. The Choice Model- ling Approach to Environmental Valuation. Edward Elgar, Cheltenham, UK. [5] British Wind Energy Association (BWEA), 2003. Avail- able from/http://www.bwea.com/index.htmlS (Accessed 1 December 2003). [6] de Vries, H.J., Roos, C.J., Beurskens, L.W.M., Kooi- jman-van Dijk, A.L., Uyterlinde, M.A., 2003. Renewable Electricity Policies in Europe: Country Fact Sheets 2003. Energy Research Centre of the Netherlands, Amsterdam, The Netherlands. [7] Dewar, M., 2003. Report for the University of Glasgow Renewable Energy Project: Synopsis of Focus Group Responses. Focus Ecosse, New Lanark. [8] DTI, 2003. Energy White Paper ‘‘Our Energy Future- Creating a Low Carbon Economy’’. HMSO, London. [9] Ek, K., 2002. Valuing the environmental impacts of wind power: a choice experiment approach. Licentiate Thesis, Lulea University of Technology, Sweden, p. 40. http:// epubl.luth.se/1402-1757/2002/40/index-en.html (Accessd 1 December 2003). [10] European Marine Energy Centre (EMEC), 2004. http:// www.emec. org.uk/ (Accessed 1 August 2004). [11] Hanley, N., MacMillan, D., Wright, R., Bullock, C., Simpson, I., Parrisson, D., Crabtree, B., 1998. Contingent valuation versus choice experiments, estimating the benefits of environmentally sensitive areas of Scotland. Journal of Agricultural Economics 49(1), 1–15. [12] Hanley, N., Nevin, C., 1999. Appraising renewable en- ergy developments in remote communities: the case of the North Assynt Estate, Scotland. Energy Policy 27, 527–547. [13] Hanley, N., Mourato, S., Wright, R., 2001. Choice mod- elling approaches: a superior alternative for environ- mental valuation? Journal of Economic Surveys 15 (3), 435–462. [14] Hanley, N., Bergmann, A., Wright, R., 2004. Valuing the Environmental and Employment Impacts of Renewable Energy Investment in Scotland. Scotecon, Stirling. [15] Hassan, Gerald and Partners, Ltd., 2001. Scotland’s Renew- ables Resources 2001, Vols. 1 and 2. Research commis- sioned by Scottish Executive. Document No. 2850/G R/03. [16] Hokby, S., Soderqvist, T., 2003. Elasticities of demand and willingness to pay for environmental services in Sweden. Environmental and Resource Economics 26 (3), 361–383. [17] Lancaster, K., 1966. Anew approach to consumer theory. Journal of Political Economy 74, 132–157. [18] Louviere, J.J., Hensher, D., Swait, J., 2000. Stated Choice Methods: Analysis and Application. University Press, Cambridge. [19] Manski, C., 1977. The Structure of Random Utility Mod- els. Theory and Decision 8, 229–254. [20] McFadden, D., 1974. Conditional logit analysis of quali- tative choice behaviour. In: Zarembka, P. (Ed.), Frontiers in Econometrics. Academic Press, New York. [21] Nuclear Industry Association (NIA), 2003. Available from /http:// www.niauk.org/article_33.shtmlS (Accessed 1 December 2003). [22] OXERA, 2002. A Report to the DTI and the DTLR: Re- gional Renewable Energy Assessments. Oxera Environ-  Valuing the Attributes of Renewable Energy Investments 53 mental, Oxford, UK. [23] Rose, S.K., et al., 2002. The private provision of public goods: test of a provision point mechanism for funding green power programs. Resource and Energy Economics 24, 131–155. [24] Scottish Executive, 2001. Press Release SE 1472/2001, http://www.scotland.gov.uk/news/2001/06/se1472.asp (Accessed 1 August 2004). [25] Scottish Executive, 2002a. Key Scottish Environmental Statistics, 2002. A Scottish Executive National Statistics Publication, Edinburgh. [26] Scottish Executive, 2002b. Securing a Renewable Future: Scotland’s Renewable Energy. HMSO, Edinburgh. [27] Scottish Executive, 2003. Public Attitudes to Wind Farms: A Survey of Local Residents in Scotland. HMSO, Edin- burgh. [28] The Renewables Obligation (Scotland) Order (ROS), 2002. Scottish Statutory Instrument 2002, No. 163. HMSO, Edinburgh.
|